The solar energy industry continues to grow rapidly across the world. Governments promote renewable energy, businesses invest in sustainable production, and consumers increasingly adopt clean power solutions. Because of this rapid expansion, solar panel manufacturing companies must maintain high operational efficiency, strict quality standards, and consistent production performance.
However, many manufacturers still rely on disconnected spreadsheets and manual reporting methods. As a result, managers struggle to track production metrics, compare performance against targets, and identify improvement opportunities on time. Consequently, decision-making becomes slower and less accurate.
So, how can solar panel manufacturers monitor performance efficiently without investing in expensive enterprise software?
The answer is simple — Solar Panel Manufacturing KPI Dashboard in Excel.
This comprehensive guide explains everything you need to know about building and using a Solar Panel Manufacturing KPI Dashboard in Excel. Moreover, you will learn its features, benefits, implementation process, best practices, and frequently asked questions.
Click to Purchases Solar Panel Manufacturing KPI Dashboard in Excel
What Is a Solar Panel Manufacturing KPI Dashboard in Excel?
A Solar Panel Manufacturing KPI Dashboard in Excel is an interactive performance monitoring tool designed to track key manufacturing metrics using structured data visualization and automated calculations.
Instead of reviewing multiple reports, decision-makers can analyze all manufacturing KPIs in one centralized dashboard. Therefore, production teams gain real-time visibility into operational performance.
This dashboard helps organizations:
-
Monitor production efficiency
-
Track quality performance
-
Compare targets vs actual results
-
Analyze monthly and yearly trends
-
Improve operational decisions
Because Excel remains accessible and flexible, companies can implement this solution quickly without complex software deployment.
Click to Purchases Solar Panel Manufacturing KPI Dashboard in Excel
Why Do Solar Panel Manufacturers Need a KPI Dashboard?
Solar panel manufacturing involves multiple processes such as wafer processing, cell production, module assembly, testing, and packaging. Each stage generates performance data. Without structured tracking, teams lose valuable insights.
A KPI dashboard solves these challenges by offering centralized monitoring.
Common Challenges Without a Dashboard
-
Manual reporting consumes excessive time
-
Data exists across multiple files
-
Performance gaps remain unnoticed
-
Target tracking becomes inconsistent
-
Management lacks real-time insights
Therefore, organizations need a structured system that converts raw data into meaningful analytics.
Click to Purchases Solar Panel Manufacturing KPI Dashboard in Excel
Key Features of the Solar Panel Manufacturing KPI Dashboard in Excel
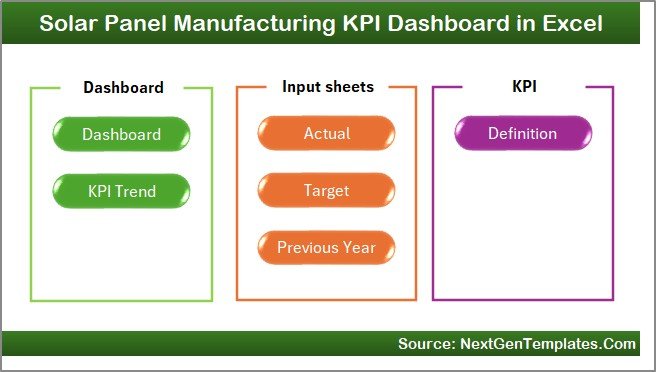
This ready-to-use dashboard includes 7 structured worksheets designed for seamless performance monitoring.
1. Home Sheet – Navigation Center
The Home Sheet works as an index page.
It includes:
-
Six navigation buttons
-
Quick access to all dashboard sections
-
User-friendly interface
-
Easy workflow movement
As a result, users can move between sheets instantly without searching manually.
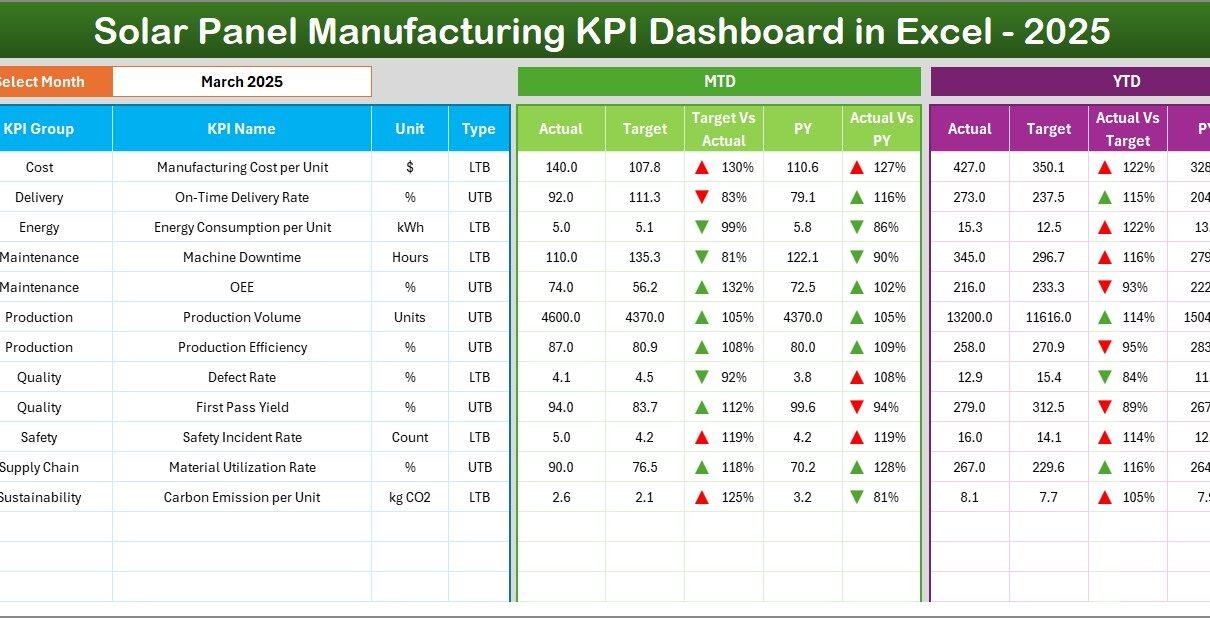
2. Dashboard Sheet – Main Performance Overview
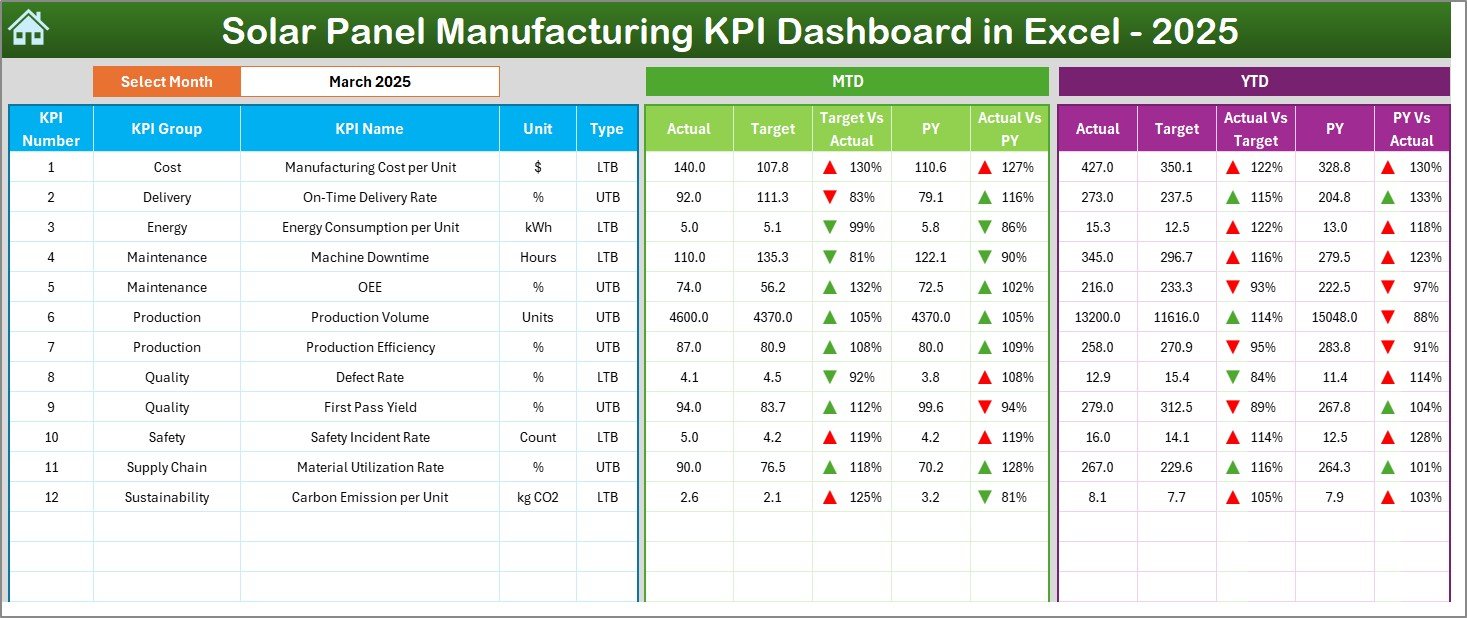
The Dashboard Sheet serves as the core of the system.
Here, users can view all KPIs in a single screen.
Key Functionalities
-
Month selection dropdown in Cell D3
-
Automatic dashboard updates
-
MTD and YTD performance tracking
-
Visual comparison indicators
Metrics Displayed
MTD (Month-To-Date):
-
Actual values
-
Target values
-
Previous year comparison
-
Target vs Actual analysis
-
PY vs Actual comparison
YTD (Year-To-Date):
-
Actual performance
-
Target achievement
-
Historical comparison
-
Conditional formatting arrows
Because of visual indicators, users immediately understand performance direction.
Click to Purchases Solar Panel Manufacturing KPI Dashboard in Excel
3. KPI Trend Sheet – Performance Analysis
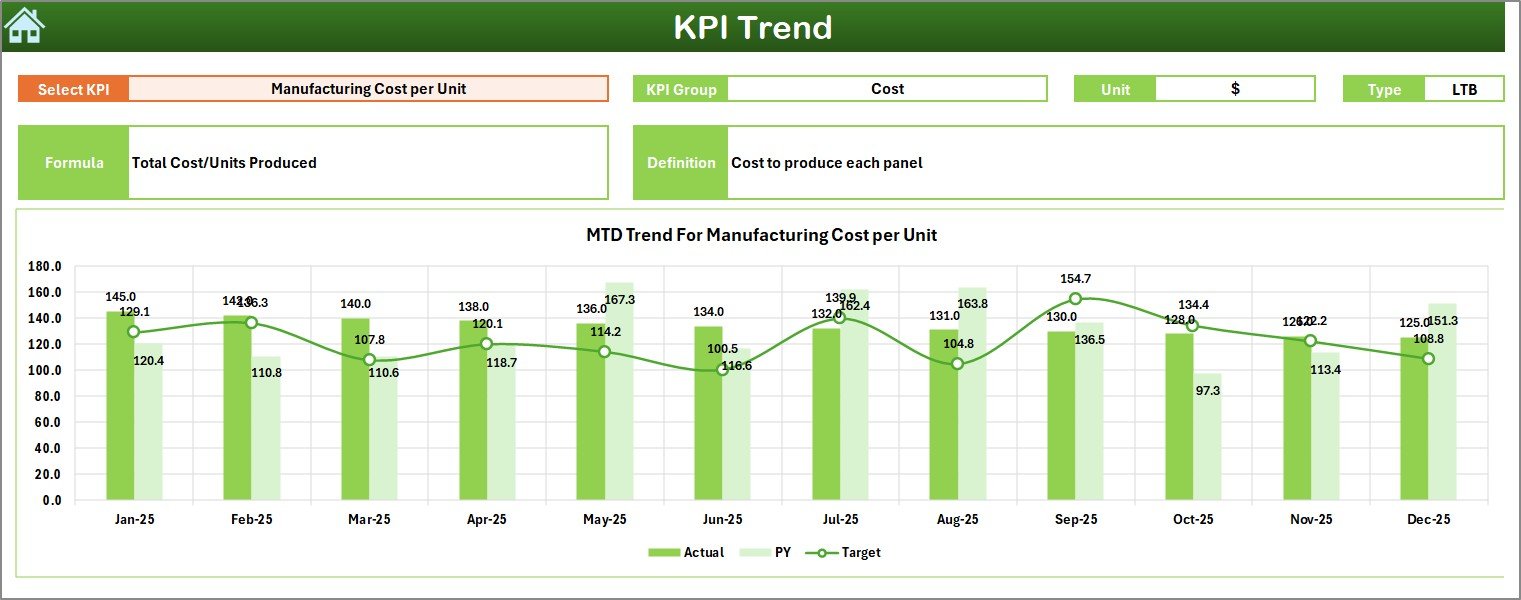
The KPI Trend Sheet helps users analyze trends over time.
Users select a KPI from dropdown Cell C3, and the dashboard updates automatically.
Information Displayed
-
KPI Group
-
KPI Unit
-
KPI Type (Higher is Better / Lower is Better)
-
KPI Formula
-
KPI Definition
Additionally, the sheet displays:
-
MTD Trend Charts
-
YTD Trend Charts
-
Actual vs Target vs Previous Year comparison
Therefore, managers can quickly identify performance patterns and operational issues.
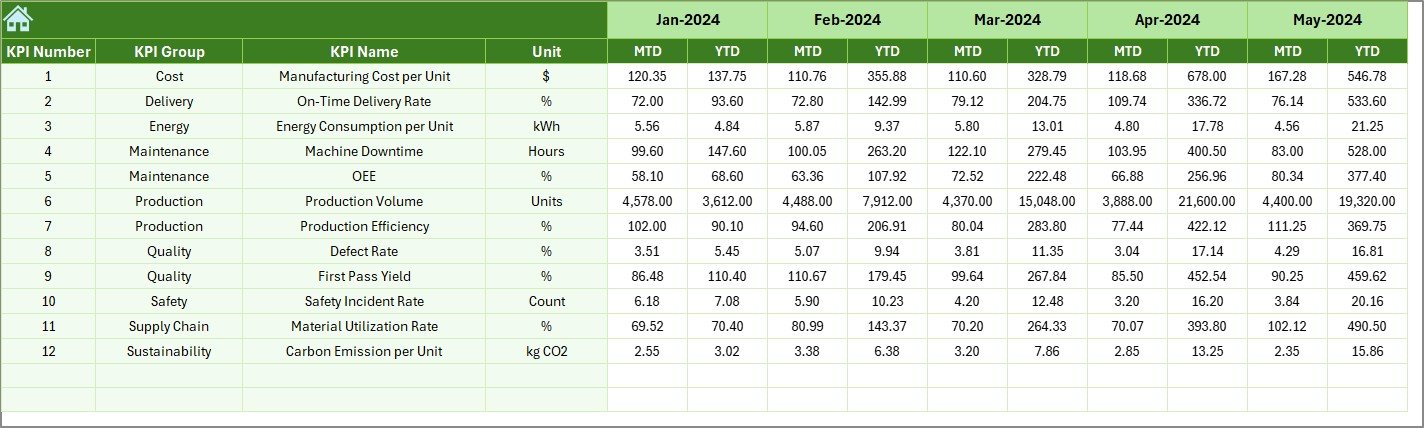
4. Actual Numbers Input Sheet – Data Entry Area
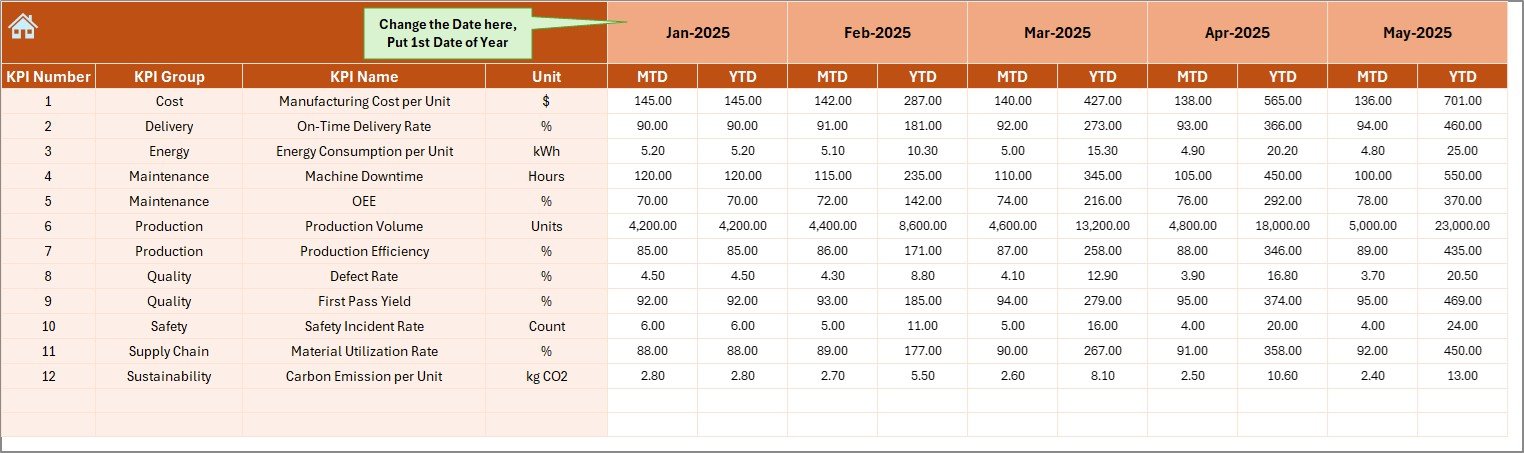
This sheet allows users to input operational data.
How It Works
-
Enter actual KPI numbers monthly
-
Select starting month in Cell E1
-
Automatically calculates YTD values
-
Supports structured data entry
Because the system automates calculations, users avoid manual errors.
Click to Purchases Solar Panel Manufacturing KPI Dashboard in Excel
5. Target Sheet – Performance Planning
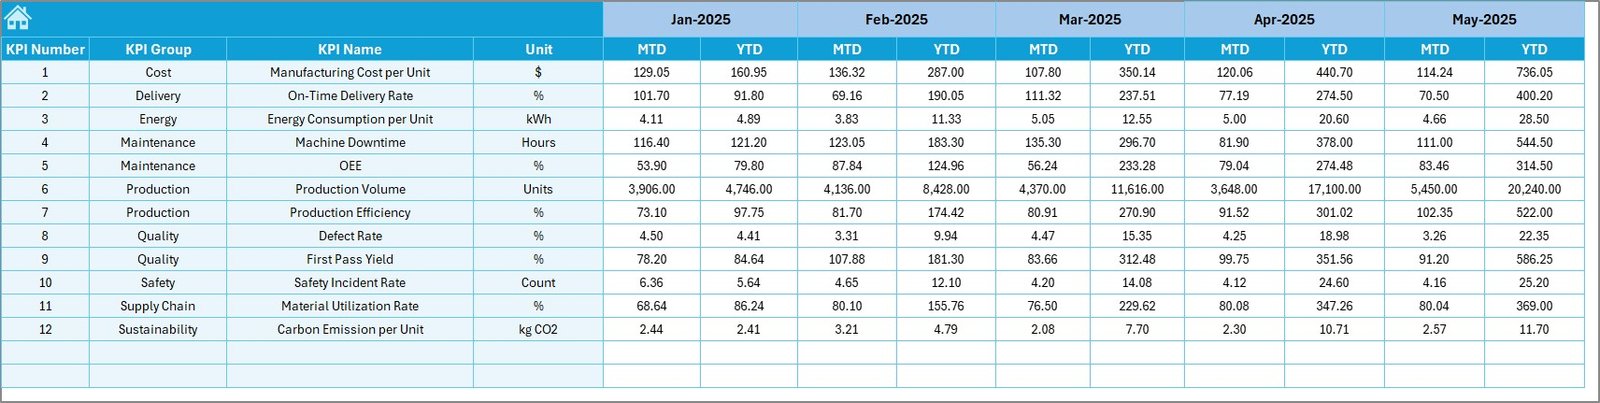
The Target Sheet stores expected KPI performance values.
Users enter:
-
Monthly targets (MTD)
-
Yearly cumulative targets (YTD)
Consequently, the dashboard compares planned performance against actual results automatically.
6. Previous Year Number Sheet – Historical Comparison
Historical data plays a major role in performance evaluation.
In this sheet, users enter:
-
Previous year KPI values
-
Monthly historical numbers
As a result, management can evaluate growth trends and performance improvement.
Click to Purchases Solar Panel Manufacturing KPI Dashboard in Excel
7. KPI Definition Sheet – KPI Documentation
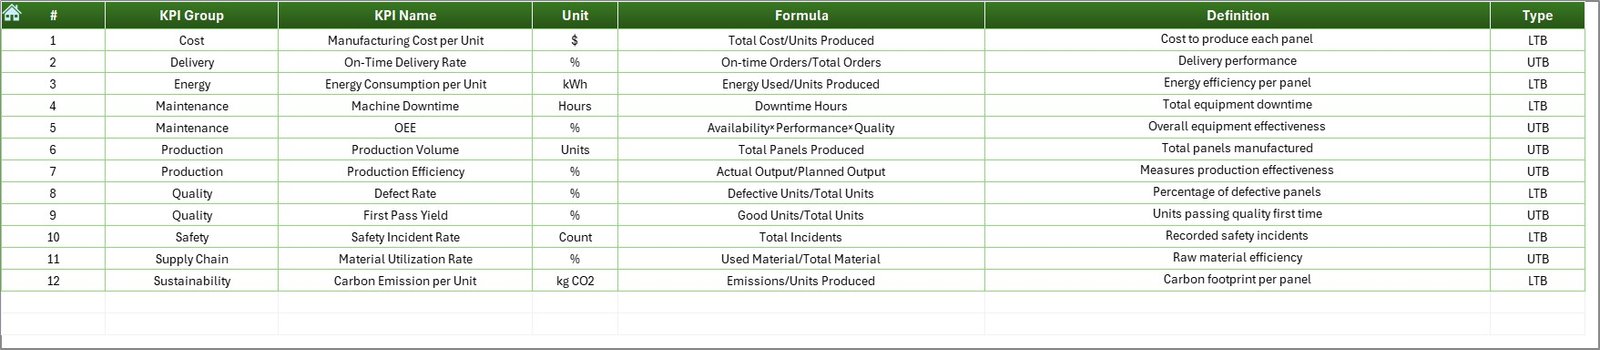
This sheet works as a KPI knowledge repository.
Users define:
-
KPI Name
-
KPI Group
-
Unit of Measurement
-
Formula
-
KPI Definition
Therefore, every stakeholder understands KPI calculations clearly.
Which KPIs Should Solar Panel Manufacturers Track?
A strong dashboard focuses on meaningful metrics.
Production KPIs
-
Production Output Volume
-
Line Efficiency %
-
Machine Utilization Rate
-
Cycle Time
-
Capacity Utilization
Quality KPIs
-
Defect Rate
-
Yield Percentage
-
Rework Rate
-
Inspection Pass Rate
Operational KPIs
-
Downtime Hours
-
Energy Consumption
-
Labor Productivity
-
Scrap Percentage
Financial KPIs
-
Cost per Panel
-
Manufacturing Cost Variance
-
Revenue per Unit
Tracking these KPIs ensures operational transparency.
Click to Purchases Solar Panel Manufacturing KPI Dashboard in Excel
How Does the Dashboard Improve Decision-Making?
A KPI dashboard transforms data into actionable insights.
Real-Time Visibility
Managers immediately identify performance gaps.
Faster Analysis
Instead of compiling reports, teams analyze trends instantly.
Data-Driven Decisions
Leadership bases decisions on measurable outcomes.
Improved Accountability
Teams clearly understand targets and results.
Therefore, organizations operate more efficiently.
Advantages of Solar Panel Manufacturing KPI Dashboard in Excel
Using this dashboard provides several operational benefits.
✅ Centralized Performance Monitoring
-
All KPIs appear in one location
-
Eliminates scattered reporting
✅ Easy Implementation
-
No expensive software required
-
Familiar Excel environment
✅ Automated Calculations
-
Reduces manual effort
-
Minimizes data errors
✅ Visual Performance Indicators
-
Conditional arrows highlight trends
-
Faster understanding of results
✅ Historical Comparison
-
Analyze previous year performance
-
Identify improvement areas
✅ Customization Flexibility
-
Add new KPIs easily
-
Modify formulas as needed
Because of these advantages, organizations improve productivity significantly.
Click to Purchases Solar Panel Manufacturing KPI Dashboard in Excel
How to Implement the Solar Panel Manufacturing KPI Dashboard?
Follow these simple steps for implementation.
Step 1: Define KPIs
Identify metrics aligned with production goals.
Step 2: Populate KPI Definitions
Enter KPI details in the Definition Sheet.
Step 3: Enter Targets
Add monthly and yearly targets.
Step 4: Input Actual Data
Update production numbers regularly.
Step 5: Add Previous Year Data
Include historical performance.
Step 6: Review Dashboard
Select the month and analyze results.
By following these steps, companies achieve smooth adoption.
Best Practices for the Solar Panel Manufacturing KPI Dashboard
To maximize dashboard effectiveness, follow these best practices.
Maintain Data Accuracy
-
Validate input numbers regularly
-
Avoid duplicate entries
Update Data Consistently
-
Enter data monthly
-
Maintain reporting discipline
Focus on Key KPIs
-
Avoid tracking unnecessary metrics
-
Prioritize business-critical indicators
Use Trend Analysis
-
Monitor long-term performance patterns
-
Identify recurring issues early
Train Team Members
-
Ensure users understand KPIs
-
Provide dashboard training sessions
Review Performance Frequently
-
Conduct monthly performance reviews
-
Take corrective actions quickly
Consistent usage ensures long-term success.
How Does Excel Compare to Other Dashboard Tools?
Many companies consider advanced BI tools. However, Excel offers unique advantages.
Common Mistakes to Avoid While Using KPI Dashboards
Even a powerful dashboard fails if used incorrectly.
Avoid these mistakes:
-
Tracking too many KPIs
-
Ignoring historical comparisons
-
Updating data irregularly
-
Using unclear KPI definitions
-
Overcomplicating visualizations
Instead, keep dashboards simple and focused.
Future of KPI Dashboards in Solar Manufacturing
As solar technology evolves, performance monitoring becomes more important.
Future dashboards may include:
-
IoT-based production data integration
-
Automated data imports
-
Predictive analytics
-
AI-driven forecasting
-
Real-time machine monitoring
Therefore, organizations that adopt dashboards today build a strong foundation for future analytics.
Who Can Benefit from This Dashboard?
This solution supports multiple roles:
-
Production Managers
-
Plant Supervisors
-
Quality Teams
-
Operations Leaders
-
Business Analysts
-
Manufacturing Executives
Because it simplifies analysis, every department benefits.
Conclusion
Solar panel manufacturing requires precision, efficiency, and continuous performance monitoring. Without structured KPI tracking, organizations struggle to identify operational gaps and improve productivity.
The Solar Panel Manufacturing KPI Dashboard in Excel provides a practical and powerful solution. It centralizes data, automates calculations, and delivers visual insights that support faster decision-making.
Moreover, its structured worksheets, automated comparisons, and trend analysis capabilities make performance management simple and effective.
Therefore, manufacturers can improve efficiency, enhance quality, and achieve production targets confidently using this Excel-based dashboard.
Click to Purchases Solar Panel Manufacturing KPI Dashboard in Excel
Frequently Asked Questions (FAQs)
1. What is a Solar Panel Manufacturing KPI Dashboard?
It is an Excel-based tool that tracks manufacturing performance using key performance indicators and visual analytics.
2. Can small manufacturers use this dashboard?
Yes. Small and mid-sized companies benefit greatly because Excel requires minimal investment.
3. How often should data be updated?
You should update data monthly or weekly depending on operational needs.
4. Do I need advanced Excel skills?
No. Basic Excel knowledge allows users to operate the dashboard easily.
5. Can I customize KPIs?
Yes. You can add, remove, or modify KPIs according to business requirements.
6. Why compare with previous year data?
Historical comparison helps measure growth and performance improvement.
7. Is Excel suitable for manufacturing analytics?
Yes. Excel provides flexibility, automation, and visualization suitable for many manufacturing environments.
Click to Purchases Solar Panel Manufacturing KPI Dashboard in Excel
Visit our YouTube channel to learn step-by-step video tutorials