Space research agencies operate in one of the most complex and high-stakes environments in the world. They manage satellite launches, deep space missions, research projects, technology development, and global collaborations. However, while missions reach for the stars, performance tracking often remains grounded in scattered spreadsheets.
Many agencies still compile reports manually. As a result, leadership spends hours consolidating data. Moreover, stakeholders demand transparency, accuracy, and measurable progress. At the same time, project managers need real-time insights to ensure mission success.
So, how can space research agencies monitor mission performance, budget utilization, research progress, and operational efficiency in one structured system?
The answer is clear.
You need a Space Research Agencies KPI Dashboard in Excel.
This ready-to-use Excel dashboard allows agencies to track KPIs using MTD (Month-to-Date) and YTD (Year-to-Date) metrics, compare targets against actual performance, analyze previous year trends, and measure progress in a professional format.
In this complete guide, you will learn:
-
What a Space Research Agencies KPI Dashboard in Excel is
-
Why agencies need structured KPI tracking
-
A detailed explanation of all 7 worksheets
-
Key KPIs space agencies can track
-
Advantages of the dashboard
-
Best practices for implementation
-
Frequently Asked Questions
Let’s explore everything step by step.
Click to Purchases Space Research Agencies KPI Dashboard in Excel
What Is a Space Research Agencies KPI Dashboard in Excel?
A Space Research Agencies KPI Dashboard in Excel is a structured performance tracking tool designed to monitor mission success, research output, satellite deployment, budget control, and operational efficiency.
Instead of reviewing separate reports, you can see everything in one centralized dashboard. Moreover, you can:
-
Compare Actual vs Target
-
Track MTD and YTD numbers
-
Analyze Previous Year performance
-
Identify performance gaps instantly
Therefore, decision-makers gain clarity. Furthermore, project teams improve accountability.
Click to Purchases Space Research Agencies KPI Dashboard in Excel
Why Do Space Research Agencies Need a KPI Dashboard?
Space missions require precision, planning, and coordination. However, without structured KPI tracking, agencies face reporting delays and visibility gaps.
Here’s why a KPI dashboard becomes essential:
-
Mission timelines demand strict monitoring
-
Budget utilization requires transparency
-
Research milestones need measurable tracking
-
Launch success rates must remain visible
-
Stakeholders expect performance insights
Moreover, when agencies use a structured dashboard:
-
They reduce manual reporting time
-
They improve cross-department alignment
-
They increase strategic visibility
-
They strengthen risk management
As a result, agencies move from reactive reporting to proactive mission control.
Complete Explanation of All 7 Worksheets
Now let’s break down how the Space Research Agencies KPI Dashboard in Excel works.
Click to Purchases Space Research Agencies KPI Dashboard in Excel
1️⃣ Home Sheet – Central Navigation Hub
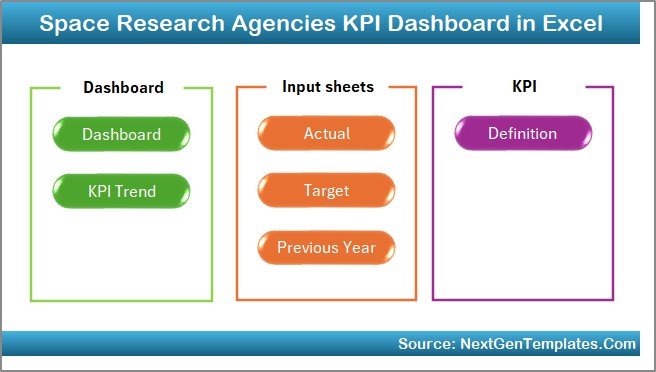
The Home sheet works as an index page.
Here, you get 6 interactive buttons that allow you to jump directly to:
-
Dashboard
-
KPI Trend
-
Actual Numbers Input
-
Target Sheet
-
Previous Year Sheet
-
KPI Definition
Because of this structured navigation, users access data quickly and efficiently.
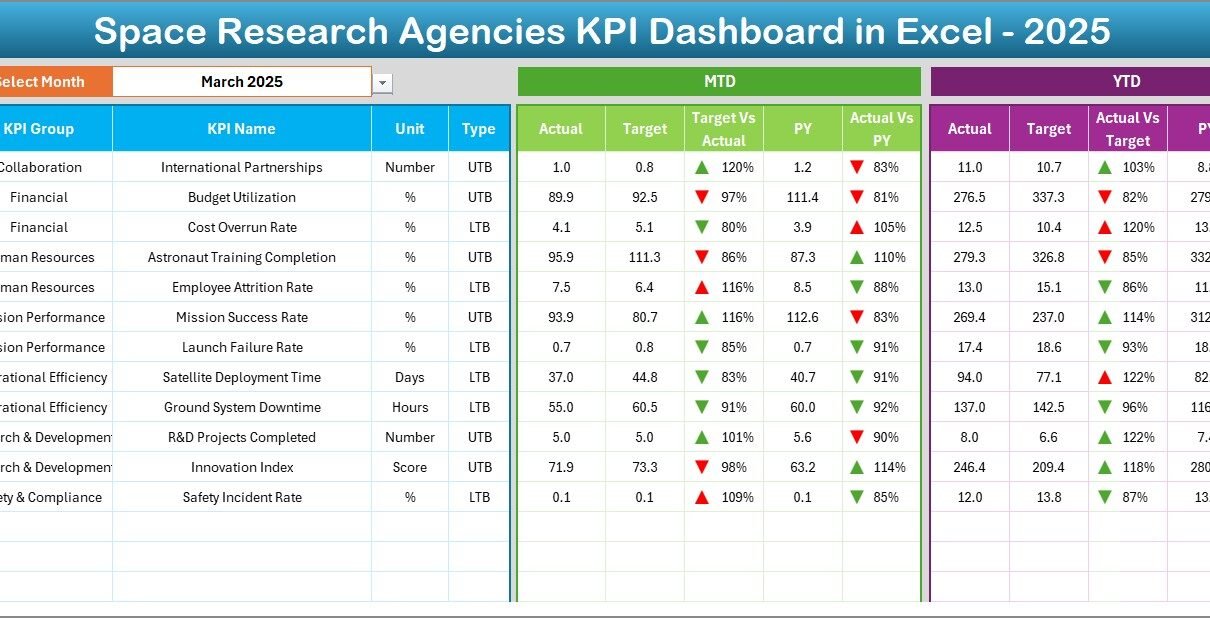
2️⃣ Dashboard Sheet – Main Performance Overview
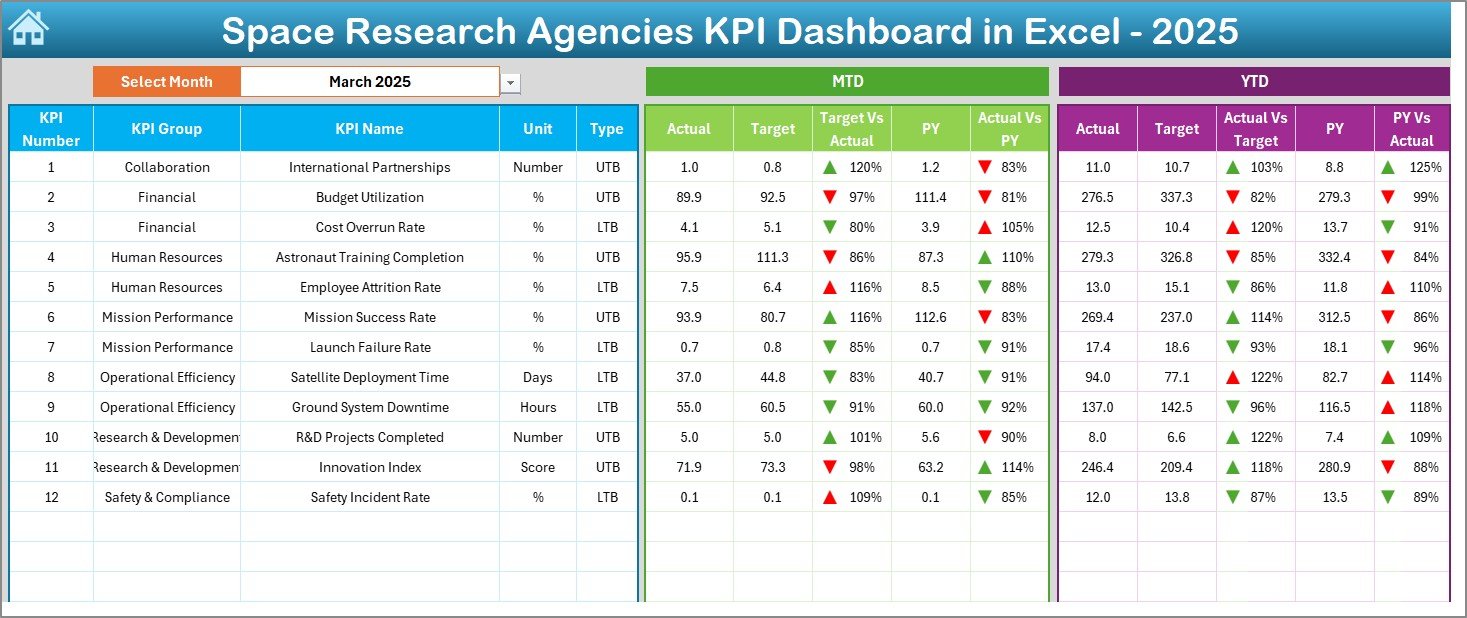
This sheet serves as the core performance monitoring page.
At cell D3, you can select the Month from a dropdown list. Once selected, the entire dashboard updates automatically.
What Does It Display?
For each KPI, you see:
MTD Section:
-
MTD Actual
-
MTD Target
-
MTD Previous Year
-
Target vs Actual comparison
-
PY vs Actual comparison
-
Conditional formatting arrows (▲ Green / ▼ Red)
YTD Section:
-
YTD Actual
-
YTD Target
-
YTD Previous Year
-
Target vs Actual comparison
-
PY vs Actual comparison
-
Conditional formatting arrows
Because of visual indicators, leaders instantly identify underperforming KPIs.
Click to Purchases Space Research Agencies KPI Dashboard in Excel
3️⃣ KPI Trend Sheet – Analyze Monthly and Yearly Trends
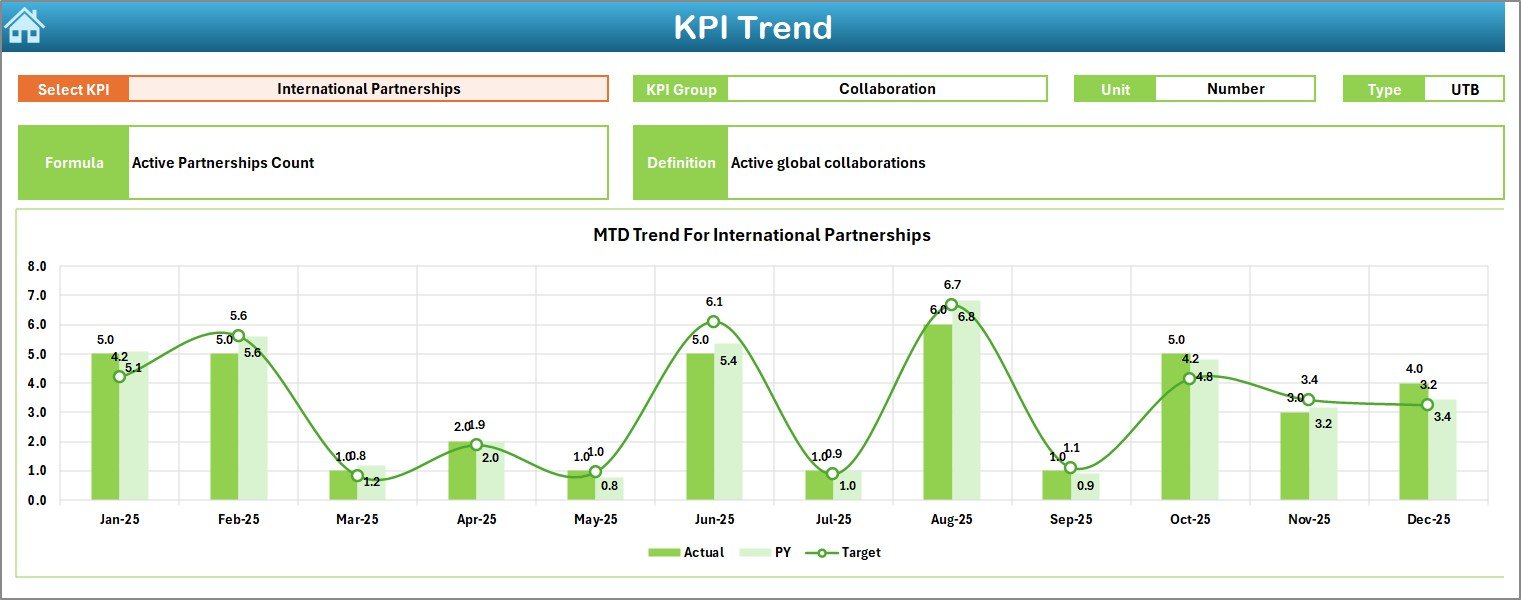
The KPI Trend sheet allows deeper performance analysis.
At cell C3, you can select the KPI name from a dropdown.
Once selected, the sheet displays:
-
KPI Group
-
Unit of Measurement
-
KPI Type (Lower the Better / Upper the Better)
-
Formula
-
KPI Definition
Additionally, you see:
-
MTD Trend Chart (Actual vs Target vs PY)
-
YTD Trend Chart (Actual vs Target vs PY)
Therefore, you do not just track performance — you understand trends.
For example:
-
Are satellite launches increasing compared to last year?
-
Does mission cost variance improve over time?
-
Are research publication numbers rising monthly?
Trend charts answer these questions clearly.
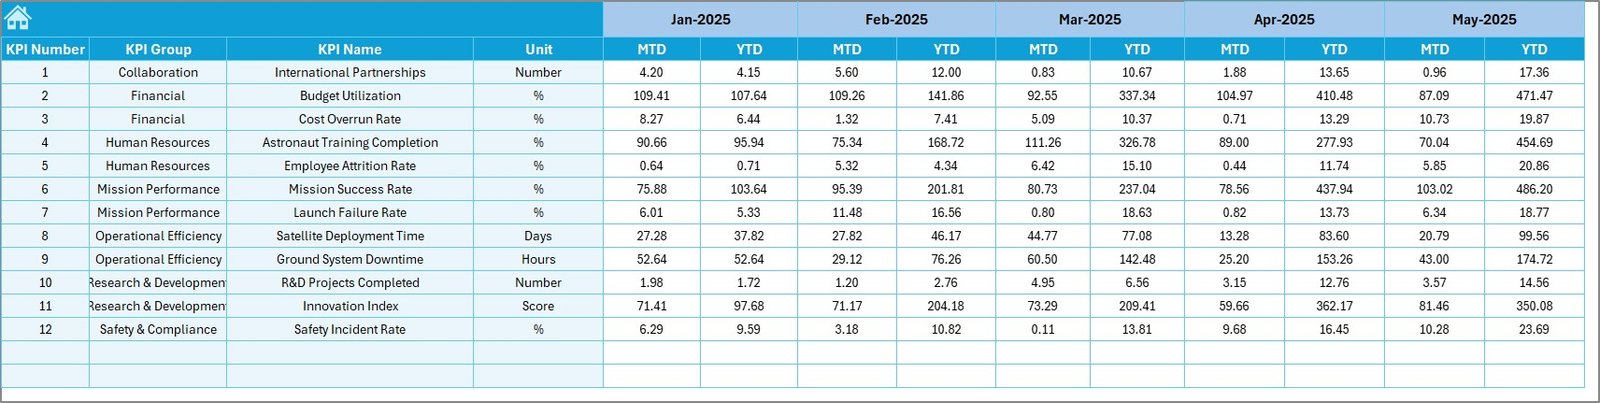
4️⃣ Actual Numbers Input Sheet – Enter Current Data
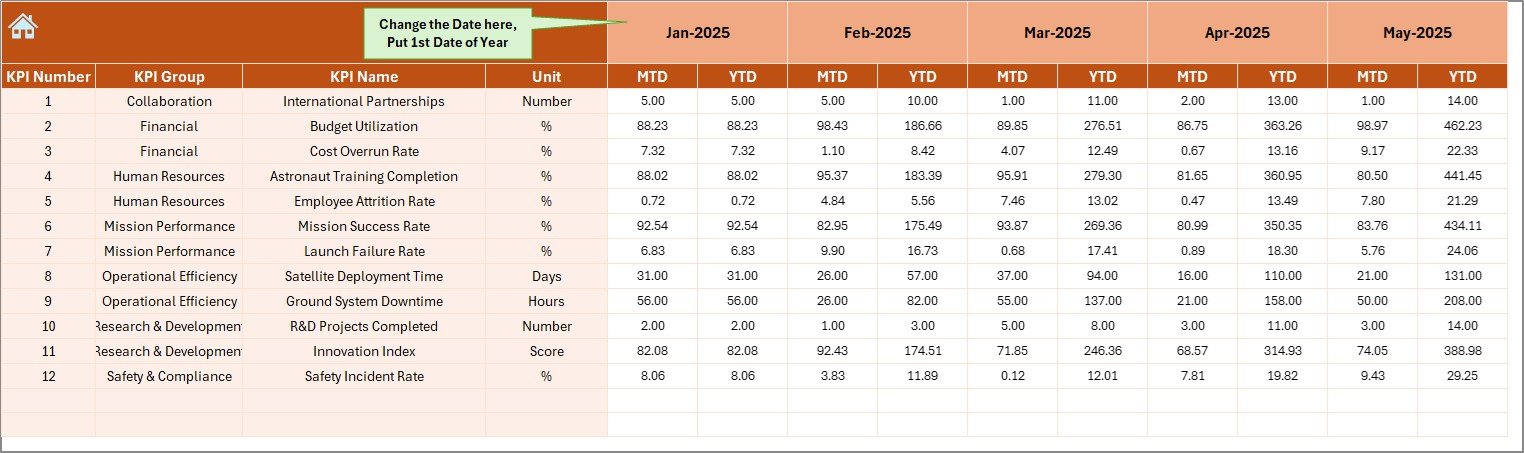
This sheet captures current year performance.
How It Works:
-
Enter the first month of the year in cell E1
-
Input MTD and YTD numbers for each KPI
-
Update data monthly
Because the dashboard connects directly to this sheet, updates reflect instantly.
5️⃣ Target Sheet – Set Performance Goals
Performance tracking requires clear targets.
In this sheet, you enter:
-
Monthly MTD targets
-
Monthly YTD targets
When you define targets clearly, you create accountability and direction.
Click to Purchases Space Research Agencies KPI Dashboard in Excel
6️⃣ Previous Year Number Sheet – Historical Benchmarking
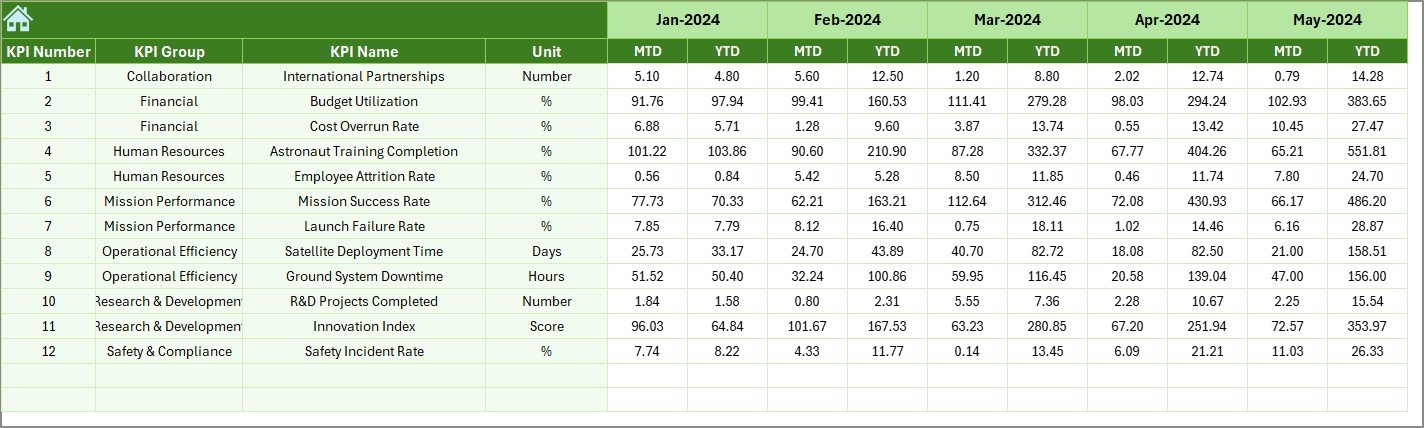
To measure growth, you must compare performance with historical data.
Here, you enter:
-
Previous year MTD numbers
-
Previous year YTD numbers
The dashboard then calculates:
-
Growth percentage
-
Performance improvement
-
Trend direction
Therefore, leadership sees measurable progress.
7️⃣ KPI Definition Sheet – Maintain KPI Clarity
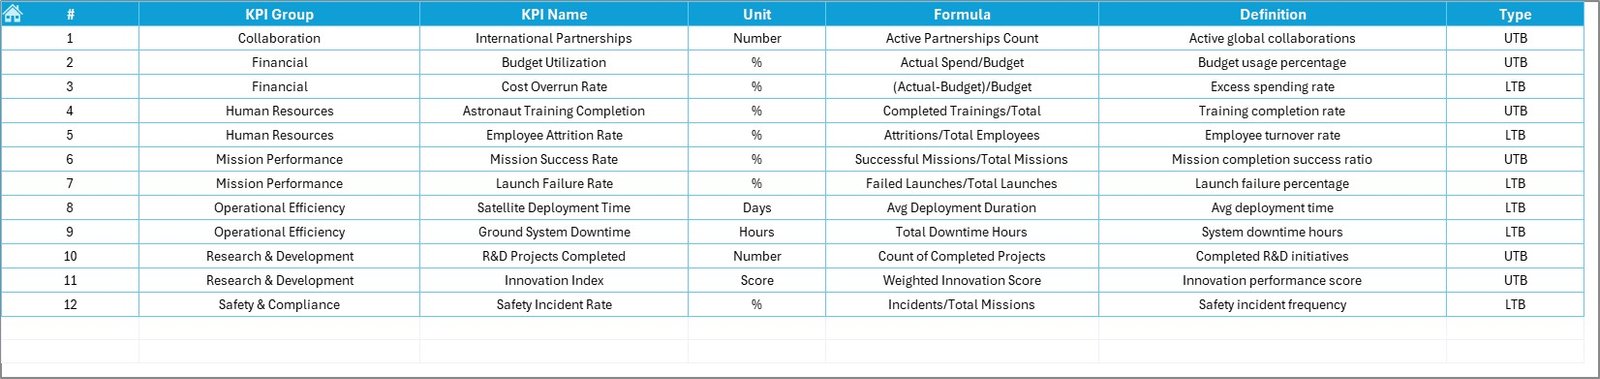
This sheet defines all KPIs clearly.
You enter:
-
KPI Name
-
KPI Group
-
Unit
-
Formula
-
KPI Definition
Because of this structure, all stakeholders understand KPI logic.
For example:
-
Mission Success Rate (%)
-
Satellite Deployment Count (Number)
-
Budget Utilization Rate (%)
-
Research Publication Output (Number)
Clear definitions prevent confusion and reporting errors.
What KPIs Can Space Research Agencies Track?
Click to Purchases Space Research Agencies KPI Dashboard in Excel
Every agency operates differently. However, most space research agencies track KPIs across these categories.
1️⃣ Mission Performance KPIs
-
Launch Success Rate
-
Satellite Deployment Count
-
Mission Completion Rate
-
On-Time Launch Percentage
2️⃣ Research and Development KPIs
-
Research Publications Count
-
Technology Development Milestones
-
Patent Filings
-
R&D Budget Utilization
3️⃣ Financial KPIs
-
Budget Variance
-
Cost per Mission
-
Project Cost Overrun Percentage
-
Funding Allocation Efficiency
4️⃣ Operational Efficiency KPIs
-
Equipment Downtime Rate
-
Testing Cycle Time
-
System Failure Rate
-
Resource Utilization Rate
By tracking these KPIs, agencies improve transparency and mission reliability.
Advantages of Space Research Agencies KPI Dashboard in Excel
Now let’s examine the key benefits.
1️⃣ Improves Mission Visibility
Leaders see performance status instantly.
2️⃣ Enhances Strategic Planning
Because you track trends, you adjust long-term mission strategies.
3️⃣ Strengthens Budget Control
Financial KPIs highlight cost overruns quickly.
4️⃣ Saves Reporting Time
Automated calculations reduce manual workload.
5️⃣ Increases Accountability
Clear targets align departments toward shared goals.
6️⃣ Enables Data-Driven Decisions
When leaders rely on numbers, decisions improve significantly.
Click to Purchases Space Research Agencies KPI Dashboard in Excel
Best Practices for the Space Research Agencies KPI Dashboard in Excel
Even though the dashboard offers structured tracking, you must follow best practices.
1️⃣ Select Meaningful KPIs
Focus on mission-critical metrics. Avoid unnecessary data overload.
2️⃣ Update Data Regularly
Monthly updates maintain dashboard accuracy.
3️⃣ Validate Data Accuracy
Cross-check input sheets before reporting.
4️⃣ Review Trends Quarterly
Trend analysis helps refine long-term space missions.
5️⃣ Train Teams on KPI Definitions
Ensure everyone understands formulas and KPI logic.
6️⃣ Present Dashboard in Executive Reviews
Visual summaries enhance board and stakeholder meetings.
How Does This Dashboard Improve Space Agency Performance?
When agencies implement structured KPI tracking:
-
They detect issues early
-
They improve mission execution
-
They control costs better
-
They align teams efficiently
-
They enhance stakeholder confidence
Moreover, they strengthen operational excellence.
Conclusion
Space research agencies operate in high-risk, high-investment environments. Therefore, performance tracking must remain precise and transparent.
The Space Research Agencies KPI Dashboard in Excel provides:
-
Centralized KPI monitoring
-
MTD and YTD comparisons
-
Previous year analysis
-
Visual trend tracking
-
Structured KPI definitions
As a result, agencies move toward smarter mission management and better decision-making.
If you want to elevate performance tracking and strengthen mission control, this dashboard becomes an essential tool.
Click to Purchases Space Research Agencies KPI Dashboard in Excel
Frequently Asked Questions (FAQs)
1️⃣ What is the purpose of a Space Research KPI Dashboard?
It helps agencies monitor mission performance, financial health, and operational efficiency.
2️⃣ Can this dashboard support large agencies?
Yes. Both national and private space agencies can use it effectively.
3️⃣ Do I need advanced Excel skills?
No. You only need basic data entry skills.
4️⃣ How often should agencies update the dashboard?
You should update it monthly for accurate performance tracking.
5️⃣ What does LTB and UTB mean?
LTB means Lower the Better. UTB means Upper the Better.
6️⃣ Why compare with previous year data?
Because historical comparison reveals growth patterns and performance improvement.
7️⃣ Can this dashboard support executive decision-making?
Yes. It provides structured insights that support strategic planning.
Click to Purchases Space Research Agencies KPI Dashboard in Excel
Visit our YouTube channel to learn step-by-step video tutorials