Running a specialty bookstore feels exciting and rewarding. You meet readers who love a specific genre, rare collection, or niche topic. However, you also deal with many daily tasks like managing orders, tracking profits, monitoring returns, and understanding customer preferences. When your data stays scattered in spreadsheets or manual logs, you struggle to take fast decisions. That is why a Specialty Bookstores Dashboard in Excel helps you stay organized, save time, and increase profits.
In this article, you will learn everything about the dashboard, including its structure, features, advantages, best practices, and common questions. You will also see how the dashboard helps you manage store performance, book categories, customer types, and monthly sales trends in a simple and visual format.
Click to Purchases Specialty Bookstores Dashboard in Excel
What Is a Specialty Bookstores Dashboard in Excel?
A Specialty Bookstores Dashboard in Excel is a ready-to-use reporting tool that tracks all important bookstore KPIs in one place. It helps independent bookstore owners, niche book sellers, and managers view sales, profit, customer satisfaction, and order trends without wasting time on manual reporting.
The dashboard also works with any type of specialty bookstore, such as:
-
Comic bookstores
-
Rare and vintage bookshops
-
Academic or research bookstores
-
Children’s bookstores
-
Religious bookstores
-
Art and design bookstores
-
Travel or adventure bookstores
-
Author-specific or genre-specific bookstores
Since the dashboard uses Excel, you get full flexibility. You can update the data easily, apply slicers, switch between pages, and analyze performance in minutes.
Click to Purchases Specialty Bookstores Dashboard in Excel
Why Do Specialty Bookstores Need a Dashboard?
Specialty bookstores handle many tasks at once. You manage different book categories, customer types, payment modes, order volumes, and stock movement. When you do all this manually, it creates delays and mistakes. Therefore, you need a system that shows all important metrics together in a visual layout.
A dashboard solves this problem because it:
-
Saves time
-
Reduces manual calculations
-
Gives real-time insights
-
Shows trends clearly
-
Helps you make better decisions
-
Improves customer experience
With a dashboard, you spend less time searching for data and more time growing your bookstore.
Click to Purchases Specialty Bookstores Dashboard in Excel
Key Features of the Specialty Bookstores Dashboard in Excel
We designed the Specialty Bookstores Dashboard in Excel as a ready-to-use template. You only enter your data, and the dashboard updates automatically through formulas and pivot charts. To make navigation easier, we included a Page Navigator on the left side. It helps you move across analytical pages with one click.
The dashboard includes five main pages:
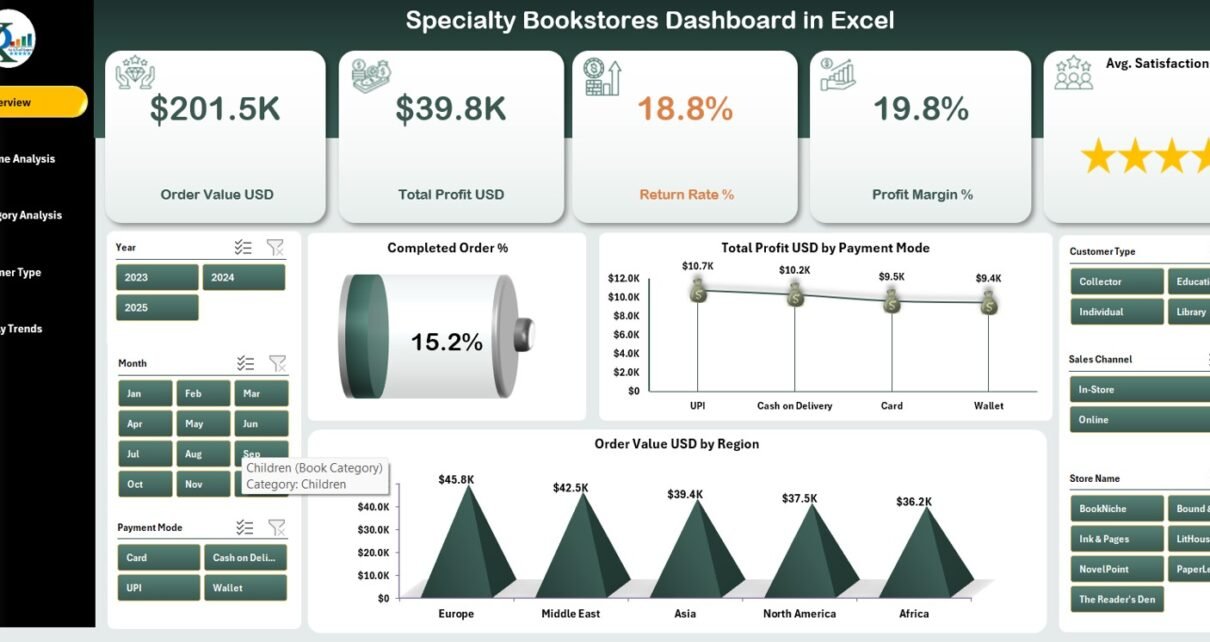
1. Overview Page
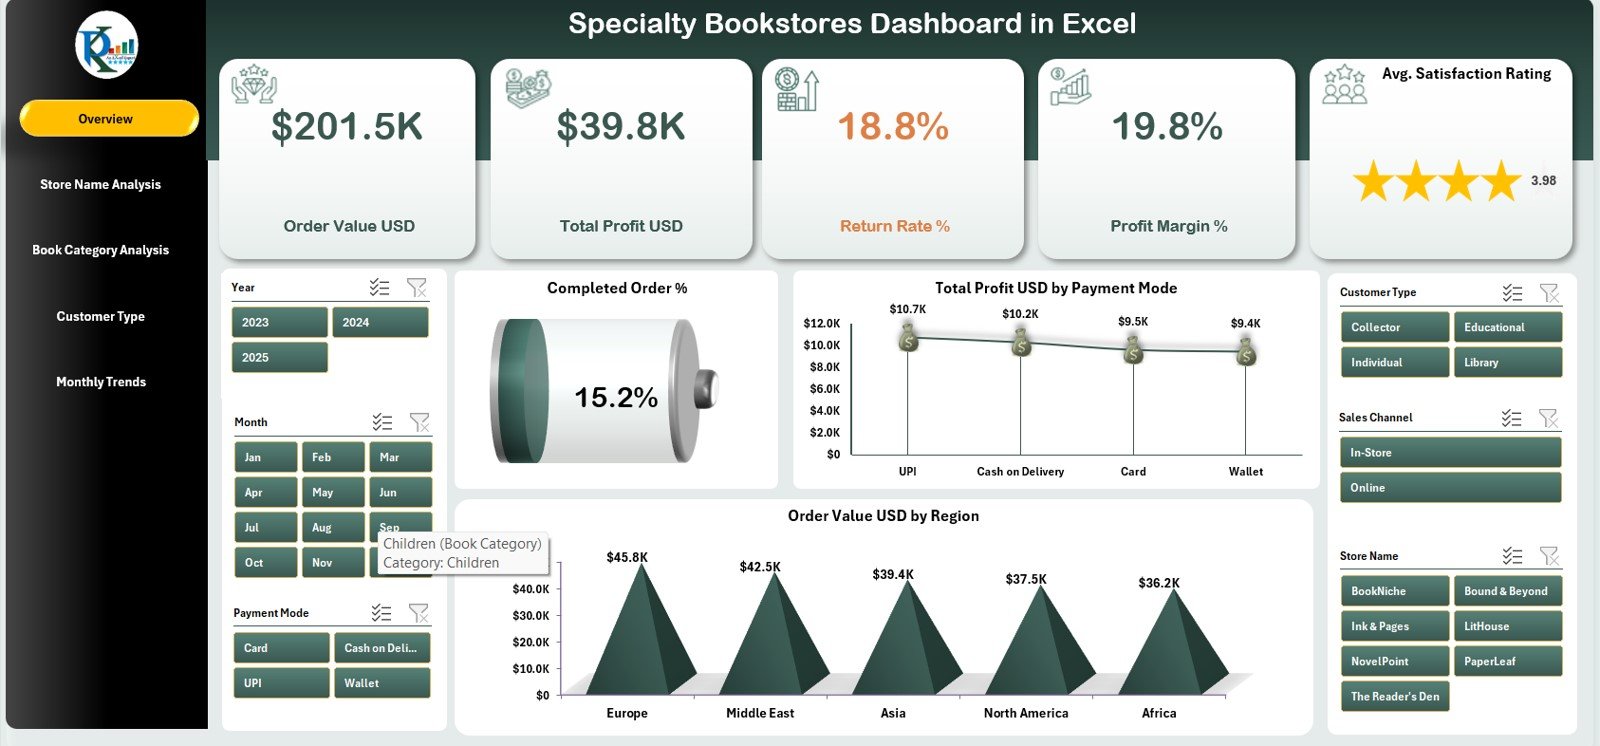
The Overview Page gives you a complete snapshot of the bookstore’s performance. It contains:
✔ Page Navigator
You use the left-side navigator to move through all analytical pages smoothly.
✔ KPI Cards
You see 5 important cards showing high-level performance metrics. These KPIs help you understand your bookstore’s current status at a glance.
✔ Charts
The Overview Page includes the following three charts:
-
Completed Order %
Shows how many orders get completed compared to total orders. -
Total Profit (USD) by Payment Mode
Helps you see which payment method brings the most profit. -
Order Value (USD) by Region
Shows which regions or locations generate the most revenue.
These visuals help bookstore owners understand trends quickly so they can plan better.
Click to Purchases Specialty Bookstores Dashboard in Excel
2. Store Name Analysis

If you manage multiple specialty bookstores, franchise stores, or branches, this page gives you complete clarity. You can check how each store performs and where improvements are needed.
Charts included in this page:
-
Order Value (USD) by Store Name
-
Total Profit (USD) by Store Name
-
Average Satisfaction Rating by Store Name
-
Profit Margin % by Store Name
-
Genre Popularity Score by Store Name
These charts help you compare sales, profit, and customer sentiment across all stores. You can identify top-performing stores and support the ones that need improvement.
3. Book Category Analysis

Specialty bookstores often sell unique book categories. Some categories may sell faster, while others may require discounts or special promotions. This page helps you understand category-wise performance.
Charts on this page:
-
Order Value (USD) by Book Category
-
Total Profit (USD) by Book Category
-
Total Orders by Book Category
-
Returned Order % by Book Category
-
Profit Margin % by Book Category
This section helps you track which genres or categories are popular and how they influence profit and returns.
Click to Purchases Specialty Bookstores Dashboard in Excel
4. Customer Type Analysis

Different customer types behave differently. For example, students may buy more academic books, while hobby readers may prefer fiction or comics. You can analyze this on the Customer Type Analysis page.
Charts included:
-
Total Profit (USD) by Customer Type
-
Order Value (USD) by Customer Type
-
Average Satisfaction Rating by Customer Type
-
Return Rate % by Customer Type
-
Profit Margin % by Customer Type
This helps you discover:
-
Which customer group buys the most
-
Which group gives high satisfaction ratings
-
Which group returns the most orders
-
Which segment is most profitable
5. Monthly Trends
Monthly Trends
Every bookstore faces seasonal ups and downs. Certain months bring high sales, while others remain slow. The Monthly Trends page helps you identify these patterns.
Charts included:
-
Order Value (USD) by Month
-
Total Profit (USD) by Month
-
Average Satisfaction Rating by Month
-
Profit Margin % by Month
-
Completed Orders by Month
These visuals help bookstore owners plan discounts, promotions, author events, and new inventory at the right time.
Click to Purchases Specialty Bookstores Dashboard in Excel
Support Sheet
The Support Sheet includes all formulas, lookup tables, and key logic needed for the dashboard to run smoothly. You do not need to edit this sheet unless you are customizing the logic.
Data Sheet
The Data Sheet stores your raw data such as:
-
Order date
-
Store name
-
Book category
-
Customer type
-
Payment mode
-
Order value
-
Profit
-
Satisfaction rating
-
Return status
You simply update this sheet, and the dashboard refreshes automatically.
Why Should You Use a Specialty Bookstores Dashboard in Excel?
You may wonder: “Do I really need a dashboard?”
The answer is simple — yes, because the dashboard helps you grow your bookstore faster with data-driven strategies.
Here are the biggest reasons:
✔ You get instant insights
Instead of checking many spreadsheets, you see everything in one place.
✔ You save time
You avoid manual calculations because the dashboard does the work for you.
✔ You make better decisions
You know which store, category, or customer type performs the best.
✔ You improve customer satisfaction
You identify patterns that motivate customers to return.
✔ You increase profit
By analyzing payment mode, order value, and return rate, you plan smarter offers.
Click to Purchases Specialty Bookstores Dashboard in Excel
Advantages of the Specialty Bookstores Dashboard in Excel
Below are the key advantages of using this dashboard:
1. Easy to Use
You only update your data, and the dashboard refreshes automatically.
2. Full Customization
You can change colors, add KPIs, or adjust slicers based on your needs.
3. Complete Visibility
You track store performance, category insights, customer behavior, and monthly trends.
4. Better Inventory Planning
You check which categories are trending and stock them accordingly.
5. Informed Marketing Decisions
You know which store or customer segment needs promotions.
6. Higher Profitability
You analyze profit margin and return rate so you can set smart pricing.
7. Supports Multiple Branches
You track multiple bookstores in one place.
8. Helps You Improve Customer Experience
Customer satisfaction rating visuals give you insights to improve your service.
Click to Purchases Specialty Bookstores Dashboard in Excel
Best Practices for Using the Specialty Bookstores Dashboard in Excel
To get the most value from your dashboard, follow these best practices:
1. Update Data Regularly
Add new orders, returns, and ratings every week or month.
2. Use Filters Wisely
Slicers help you explore deeper insights based on store, region, category, or customer type.
3. Check Trends Frequently
Look at monthly trends to plan promotions and restocking.
4. Analyze Return Patterns
Identify categories or customer types with high return rates.
5. Monitor Customer Satisfaction
Track ratings and fix areas where customers feel unhappy.
6. Compare Stores
Use the Store Name Analysis page to see which stores need support.
7. Track Profit Margin Closely
Small increases in margin improve overall profitability.
8. Customize the Dashboard
Add new KPIs such as conversion rate, bestseller category, shipping cost, or inventory turnover.
Conclusion
A Specialty Bookstores Dashboard in Excel helps bookstore owners, managers, and teams make smarter decisions. It brings all data together in one visual dashboard so you understand customer behavior, category performance, store trends, and profit margins. Since the dashboard comes ready to use, you start analyzing your bookstore instantly without complex setup.
Whether you run one bookstore or multiple branches, this dashboard helps you track performance, boost customer satisfaction, and grow your business with confidence.
Frequently Asked Questions (FAQs)
1. Who can use the Specialty Bookstores Dashboard in Excel?
Bookstore owners, managers, franchise store operators, and anyone handling specialty book sales can use this dashboard.
2. Do I need advanced Excel skills to use the dashboard?
No. You only enter your data in the Data Sheet, and the dashboard updates automatically.
3. Can I customize the charts and colors?
Yes, you can change chart type, color theme, KPIs, and page layout based on your needs.
4. Can I track multiple bookstores using this dashboard?
Yes, the Store Name Analysis page lets you compare performance across branches.
5. Does the dashboard show monthly trends?
Yes, it includes trend charts for order value, profit, satisfaction rating, and completed orders.
6. Can I add new KPIs to the dashboard?
Absolutely. You can add new columns in the Data Sheet and modify pivot charts.
7. How often should I update the data?
You should update the data weekly or monthly for best results.
8. Does this dashboard track returns and profitability?
Yes, the Book Category and Customer Type pages track return rate and profit margin.
Click to Purchases Specialty Bookstores Dashboard in Excel
Visit our YouTube channel to learn step-by-step video tutorials