The sporting goods industry moves fast. Sales change by season. Demand rises during tournaments. Inventory levels shift every month. Therefore, managers must track performance daily. However, many companies still depend on Excel sheets and manual reports. As a result, they miss trends. They fail to compare targets properly. They struggle to monitor growth clearly.
So, how can you monitor sales performance, inventory turnover, profit margin, and target achievement in one structured system?
The answer is simple.
You need a Sporting Goods KPI Dashboard in Power BI.
With this dashboard, you can monitor Month-to-Date (MTD) and Year-to-Date (YTD) performance instantly. Moreover, you can compare current performance with targets and previous year data. Consequently, you make faster and smarter business decisions.
Click to buy Sporting Goods KPI Dashboard in Power BI
What Is a Sporting Goods KPI Dashboard in Power BI?
A Sporting Goods KPI Dashboard in Power BI is a ready-to-use business intelligence solution. It helps sporting goods retailers, distributors, and manufacturers track key performance indicators in one interactive report.
Unlike static reports, this dashboard allows you to:
- Filter by Month
- Filter by KPI Group
- Analyze MTD and YTD values
- Compare Target vs Actual
- Compare Current Year vs Previous Year
- Drill through to detailed KPI definitions
Therefore, instead of checking multiple files, you monitor everything in one place.
What Problems Does This Dashboard Solve?
Many sporting goods businesses face common challenges:
- They cannot track monthly target achievement.
- They fail to measure sales growth compared to last year.
- They struggle to identify underperforming KPIs.
- They waste time preparing manual reports.
However, this dashboard solves these problems because:
- It automatically calculates performance ratios.
- It shows visual indicators (▲ and ▼).
- It separates MTD and YTD analysis clearly.
- It allows drill-through for KPI explanation.
As a result, you gain clarity and control.
Dashboard Structure – 3 Powerful Pages
This Sporting Goods KPI Dashboard in Power BI includes 3 structured pages:
- Summary Page
- KPI Trend Page
- KPI Definition Page
Let us explore each page step by step.
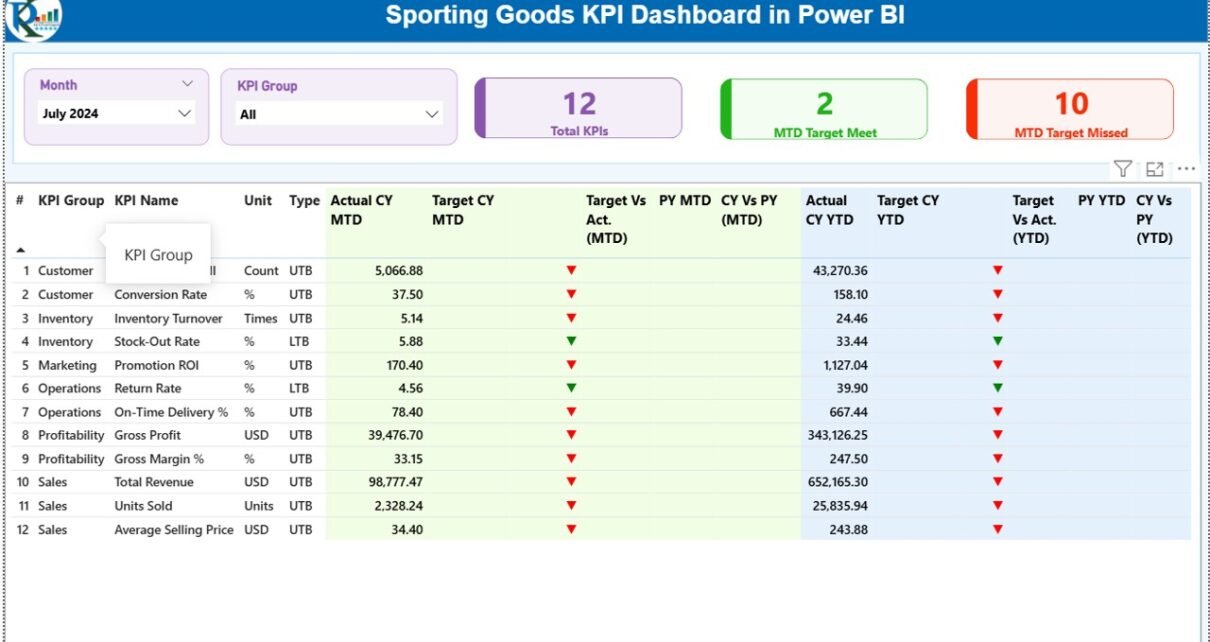
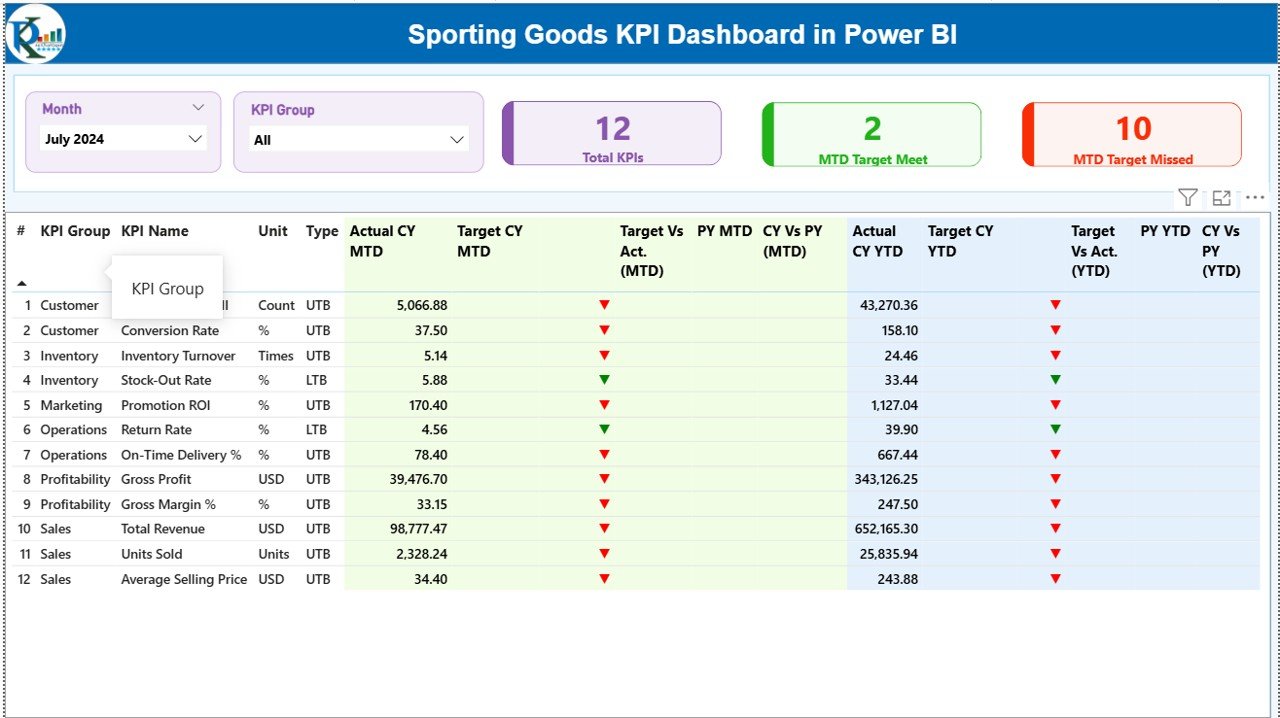
Summary Page – The Heart of the Dashboard
The Summary Page acts as the main control center. Here, you can analyze all KPIs in one structured table.
Top Section – Interactive Slicers
At the top, you get:
- Month Slicer
- KPI Group Slicer
Therefore, you can filter the report instantly. When you select a month, all numbers update automatically.
KPI Performance Cards
This section displays 3 powerful KPI cards:
- Total KPIs Count
- MTD Target Meet Count
- MTD Target Missed Count
These cards give you an instant performance summary. So, within seconds, you know whether your business meets targets or not.
Detailed KPI Table – Complete Visibility
Below the cards, you see a structured table containing:
- KPI Number
- KPI Group
- KPI Name
- Unit
- Type (LTB or UTB)
- Actual CY MTD
- Target CY MTD
- MTD Icon (▲ / ▼ with colors)
- Target Vs Actual (MTD %)
- PY MTD
- CY Vs PY (MTD %)
- Actual CY YTD
- Target CY YTD
- YTD Icon
- Target Vs Actual (YTD %)
- PY YTD
- CY Vs PY (YTD %)
How Does the Dashboard Calculate KPI Status?
Target vs Actual (MTD)
Formula:
Actual MTD / Target MTD
If the value exceeds 100% for UTB KPIs, the dashboard shows a green ▲.
If performance falls below target, it shows a red ▼.
However, for LTB KPIs, the logic reverses. Lower values perform better.
Current Year vs Previous Year (MTD)
Formula:
Current Year MTD / Previous Year MTD
Therefore, you can immediately measure growth.
The same logic applies to YTD comparisons.
Click to buy Sporting Goods KPI Dashboard in Power BI
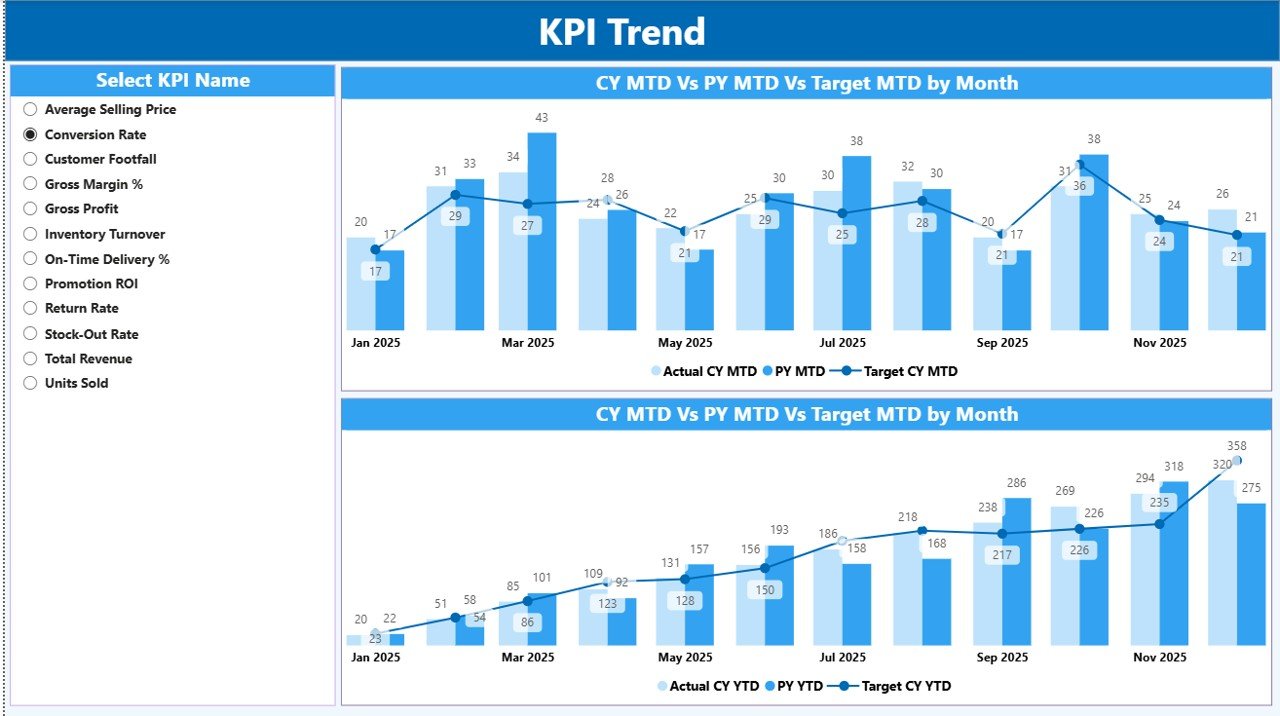
KPI Trend Page – Visual Performance Analysis
The KPI Trend Page helps you analyze trends visually.
What Does This Page Include?
- 2 Combo Charts:
MTD Trend
YTD Trend
Each combo chart displays:
- Current Year Actual
- Previous Year Actual
- Target Values
Moreover, you can select the KPI name using a slicer. As a result, you analyze one KPI at a time.
Why Are Combo Charts Important?
Combo charts show:
- Line for Target
- Column for Actual
- Comparison with Previous Year
Therefore, you clearly identify:
- Seasonal performance patterns
- Sudden performance drops
- Target achievement gaps
Instead of reading numbers, you see trends instantly.
Click to buy Sporting Goods KPI Dashboard in Power BI
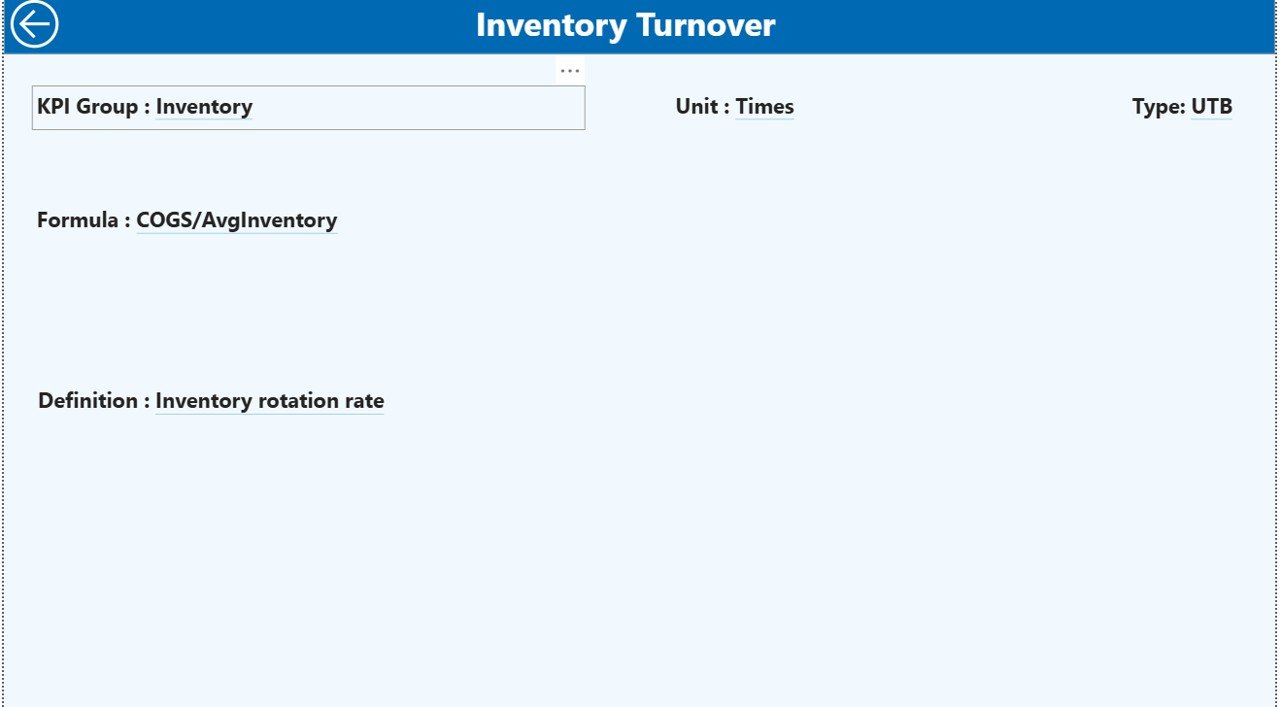
KPI Definition Page – Drill Through for Clarity
The KPI Definition Page remains hidden. However, you can access it using drill-through from the Summary page.
This page shows:
- KPI Number
- KPI Group
- KPI Name
- Unit
- Formula
- Definition
- Type (LTB or UTB)
Therefore, managers understand exactly how each KPI works.
Additionally, you can return to the Summary Page by clicking the back button.
Click to buy Sporting Goods KPI Dashboard in Power BI
Data Source – Excel Integration
This dashboard connects to an Excel file. Therefore, you do not need a complex database.
You only need to maintain 3 sheets:
Input_Actual Sheet
Fill the following fields:
- KPI Name
- Month (First date of month)
- MTD Value
- YTD Value
That is all.
Input_Target Sheet
Fill:
- KPI Name
- Month
- Target MTD
- Target YTD
The dashboard automatically calculates performance ratios.
KPI Definition Sheet
Fill:
- KPI Number
- KPI Group
- KPI Name
- Unit
- Formula
- Definition
- Type (LTB or UTB)
Therefore, you maintain full transparency.
Key KPIs for Sporting Goods Business
Here are some important KPIs you can track:
Sales KPIs
- Net Sales
- Gross Sales
- Sales Growth %
- Average Order Value
Inventory KPIs
- Inventory Turnover
- Stock Availability %
- Dead Stock %
Profitability KPIs
- Gross Margin %
- Operating Margin %
- Discount %
Operational KPIs
- Order Fulfillment Rate
- Return Rate %
- On-Time Delivery %
By tracking these KPIs, you gain complete business control.
Advantages of Sporting Goods KPI Dashboard in Power BI
Real-Time Monitoring
You track MTD and YTD performance instantly.
Better Target Control
You clearly see which KPIs meet targets.
Easy Comparison
You compare Current Year vs Previous Year easily.
Interactive Filtering
You filter by month or KPI group instantly.
Visual Decision Making
Icons and combo charts make performance clear.
Centralized Data
You store all data in one Excel file.
Drill-Through Transparency
You understand formulas and KPI definitions clearly.
Therefore, this dashboard improves clarity and control.
Best Practices for the Sporting Goods KPI Dashboard in Power BI
- 1. Define Clear KPIs
- Choose KPIs that directly impact revenue and profit.
- 2. Update Data Monthly
- Update actual and target sheets regularly.
- 3. Separate LTB and UTB KPIs Clearly
- Define KPI type properly to avoid wrong indicators.
- 4. Validate Data Before Upload
- Check for missing values before refreshing Power BI.
- 5. Review Performance Weekly
- Although you track monthly data, review progress weekly.
- 6. Use Consistent Units
Always maintain consistent measurement units.
7. Train Managers
Ensure team members understand KPI formulas.
Who Can Use This Dashboard?
- Sporting goods retailers
- Wholesale distributors
- Online sports stores
- Sports equipment manufacturers
- Regional sales managers
- Business owners
If you sell sports products, this dashboard helps you.
Why Choose Power BI for KPI Tracking?
Power BI offers:
- Interactive dashboards
- Fast data refresh
- Advanced calculations
- Drill-through analysis
- Clean visual reports
Therefore, it provides better insights than static spreadsheets.
How Does This Dashboard Improve Business Growth?
Because you measure performance accurately, you:
- Reduce losses
- Improve margins
- Control discounts
- Optimize inventory
- Increase sales growth
Moreover, you identify weak KPIs quickly. As a result, you take corrective action faster.
Conclusion
The sporting goods industry requires fast decisions and accurate tracking. However, manual reports create delays and confusion. Therefore, businesses need a structured system.
The Sporting Goods KPI Dashboard in Power BI provides exactly that.
It allows:
- Clear MTD and YTD comparison
- Target vs Actual analysis
- Current Year vs Previous Year comparison
- Visual KPI indicators
- Drill-through definitions
- Easy Excel integration
As a result, managers gain full visibility and control.
If you want to improve performance, increase profit, and track KPIs smartly, this dashboard offers the perfect solution.
Frequently Asked Questions (FAQs)
What is the main purpose of this dashboard?
It helps sporting goods businesses track KPI performance using MTD and YTD metrics.
Do I need advanced Power BI skills?
No. You only need to update Excel sheets. The dashboard calculates everything automatically.
What does LTB and UTB mean?
LTB means Lower the Better.
UTB means Upper the Better.
Can I customize KPIs?
Yes. You can modify KPI definitions and formulas in the Excel file.
How often should I update data?
You should update data monthly. However, you can update it more frequently if needed.
Can I add more KPI groups?
Yes. You can expand the KPI definition sheet and refresh Power BI.
Is this dashboard suitable for small businesses?
Yes. Small and medium sporting goods businesses can use it easily.
Can I compare performance with last year?
Yes. The dashboard includes Current Year vs Previous Year comparison for both MTD and YTD.
Visit our YouTube channel to learn step-by-step video tutorials
Watch the step-by-step video tutorial:
Click to buy Sporting Goods KPI Dashboard in Power BI