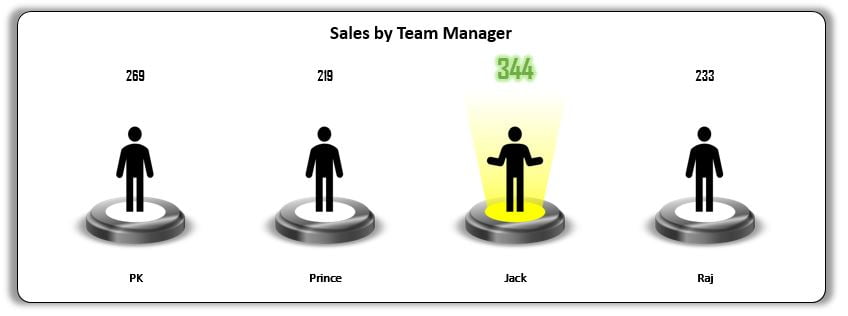
n the evolving landscape of workplace management, one factor consistently proves critical to long-term organizational success: employee satisfaction. When combined
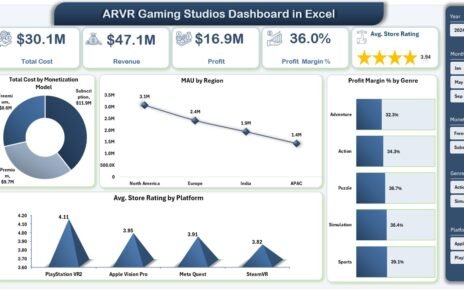
The AR and VR gaming industry is evolving faster than ever. New studios launch immersive experiences regularly, platforms expand, and
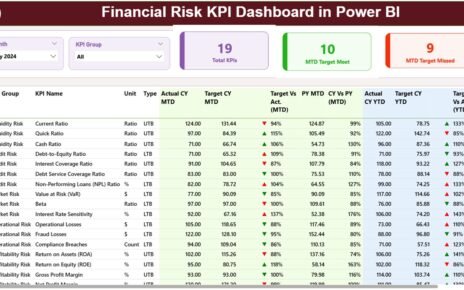
Financial risk plays a critical role in every organization, regardless of size or industry. Companies face risks related to liquidity,