In today’s fast-moving financial markets, stock exchanges generate massive volumes of data every single day. However, numbers alone do not create clarity. To stay competitive, exchanges, regulators, analysts, and leadership teams need structured insights, real-time tracking, and performance-driven decision-making. This is exactly where a Stock Exchanges KPI Dashboard in Power BI becomes a powerful game-changing solution.
This comprehensive article explains what a Stock Exchanges KPI Dashboard in Power BI is, how it works, why it matters, its core features, advantages, opportunities for improvement, and best practices. Moreover, it also answers the most common questions at the end to help you implement it with confidence.
Click to buy Stock Exchanges KPI Dashboard in Power BI
What Is a Stock Exchanges KPI Dashboard in Power BI?
A Stock Exchanges KPI Dashboard in Power BI is a ready-to-use analytical dashboard designed to track, monitor, and evaluate key performance indicators related to stock exchange operations.
Instead of using scattered Excel sheets, static reports, and manual reviews, this dashboard brings all KPIs into one centralized Power BI file, supported by Excel as a structured data source. As a result, decision-makers gain clear visual insights, instant comparisons, and real-time performance status.
Because Power BI connects seamlessly with Excel, data updates remain simple. You only enter monthly actuals and targets in Excel, refresh Power BI, and instantly view updated insights.
Why Do Stock Exchanges Need a KPI Dashboard?
Stock exchanges operate in an environment where accuracy, transparency, speed, and compliance matter the most. Therefore, tracking performance without a structured KPI system often leads to blind spots.
A Stock Exchanges KPI Dashboard in Power BI helps organizations:
- Monitor exchange performance across months and years
- Compare Actual vs Target vs Previous Year results
- Identify underperforming KPIs early
- Improve operational efficiency and governance
- Support data-driven strategic decisions
As a result, leadership teams stay proactive rather than reactive.
How Does the Stock Exchanges KPI Dashboard in Power BI Work?
The dashboard uses Excel as the data source and Power BI for visualization and analytics. This combination keeps the process simple yet powerful.
Data Flow Overview
- Users enter data in Excel sheets
- Power BI connects to the Excel file
- Pre-built measures calculate MTD and YTD metrics
- Visuals refresh automatically
- Users analyze insights through slicers and drill-through pages
Consequently, even non-technical users can manage and analyze data effectively.
What Are the Key Pages in the Stock Exchanges KPI Dashboard?
The Stock Exchanges KPI Dashboard in Power BI includes three structured and purpose-driven pages, each designed to answer specific business questions.
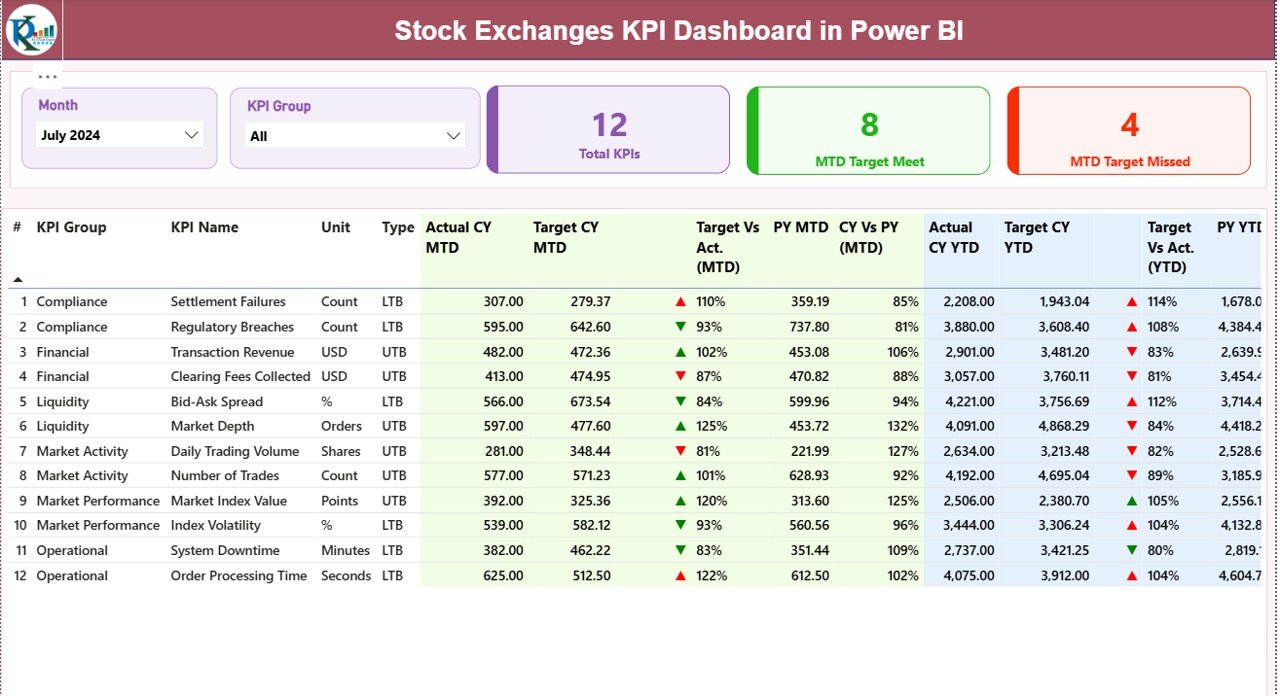
Summary Page – How Is Overall Performance Looking?
The Summary Page acts as the main control center of the dashboard.
Key Elements on the Summary Page
- Month Slicer – Analyze performance for any month instantly
- KPI Group Slicer – Filter KPIs by category
KPI Cards for Quick Insights
- Total KPIs Count
- MTD Target Met Count
- MTD Target Missed Count
These cards provide an instant snapshot of performance health.
Detailed KPI Table Explained
The KPI table provides deep, row-level insights for each KPI:
- KPI Number – Sequential identifier for each KPI
- KPI Group – Category or department classification
- KPI Name – Name of the metric
- Unit – Measurement unit (%, USD, Count, etc.)
- Type – UTB (Upper the Better) or LTB (Lower the Better)
MTD Performance Metrics
- Actual CY MTD – Current Year actual MTD value
- Target CY MTD – Target value for the same period
- MTD Icon – Green ▲ or Red ▼ for quick status indication
- Target vs Actual (MTD) – Performance percentage
- PY MTD – Previous Year MTD value
- CY vs PY (MTD) – Growth or decline comparison
YTD Performance Metrics
- Actual CY YTD – Current Year YTD actual
- Target CY YTD – Current Year YTD target
- YTD Icon – Visual status indicator
- Target vs Actual (YTD) – Achievement percentage
- PY YTD – Previous Year YTD value
- CY vs PY (YTD) – Year-on-year comparison
Together, these metrics provide full-period performance clarity.
Click to buy Stock Exchanges KPI Dashboard in Power BI
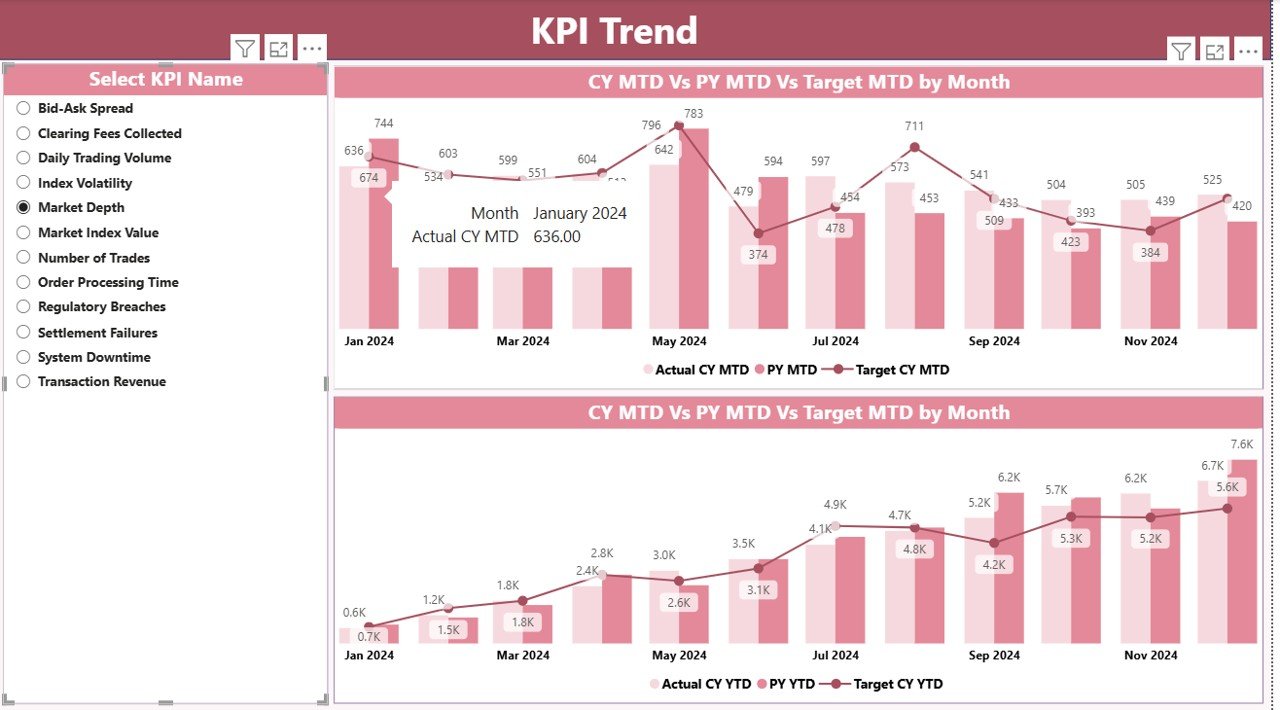
KPI Trend Page – How Is Each KPI Performing Over Time?
The KPI Trend Page focuses on performance trends rather than snapshots.
Key Features of the KPI Trend Page
- KPI Name Slicer on the left
- Two Combo Charts:
- MTD Actual vs Target vs Previous Year
- YTD Actual vs Target vs Previous Year
- Because of this structure, users can instantly detect improvement patterns, seasonality, or performance drops.
Click to buy Stock Exchanges KPI Dashboard in Power BI
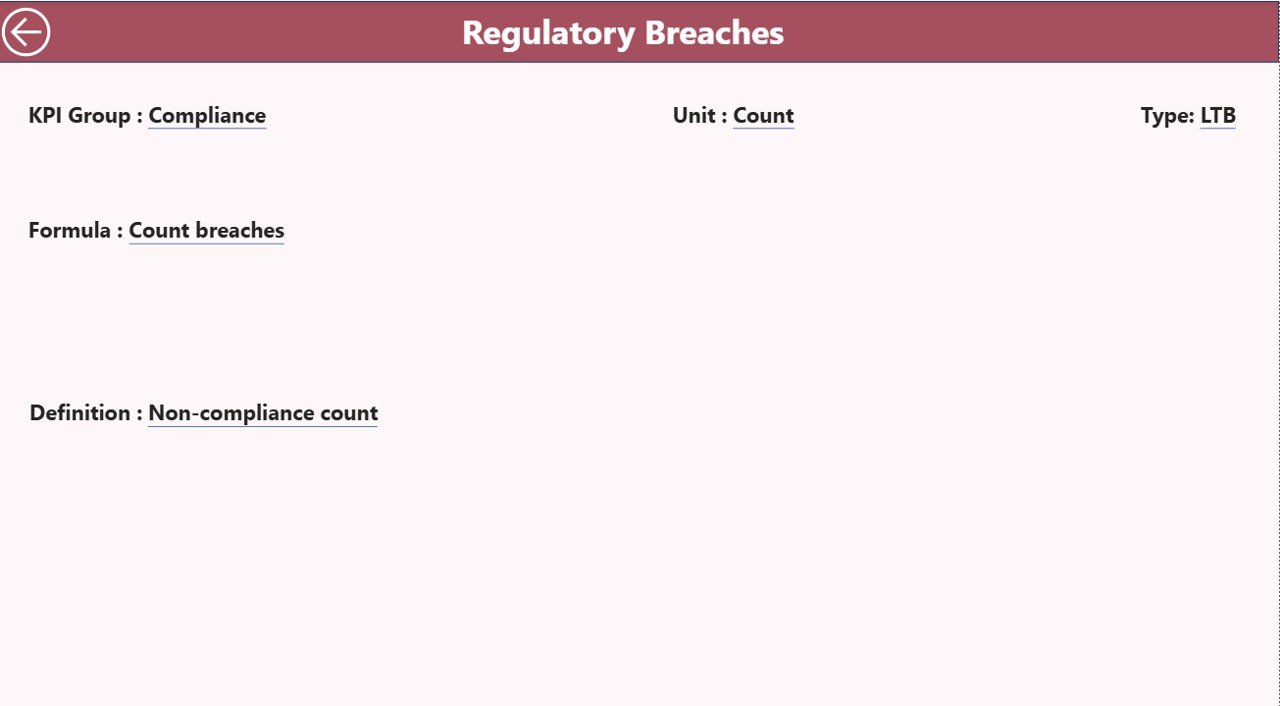
KPI Definition Page – What Does Each KPI Mean?
The KPI Definition Page adds clarity and governance to the dashboard.
Why Is This Page Important?
- It acts as a single source of truth
- It eliminates interpretation confusion
- It improves KPI consistency across teams
What Does It Show?
- KPI Formula
- KPI Definition
- KPI Type (LTB or UTB)
This page uses drill-through navigation and remains hidden by default to keep the dashboard clean. Users can return easily using the Back button on the top left corner.
Click to buy Stock Exchanges KPI Dashboard in Power BI
What Excel Sheets Power the Stock Exchanges KPI Dashboard?
The dashboard uses three structured Excel worksheets, making data entry simple and consistent.
Input_Actual Sheet
Use this sheet to enter actual performance values:
- KPI Name
- Month (first date of the month)
- MTD Actual
- YTD Actual
Input_Target Sheet
Use this sheet to enter target values:
- KPI Name
- Month (first date of the month)
- MTD Target
- YTD Target
Click to buy Stock Exchanges KPI Dashboard in Power BI
KPI Definition Sheet
This sheet defines each KPI clearly:
- KPI Number
- KPI Group
- KPI Name
- Unit
- Formula
- Definition
- KPI Type (LTB or UTB)
Because of this structure, the dashboard remains scalable and maintainable.
Advantages of Stock Exchanges KPI Dashboard in Power BI
A Stock Exchanges KPI Dashboard in Power BI delivers multiple strategic advantages.
Centralized Performance Monitoring
- Track all KPIs in one unified dashboard
- Avoid fragmented reporting systems
Real-Time Insights
- Update Excel and refresh Power BI instantly
- Make faster, data-driven decisions
Clear Target Tracking
- Instantly view target achievement status
- Identify risk areas early
Historical Comparison
- Compare current performance with previous years
- Track growth patterns and declines
User-Friendly Design
- Requires no coding knowledge
- Easy navigation with slicers and drill-through
Opportunities for Improvement in Stock Exchanges KPI Dashboards
Even though this dashboard offers strong functionality, organizations can enhance it further.
- Add automated data refresh via cloud storage
- Integrate real-time trading data APIs
- Include alert-based notifications for target misses
- Add role-based views for executives and analysts
- Expand KPIs for compliance and risk management
By implementing these improvements, exchanges can move toward predictive and prescriptive analytics.
Best Practices for the Stock Exchanges KPI Dashboard in Power BI
To maximize dashboard value, follow these best practices.
Define KPIs Clearly
- Align KPIs with business goals
- Maintain standard definitions
Keep Data Clean
- Validate Excel entries monthly
- Avoid inconsistent data formats
Focus on Visual Simplicity
- Use meaningful colors and icons
- Avoid overcrowding visuals
Review KPIs Regularly
- Retire outdated KPIs
- Introduce new metrics as strategy evolves
Train Key Users
- Ensure teams understand dashboard navigation
- Encourage data-driven discussions
Who Should Use a Stock Exchanges KPI Dashboard in Power BI?
This dashboard suits a wide range of stakeholders:
- Stock exchange management teams
- Regulatory and compliance teams
- Market operations teams
- Financial analysts
- Strategy and governance professionals
Because of its flexibility, organizations of any size can adopt it easily.
How Does This Dashboard Support Strategic Decision-Making?
The Stock Exchanges KPI Dashboard in Power BI transforms data into actionable insights.
- Leaders identify growth drivers quickly
- Teams measure operational efficiency clearly
- Risks appear early through performance gaps
- Long-term planning becomes more accurate
As a result, strategy relies on facts, not assumptions.
Conclusion: Why Invest in a Stock Exchanges KPI Dashboard in Power BI?
A Stock Exchanges KPI Dashboard in Power BI is more than a reporting tool. It is a strategic performance management system.
By combining Excel-based data entry with Power BI’s analytical strength, this dashboard delivers clarity, consistency, and confidence. Moreover, it empowers organizations to track performance, meet targets, and stay competitive in an increasingly data-driven financial ecosystem.
If your goal involves improving transparency, efficiency, and decision-making, this dashboard becomes an essential solution.
Frequently Asked Questions (FAQs)
What is the purpose of a Stock Exchanges KPI Dashboard in Power BI?
It helps track, analyze, and monitor performance KPIs for stock exchange operations in a centralized and visual way.
Do I need advanced Power BI skills to use this dashboard?
No. Users only enter data in Excel and refresh the Power BI file.
Can I customize KPIs in this dashboard?
Yes. You can add, remove, or modify KPIs through the KPI Definition sheet.
How often should I update the data?
Ideally, update data monthly for accurate MTD and YTD insights.
What KPI types does the dashboard support?
It supports both UTB (Upper the Better) and LTB (Lower the Better) KPIs.
Can this dashboard work for other financial industries?
Yes. With minor adjustments, it suits exchanges, brokers, advisory firms, and financial institutions.
Does the dashboard support historical comparison?
Yes. It includes both MTD and YTD comparisons with Previous Year data.
Is Excel mandatory for this dashboard?
Yes. Excel serves as the structured data source for Power BI.
Visit our YouTube channel to learn step-by-step video tutorials
Watch the step-by-step video tutorial:
Click to buy Stock Exchanges KPI Dashboard in Power BI