In today’s competitive market, companies can no longer afford to ignore customer feedback in supply chain and logistics operations. From on-time deliveries to customer satisfaction scores, each metric tells a story about service quality and operational efficiency. That’s where the Supply Chain and Logistics Customer Feedback KPI Dashboard in Excel becomes a powerful tool.
This ready-to-use Excel dashboard helps you track critical customer feedback KPIs in real-time. It allows you to analyze monthly and year-to-date performance, compare actual values with targets and previous years, and make fast, informed decisions that keep your customers happy and operations smooth.
Click to Purchases Supply Chain and Logistics Customer Feedback KPI Dashboard in Excel
What Is a Customer Feedback KPI Dashboard in Supply Chain and Logistics?
A Customer Feedback KPI Dashboard is a visual reporting tool used in supply chain and logistics to monitor key performance indicators (KPIs) directly tied to customer experience. This includes metrics like delivery satisfaction, issue resolution time, Net Promoter Score (NPS), return handling efficiency, and more.
By consolidating all relevant metrics into a single Excel-based dashboard, you get clear visibility into your service performance and areas that need attention—all without any complex software.
Key Features of the Excel Dashboard
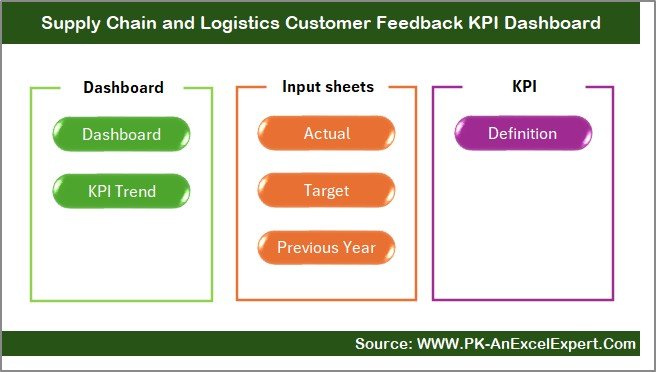
The Supply Chain and Logistics Customer Feedback KPI Dashboard is built with 7 dedicated worksheets that help you manage, track, and improve KPIs effectively. Let’s explore each tab:
Home Sheet
-
Acts as a navigation hub with six clickable buttons to quickly access each sheet.
-
Clean layout for first-time users to get started without confusion.
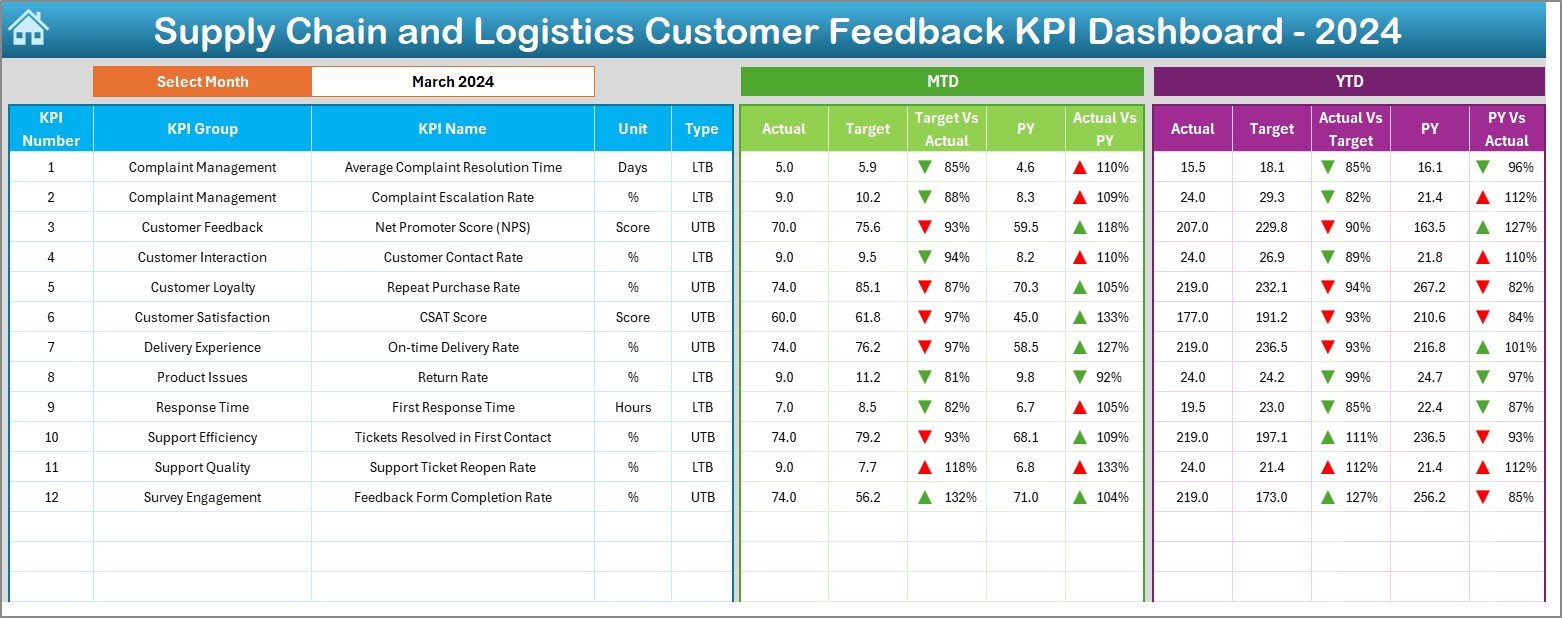
Dashboard Sheet
-
The core dashboard showing all KPIs.
-
Month selector in cell
D3updates all MTD (Month-To-Date) and YTD (Year-To-Date) data instantly. -
Displays MTD and YTD actuals, targets, and previous year data.
-
Highlights performance with conditional formatting and up/down arrows.
KPI Trend Sheet
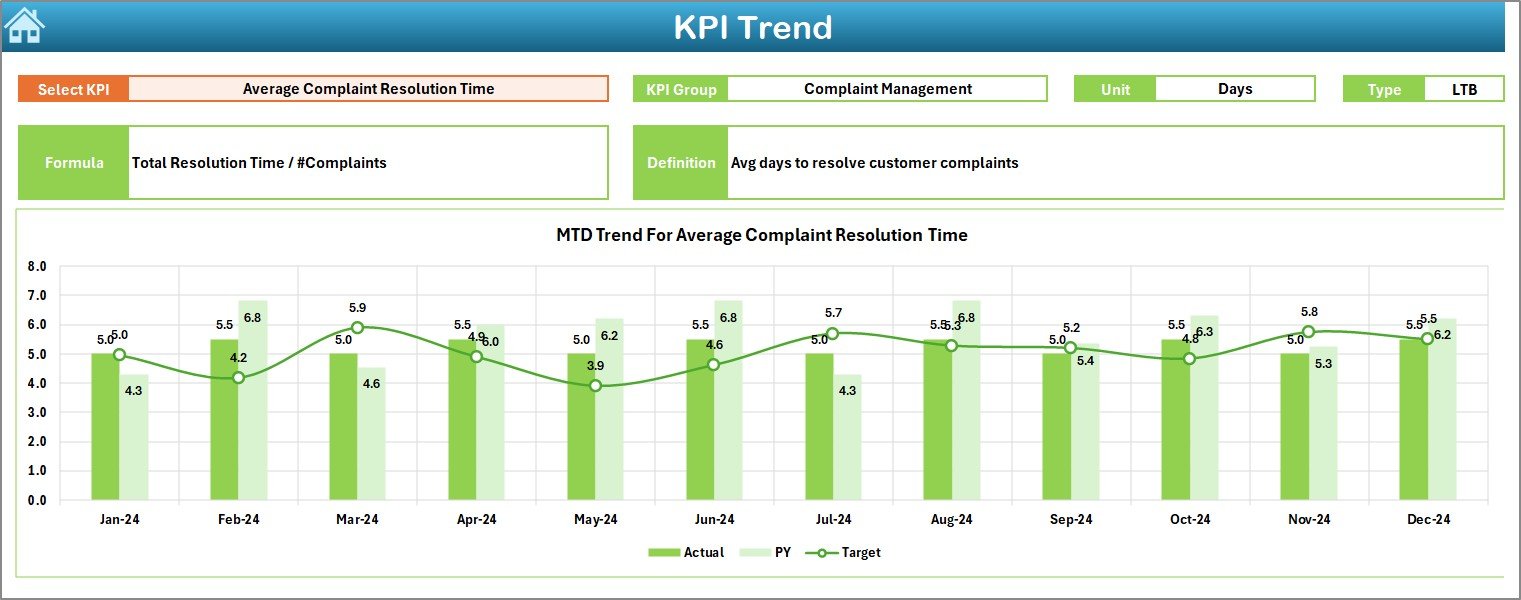
-
Select a KPI from the dropdown (
C3) to view its details. -
Shows KPI Group, Unit, Formula, and whether it’s LTB (Lower the Better) or UTB (Upper the Better).
-
Includes visual trend charts comparing actuals, targets, and previous year numbers over time.
Click to Purchases Supply Chain and Logistics Customer Feedback KPI Dashboard in Excel
Actual Numbers Input Sheet
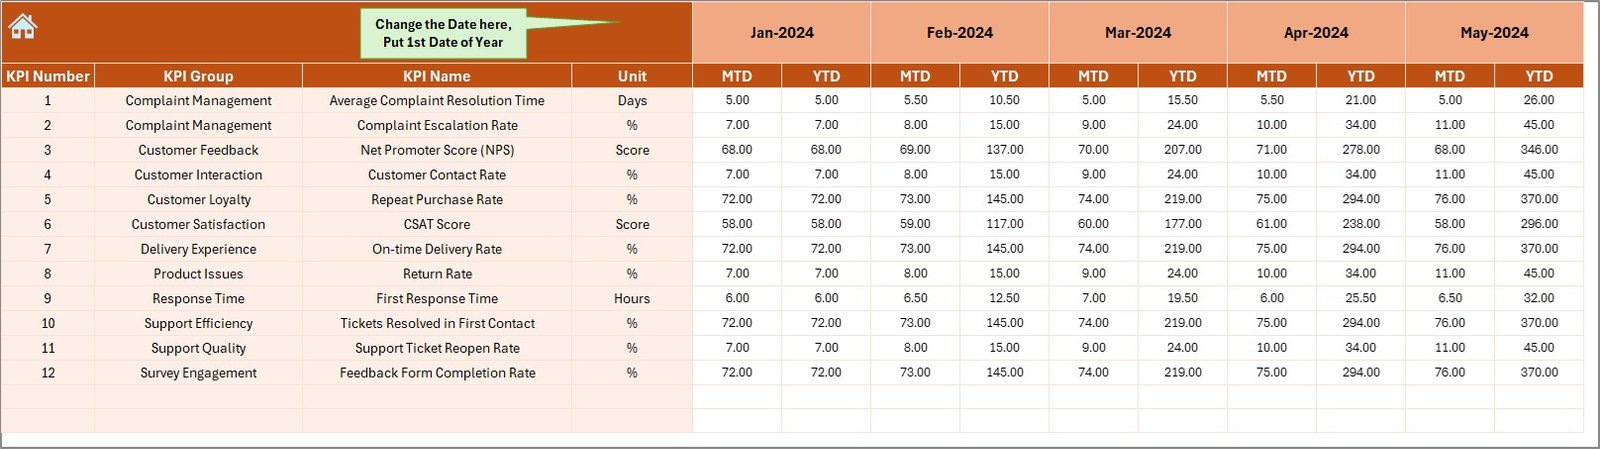
-
Input MTD and YTD performance numbers here.
-
Month selection available in cell
E1. -
Auto-updates other sheets based on actual inputs.
Target Sheet Tab
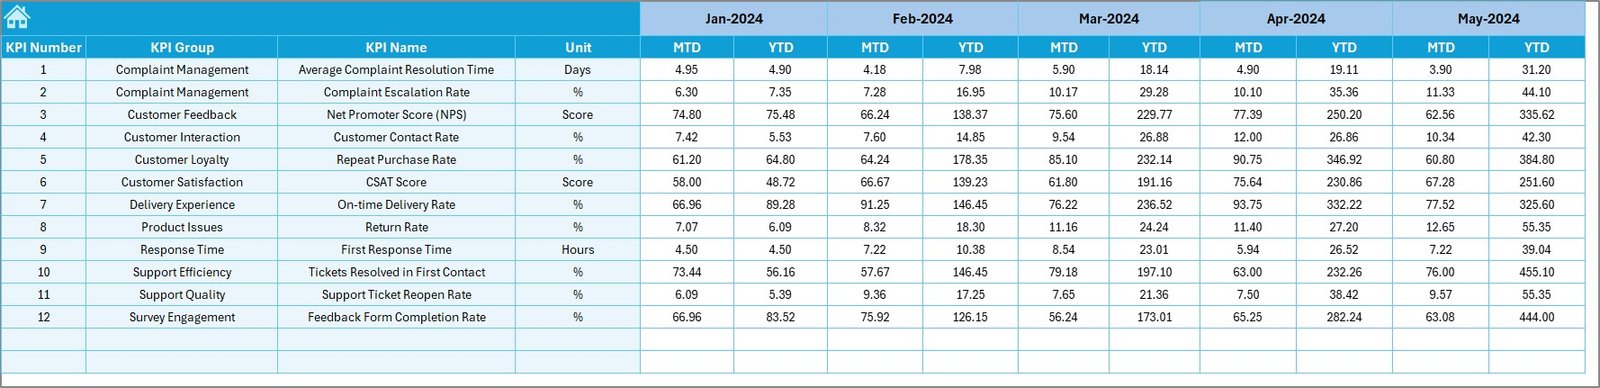
-
Enter your monthly and cumulative (YTD) targets here.
-
Structured format for easy updates.
Previous Year Sheet
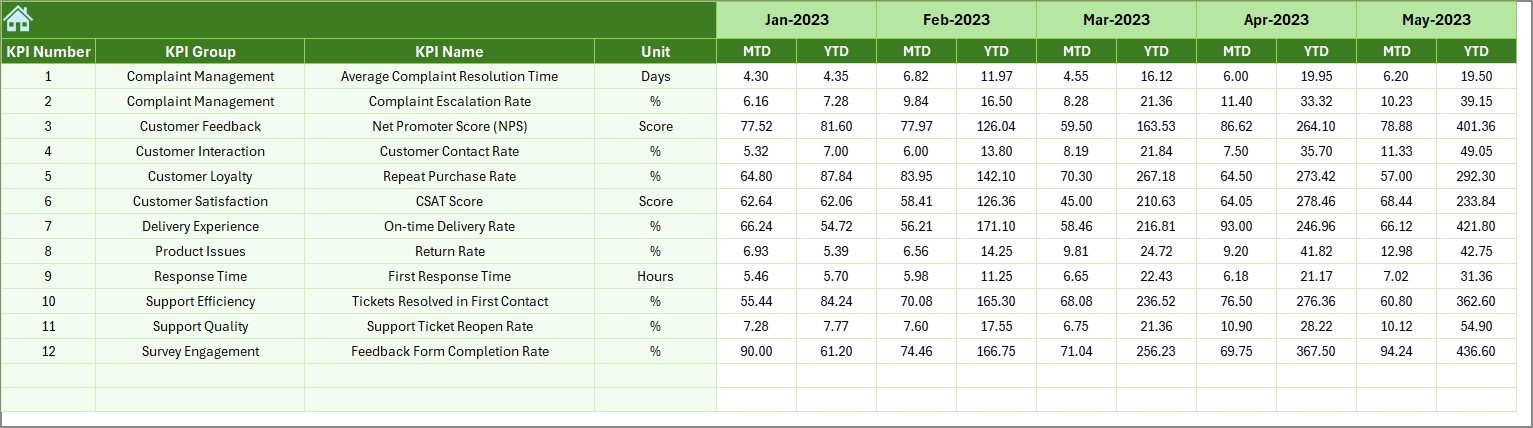
-
Store previous year’s MTD and YTD values for every KPI.
-
Enables year-on-year performance comparisons.
KPI Definition Sheet
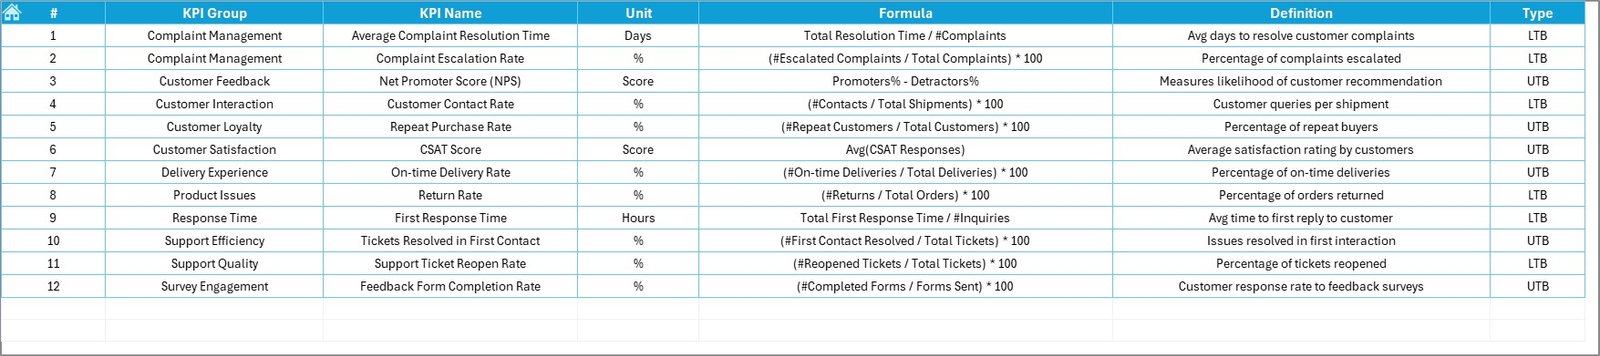
-
Enter detailed information for each KPI: name, group, unit, formula, and short definition.
-
Helps maintain consistency and understanding across your team.
Why Should You Use a KPI Dashboard in Supply Chain and Logistics?
Customer feedback directly impacts your brand reputation, repeat business, and operational growth. Here are some compelling reasons to use this Excel dashboard:
-
Track real-time performance and spot issues early.
-
Align team goals with customer expectations.
-
Improve transparency and accountability.
-
Eliminate guesswork from logistics decisions.
Advantages of Supply Chain and Logistics Customer Feedback KPI Dashboard
📌 Centralized Data
All KPIs are managed in one place, reducing the need for multiple tools or files.
📌 Easy Performance Comparison
Side-by-side comparisons between actual vs target and previous year numbers give valuable insights.
📌 Visual Clarity
Charts, slicers, and conditional formatting simplify understanding for non-technical stakeholders.
📌 Monthly Tracking with Drop-downs
Simply choose a month and the dashboard updates instantly—no need for manual recalculations.
📌 Flexible and Customizable
It’s an Excel file—meaning you can tweak formulas, add columns, or brand it your way.
Best Practices for Using the Dashboard
To get the most out of your dashboard, follow these practices:
1. Keep Data Updated Monthly
Always enter actuals, targets, and previous year data for each month. This ensures accurate reporting.
2. Align KPIs with Customer Expectations
Choose KPIs that directly reflect what your customers care about—speed, accuracy, and satisfaction.
3. Use the Trend Sheet for Analysis
Monitor KPI trends to understand seasonal patterns or emerging issues before they grow bigger.
4. Train Your Team
Make sure everyone understands how to read the dashboard and how their work affects each KPI.
5. Set SMART Targets
Make your KPI goals Specific, Measurable, Achievable, Relevant, and Time-bound.
Use Cases: Who Can Benefit from This Dashboard?
Click to Purchases Supply Chain and Logistics Customer Feedback KPI Dashboard in Excel
This Excel dashboard is suitable for a variety of teams and roles:
-
Supply Chain Managers – Monitor delivery and return KPIs.
-
Customer Service Teams – Track complaint handling and satisfaction.
-
Logistics Operations Teams – Improve on-time delivery and issue resolution.
-
Business Analysts – Use the trend charts for performance reports.
How Does It Help in Strategic Decision-Making?
By showing both MTD and YTD performance, the dashboard lets decision-makers quickly answer:
-
Are we meeting our customer service goals?
-
Which areas need immediate improvement?
-
How do we compare to last year?
-
Are our process changes having a positive impact?
With real-time insights at your fingertips, you can make faster, data-backed decisions.
Advantages of Using Excel Instead of Specialized Software
You might wonder—why Excel? Here’s why:
-
✅ No expensive licenses or subscriptions.
-
✅ Fully customizable and editable.
-
✅ Works offline.
-
✅ Most professionals already know how to use Excel.
-
✅ Easy to share via email or cloud storage.
How to Customize the Dashboard
Want to tailor it further? You can:
-
Add new KPIs in the KPI Definition sheet.
-
Modify conditional formatting to suit your brand.
-
Insert company logo and colors.
-
Extend the dashboard to cover additional years or quarters.
Summary: Why This Dashboard Is a Must-Have
Managing customer satisfaction in supply chain and logistics is no longer optional. With the Supply Chain and Logistics Customer Feedback KPI Dashboard in Excel, you gain full control over your service metrics—backed by clear visuals and powerful trend tracking.
No steep learning curve. No monthly fees. Just smart, structured reporting in one simple file.
Frequently Asked Questions (FAQs)
1. Can I use this dashboard for other industries too?
Yes, while designed for supply chain and logistics, you can easily adapt it for customer service, retail, e-commerce, or healthcare.
2. Do I need advanced Excel knowledge to use this dashboard?
Not at all! Basic Excel knowledge (data entry, dropdowns, charts) is enough. Instructions are straightforward.
3. How many KPIs can I track with this dashboard?
You can track as many KPIs as you want. The template is flexible—just make sure to update the corresponding sheets.
4. Can I share this dashboard with my team?
Yes. You can share the Excel file via email or cloud services like Google Drive or OneDrive.
5. Does the dashboard auto-update charts when I change the month?
Absolutely. Just select the month from the dropdown in the Dashboard sheet (D3) and all values and charts will update instantly.
6. Is this dashboard mobile-friendly?
Excel dashboards are best viewed on a desktop or laptop, but they can also be viewed on mobile with the Excel app.
7. Can I use this to track customer complaints only?
Yes. You can focus the dashboard solely on complaint-related KPIs if that’s your goal.
8. Can I add filters or slicers?
Yes, since it’s Excel—you can add filters, slicers, and even pivot tables for deeper analysis.
Visit our YouTube channel to learn step-by-step video tutorials
Click to Purchases Supply Chain and Logistics Customer Feedback KPI Dashboard in Excel
Watch the step-by-step video tutorial: