Team performance plays a critical role in the success of any organization. Whether you manage a small group or a large global team, you need clear performance metrics and accessible dashboards to make informed decisions. That is why a Team Management KPI Dashboard in Power BI has become an essential tool in modern business operations.
In this comprehensive guide, we will walk you through everything you need to know about a Team Management KPI Dashboard, including its features, benefits, use cases, and best practices.
Click to Purchases Team Management KPI Dashboard in Power BI
What Is a Team Management KPI Dashboard in Power BI?
A Team Management KPI Dashboard in Power BI is a ready-to-use solution that helps you track and analyze key performance indicators (KPIs) for your team. It captures data from a simple Excel input file and converts it into powerful visual reports inside Power BI.
The dashboard provides managers with a holistic overview of team performance, progress against goals, month-to-date (MTD) and year-to-date (YTD) trends, and detailed KPI breakdowns.
Why Do You Need a Team KPI Dashboard?
Without a dashboard, team performance monitoring often relies on manual reporting and fragmented spreadsheets. That leads to delayed decisions and poor visibility. In contrast, a Team KPI Dashboard offers real-time insights, enables faster decisions, and aligns team members with business goals.
Key Reasons To Use a Team Management Dashboard:
✅ Monitor performance against targets instantly
✅ Identify improvement opportunities quickly
✅ Support data-driven decision making
✅ Encourage transparency within the team
✅ Boost overall productivity and accountability
Key Features of the Team Management KPI Dashboard in Power BI
This Power BI dashboard includes three interactive pages, each designed to present critical KPI information in a clear and actionable format.
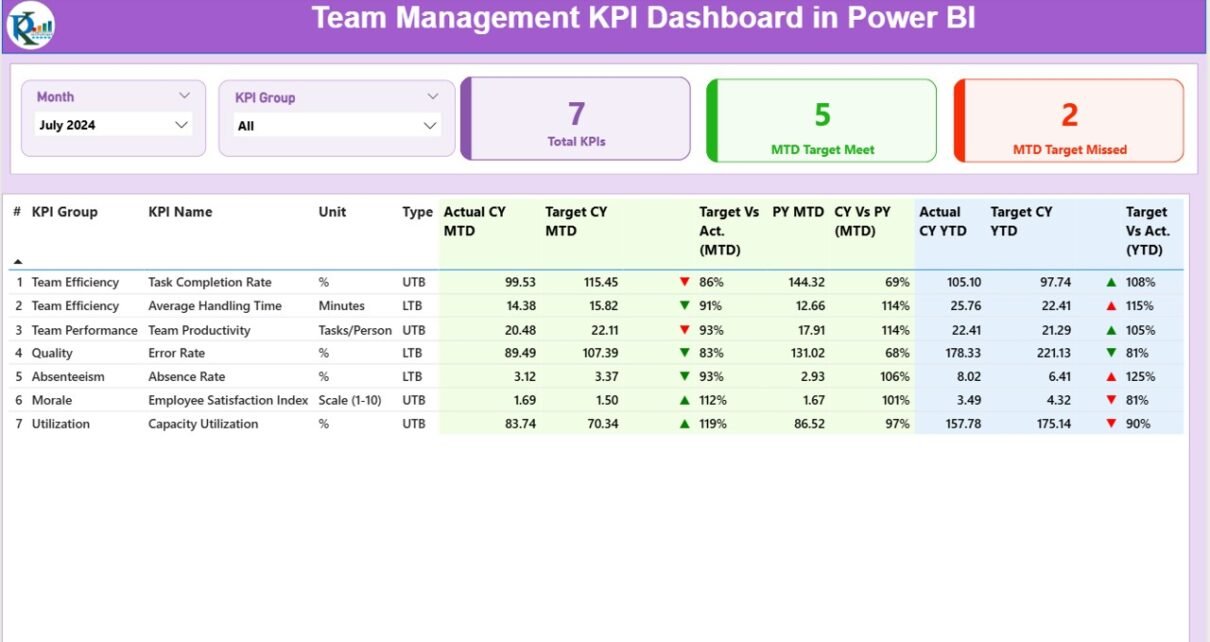
Summary Page
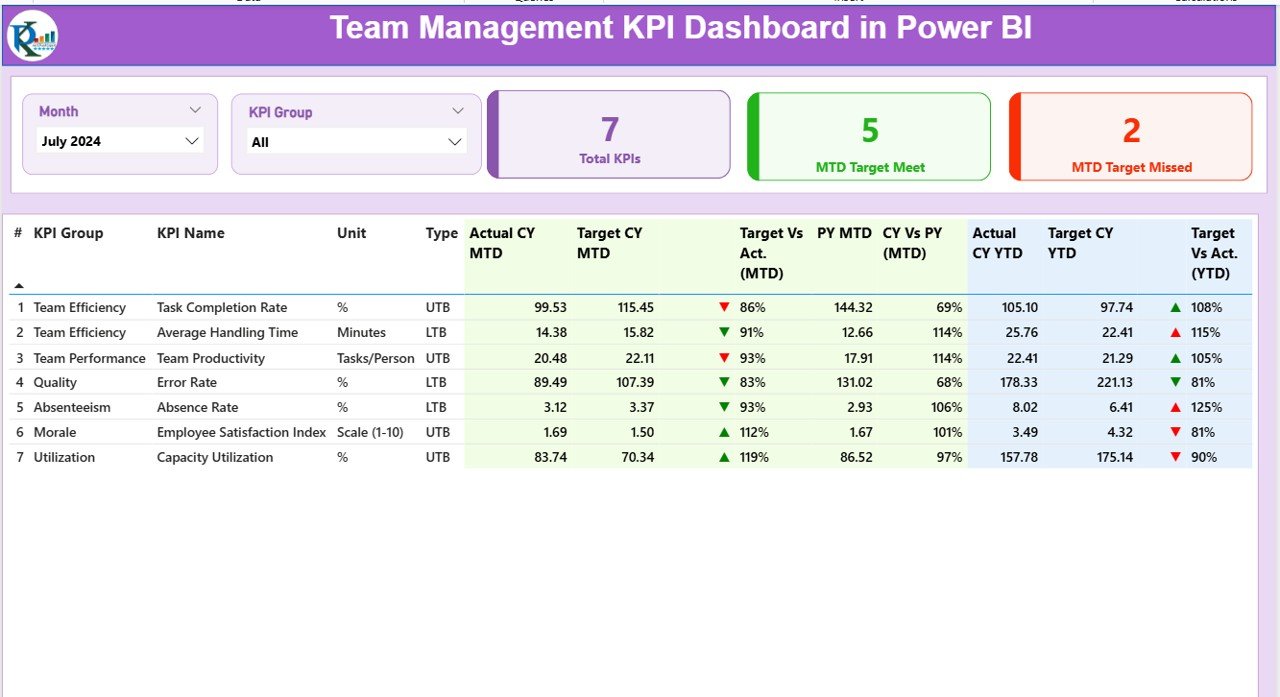
This is the main page of the dashboard and includes:
-
Slicers for Month and KPI Group
-
Cards that show the total KPI count, MTD Target Met count, and MTD Target Missed count
A detailed table with the following fields:
- KPI Number
- KPI Group
- KPI Name
- Unit
- Type (LTB or UTB)
- Actual CY MTD
- Target CY MTD
- MTD Status Icon (▲ or ▼)
- Target vs Actual (MTD %)
- PY MTD
- CY vs PY (MTD %)
- Actual CY YTD
- Target CY YTD
- YTD Status Icon (▲ or ▼)
- Target vs Actual (YTD %)
- PY YTD
- CY vs PY (YTD %)
This information helps managers quickly understand which KPIs are on track and which need attention.
KPI Trend Page
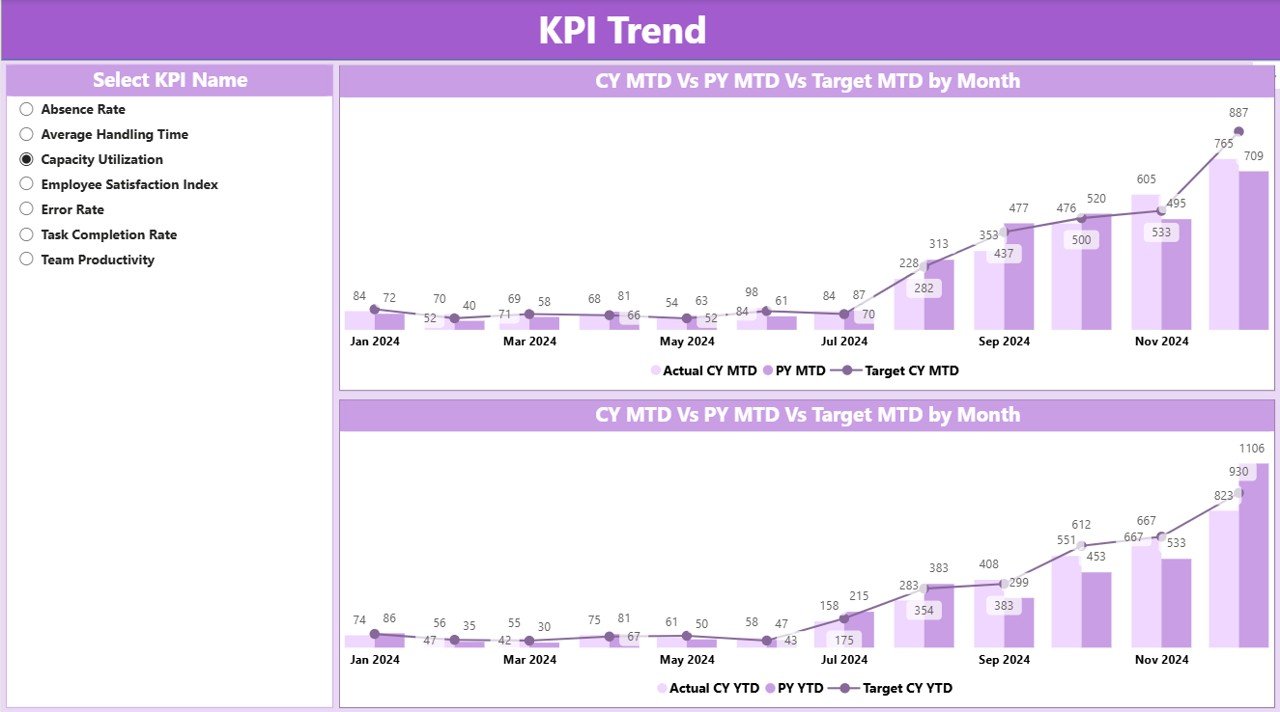
This page helps you analyze performance trends over time.
-
Combo charts display Current Year Actual, Target, and Previous Year Actual values
-
MTD and YTD trends are shown side by side
-
A slicer allows you to select the KPI Name you want to analyze
Click to Purchases Team Management KPI Dashboard in Power BI
KPI Definition Page
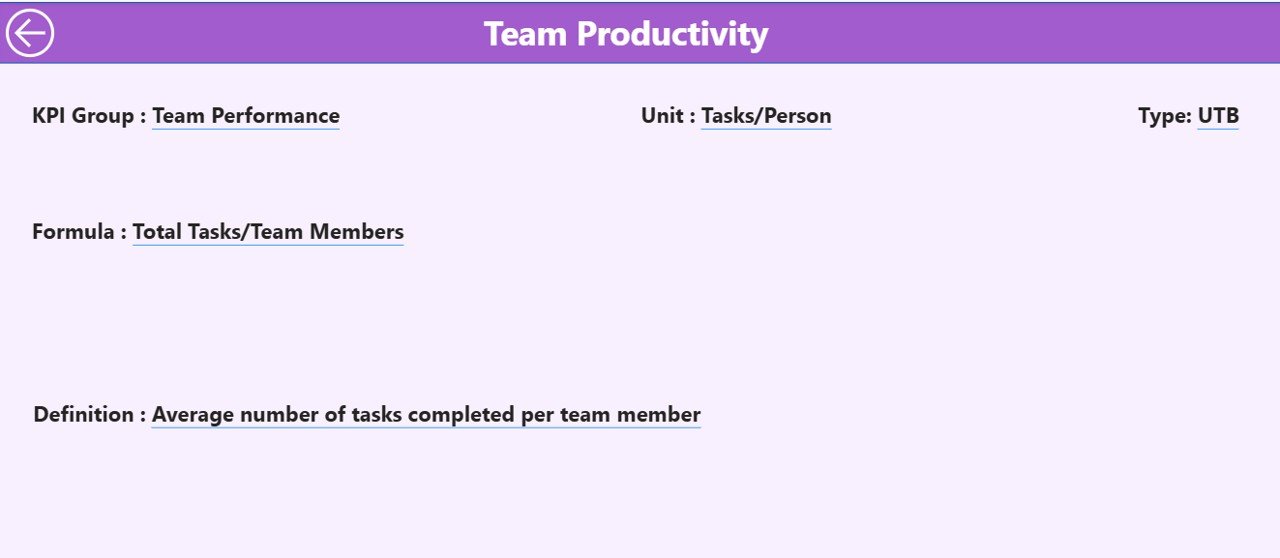
This is a hidden drill-through page that displays KPI-level information:
-
Formula
-
KPI Description/Definition
You can access it by right-clicking on any KPI in the Summary page and selecting Drill Through.
How to Use the Team Management KPI Dashboard
Follow these simple steps to use the dashboard effectively:
✅ Step 1: Update the Excel File
Add your team performance data to the Input_Actual and Input_Target sheets.
Make sure to use the first day of each month in the Month field.
✅ Step 2: Refresh the Power BI Dashboard
Open the Power BI file and click Refresh to pull the updated data instantly.
✅ Step 3: Filter and Explore
Use the slicers (Month, KPI Group, KPI Name) to explore metrics.
✅ Step 4: Drill Down for Details
Right-click on any KPI in the Summary page and select Drill Through to see the KPI Definition page.
Best Practices for Using a Team Management KPI Dashboard
Implementing a dashboard is only half the challenge. You must also apply the right practices to get the most value from it.
Here are some proven best practices:
-
Define SMART KPIs that are relevant and measurable
-
Keep the data source clean and updated every month
-
Limit the number of visual elements to avoid clutter
-
Use intuitive icons and labels to simplify interpretation
-
Review the dashboard in team meetings regularly
-
Encourage feedback from team members on dashboard usability
-
Continuously refine KPIs and targets as business priorities change
Frequently Asked Questions (FAQs)
Q1. Can we customize the KPIs in the dashboard?
Yes, you can customize all KPIs by updating the KPI Definition worksheet in the Excel file.
Q2. Does the dashboard work with live data?
You can connect it to live data sources (SQL, SharePoint, etc.) in Power BI, but the current version uses an Excel file as input.
Q3. Do I need Power BI Pro to use this dashboard?
You only need Power BI Desktop to explore and refresh the dashboard. However, a Pro license is required if you publish it to the Power BI Service.
Q4. Can I add my company logo to the dashboard?
Yes. You can insert an image on each page in Power BI and place your company logo in a visible location.
Q5. Can I export the dashboard results to Excel?
Yes, Power BI allows you to export any table to Excel using the “Export data” option.
Conclusion
A Team Management KPI Dashboard in Power BI is one of the most powerful tools for improving team performance. It puts real-time data, visual insights, and goal tracking in one central place. With an easy Excel input structure and interactive Power BI visuals, this dashboard empowers you to make informed decisions, streamline reporting, and motivate your team.
Visit our YouTube channel to learn step-by-step video tutorials