Think tanks play a critical role in shaping public policy, economic strategies, and social development. They conduct research, publish reports, organize events, and influence decision-making across governments, institutions, and organizations. However, managing all these activities becomes challenging when data stays scattered across multiple spreadsheets and reports.
Many research organizations still rely on manual tracking systems. As a result, teams spend hours compiling reports instead of analyzing insights. Moreover, leadership often struggles to measure policy impact, funding efficiency, and regional performance clearly.
Therefore, organizations increasingly adopt structured dashboards to monitor performance in real time. A Think Tanks Dashboard in Excel provides a centralized and automated solution that transforms raw data into meaningful insights.
In this article, you will learn everything about the Think Tanks Dashboard in Excel, including its structure, features, benefits, best practices, implementation steps, and frequently asked questions.
Click to Purchases Think Tanks Dashboard in Excel
What Is a Think Tanks Dashboard in Excel?
A Think Tanks Dashboard in Excel is a ready-to-use analytical reporting system designed to monitor research activities, funding performance, publications, events, and policy impact using interactive visualizations.
Instead of reviewing multiple reports separately, decision-makers can analyze performance from one centralized dashboard.
The dashboard combines:
-
Data tracking
-
Performance measurement
-
Funding analysis
-
Regional insights
-
Research evaluation
-
Monthly trend monitoring
Because Excel remains widely accessible, organizations can implement this system without investing in expensive software.
Why Should Think Tanks Use an Excel Dashboard?
Think tanks handle complex data sets involving funding sources, research areas, publications, and policy outcomes. Without a structured system, teams face several challenges.
Common Problems Without a Dashboard
-
Data stored in multiple files
-
Delayed reporting cycles
-
Limited performance visibility
-
Difficult funding analysis
-
Inefficient decision-making
-
Manual calculations leading to errors
However, an Excel dashboard solves these problems by creating a single source of truth.
Key Features of the Think Tanks Dashboard in Excel
The Think Tanks Dashboard comes as a ready-to-use Excel desktop application designed with interactive navigation and analytical pages.
Page Navigator
Located on the left side, the Page Navigator allows users to move quickly between analytical sections. Therefore, users can switch insights instantly without searching through sheets.
Right-Side Slicer Panel
Each page contains slicers on the right side that allow filtering by:
-
Region
-
Country
-
Research Area
-
Funding Score
-
Time period
Consequently, users can analyze data dynamically.
How Is the Think Tanks Dashboard Structured?
The dashboard contains five analytical pages, each designed for a specific level of analysis.
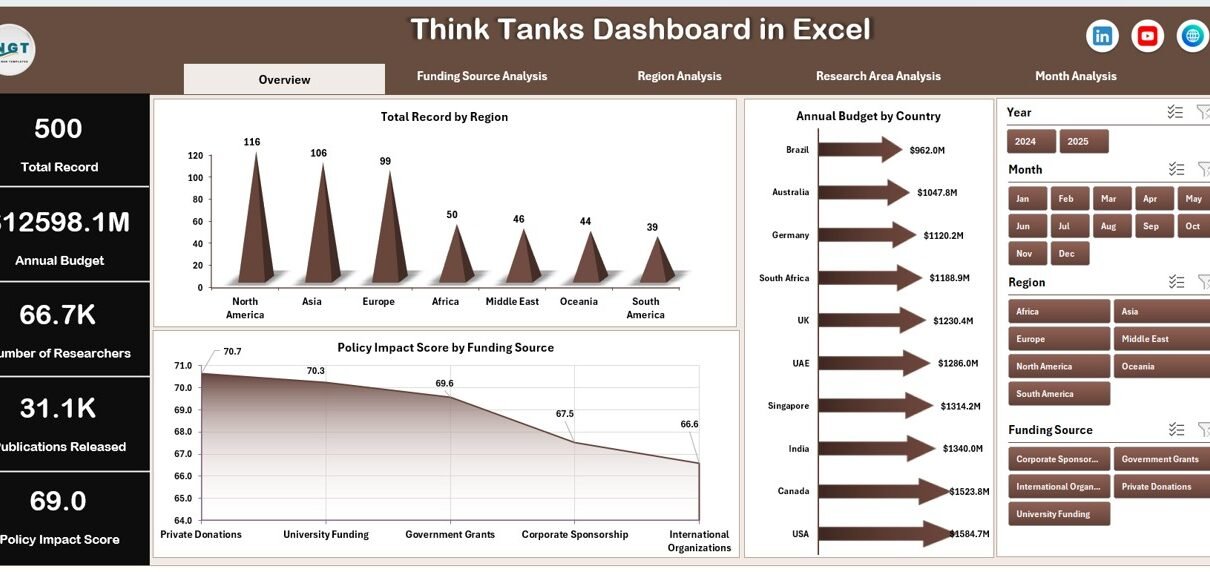
1. Overview Page – The Central Performance Hub
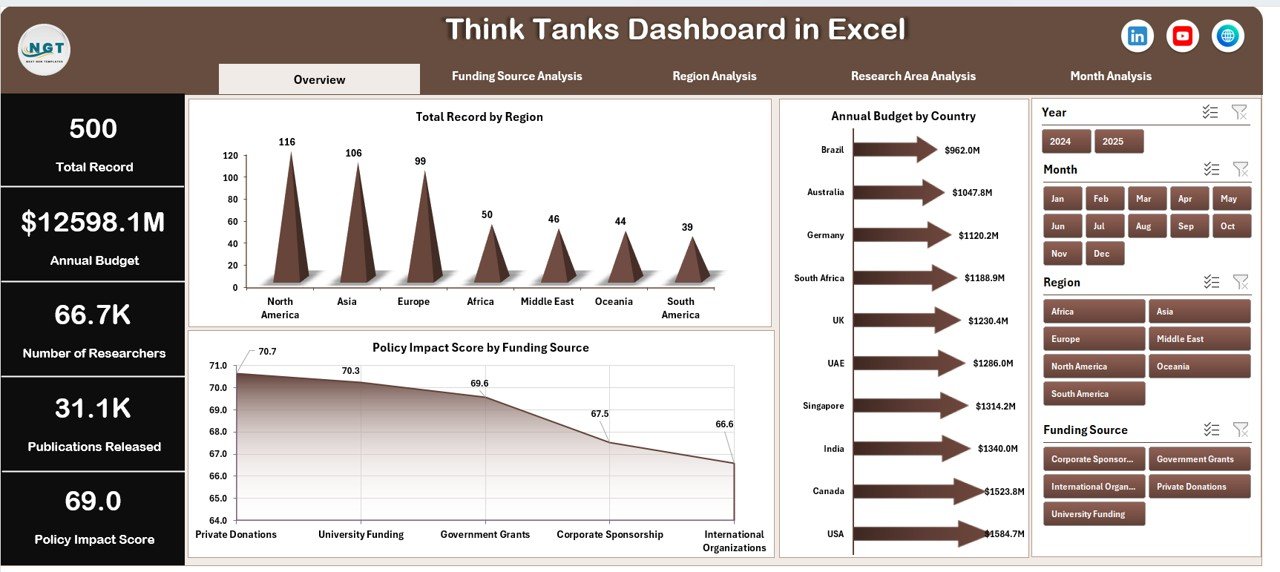
The Overview Page acts as the main interface where leadership receives a complete snapshot of organizational performance.
Key Elements
-
Interactive slicers on the right side
-
Four KPI cards showing summary metrics
-
High-level analytical charts
Charts Included
-
Total Records by Region
-
Annual Budget by Country
-
Policy Impact Score by Funding Score
Why Is the Overview Page Important?
Click to Purchases Think Tanks Dashboard in Excel
Because executives need quick insights, this page summarizes performance instantly. Users can identify high-performing regions and funding effectiveness within seconds.
2. Funding Source Analysis – Understanding Financial Impact
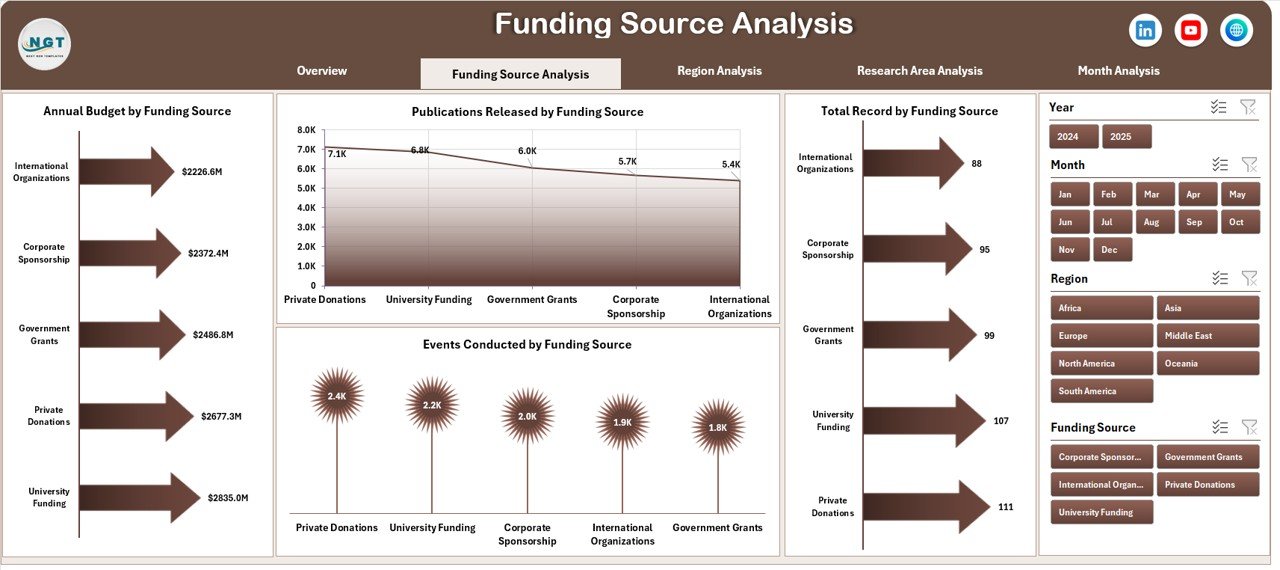
Funding drives research operations. Therefore, analyzing funding efficiency becomes essential.
Charts Available
-
Total Records by Funding Score
-
Annual Budget by Funding Score
-
Publications Released by Funding Score
-
Events Conducted by Funding Score
Insights You Can Gain
-
Which funding levels produce more research output
-
Relationship between funding and policy impact
-
Efficient allocation of financial resources
-
High-performing funding categories
As a result, organizations improve budgeting strategies.
3. Region Analysis – Measuring Geographic Performance
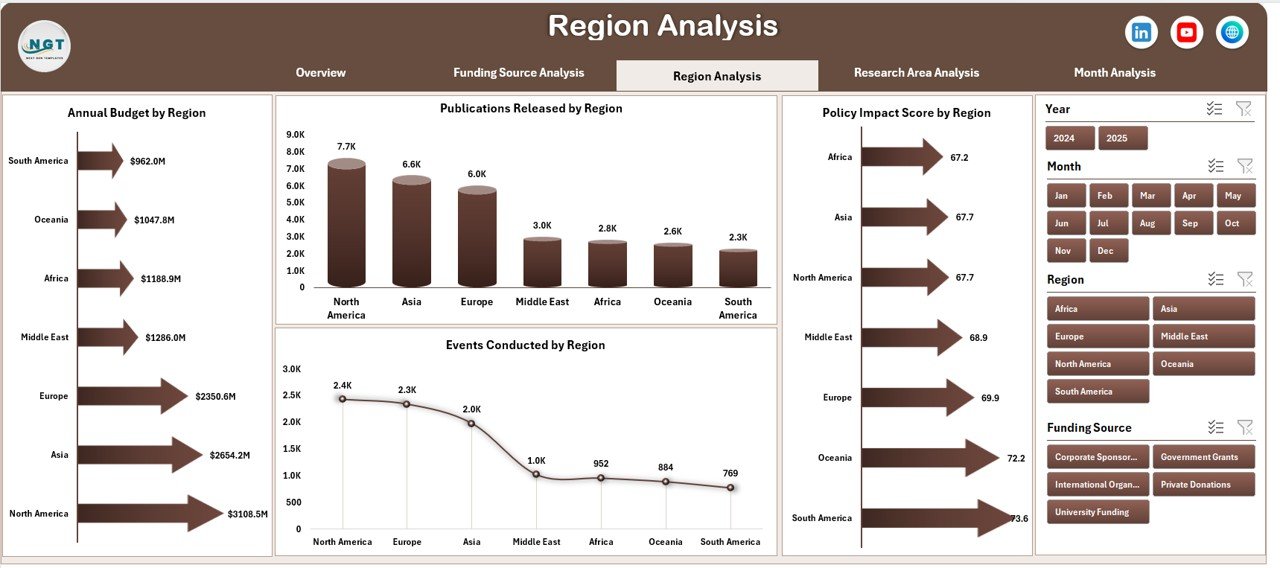
Think tanks often operate across multiple regions. Consequently, leadership must understand regional contributions.
Charts Included
-
Annual Budget by Region
-
Publications Released by Region
-
Events Conducted by Region
-
Policy Impact Score by Region
Benefits of Regional Analysis
-
Identify strong research locations
-
Evaluate regional investment efficiency
-
Compare policy influence geographically
-
Optimize regional resource allocation
Thus, organizations make location-based strategic decisions.
4. Research Area Analysis – Evaluating Knowledge Domains
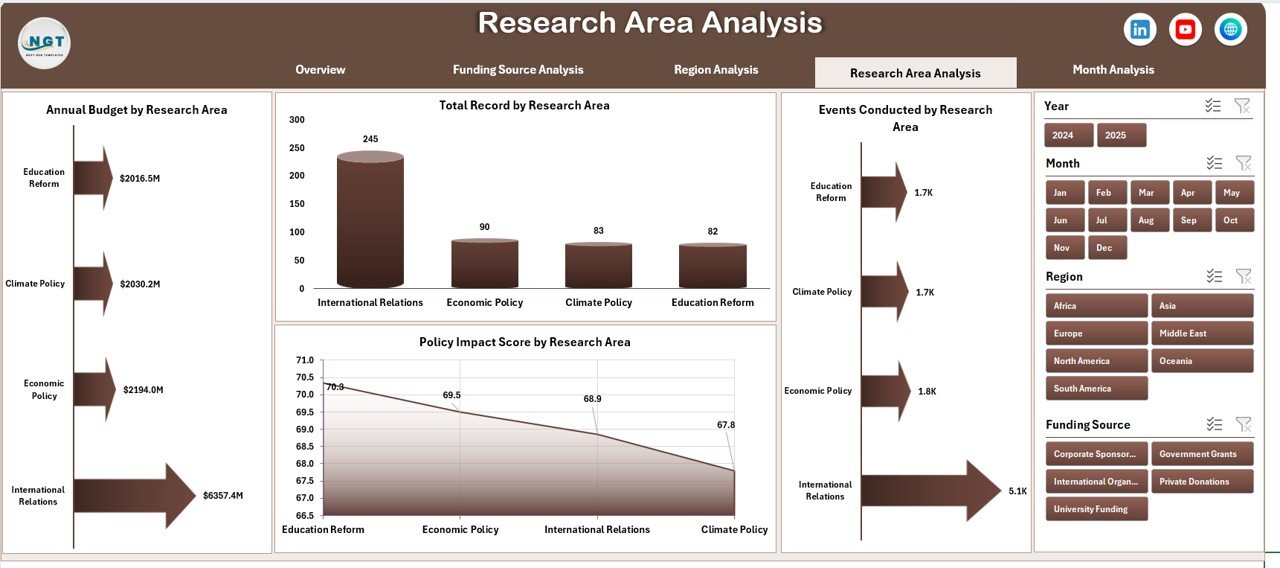
Think tanks work across diverse research areas such as economics, climate policy, governance, healthcare, and education.
Charts Available
-
Annual Budget by Research Area
-
Total Records by Research Area
-
Events Conducted by Research Area
-
Policy Impact Score by Research Area
Why This Page Matters
This analysis helps organizations:
-
Understand which research topics deliver higher impact
-
Allocate funding effectively
-
Prioritize strategic research initiatives
-
Track subject-area performance
Therefore, leadership aligns research with mission goals.
Click to Purchases Think Tanks Dashboard in Excel
5. Month Analysis – Tracking Performance Trends Over Time
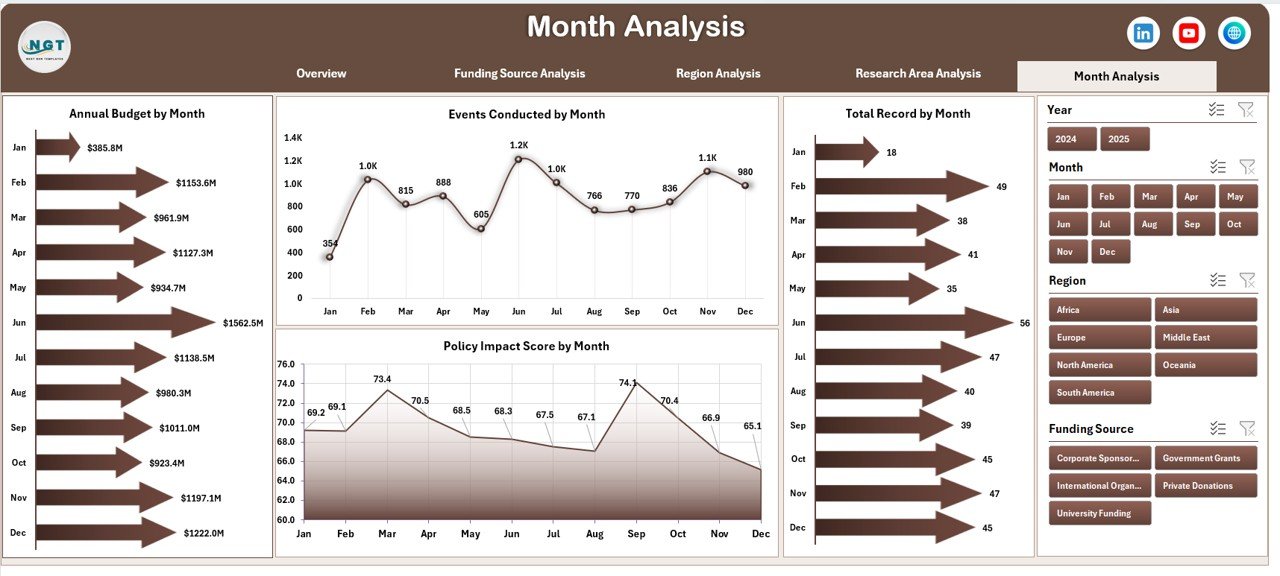
Trend analysis enables long-term planning. Hence, the Month Analysis page focuses on time-based performance tracking.
Charts Included
-
Annual Budget by Month
-
Total Records by Month
-
Events Conducted by Month
-
Policy Impact Score by Month
Insights Provided
-
Seasonal research trends
-
Monthly activity growth
-
Event scheduling effectiveness
-
Impact progression over time
Because trends reveal patterns, teams can forecast future outcomes.
What Data Supports the Dashboard?
Data Sheet
The Data Sheet acts as the primary data repository where users enter operational information such as:
-
Region
-
Country
-
Funding Score
-
Research Area
-
Annual Budget
-
Publications Released
-
Events Conducted
-
Policy Impact Score
-
Month and Year
Once users update this sheet, all dashboard visuals refresh automatically.
Support Sheet
The Support Sheet handles calculations, pivot tables, and backend formulas. Therefore, users do not need advanced Excel knowledge to operate the dashboard.
What Insights Can Organizations Extract from This Dashboard?
A Think Tanks Dashboard transforms raw data into strategic intelligence.
Operational Insights
-
Research productivity tracking
-
Publication performance measurement
-
Event effectiveness analysis
Financial Insights
-
Budget allocation efficiency
-
Funding impact evaluation
-
Resource optimization opportunities
Strategic Insights
-
Policy influence measurement
-
Research area prioritization
-
Regional expansion decisions
Advantages of Think Tanks Dashboard in Excel
📊 Centralized Monitoring
Track all research activities in one structured interface.
⚡ Faster Decision-Making
Leadership accesses insights instantly instead of waiting for reports.
🎯 Improved Resource Allocation
Organizations invest funds where impact remains highest.
📈 Better Performance Visibility
Charts clearly show strengths and improvement areas.
🔄 Dynamic Filtering
Slicers allow flexible analysis without manual calculations.
💰 Cost-Effective Solution
Excel eliminates the need for expensive analytics platforms.
👥 Easy Collaboration
Teams can share and update files easily.
How to Implement a Think Tanks Dashboard in Excel?
Click to Purchases Think Tanks Dashboard in Excel
Step 1: Prepare Data Structure
Create standardized columns for funding, region, research area, and outcomes.
Step 2: Input Historical Data
Add past records to enable trend analysis.
Step 3: Connect Pivot Tables
Use pivot tables to summarize metrics.
Step 4: Build Visual Charts
Create pivot charts for each analytical page.
Step 5: Add Slicers
Enable interactive filtering.
Step 6: Validate Data Accuracy
Check formulas and calculations.
Step 7: Train Users
Ensure teams understand dashboard navigation.
Best Practices for the Think Tanks Dashboard in Excel
Maintain Clean Data
-
Avoid duplicate entries
-
Use consistent naming conventions
-
Validate numeric values
Update Data Regularly
-
Enter monthly updates
-
Review funding records frequently
Use Standard KPIs
-
Policy Impact Score
-
Publications Released
-
Events Conducted
-
Budget Utilization
Keep Visuals Simple
-
Avoid overcrowded charts
-
Highlight key metrics clearly
Protect Backend Sheets
Prevent accidental formula changes.
How Does This Dashboard Improve Strategic Decision-Making?
When leadership sees consolidated data, they act faster. For example:
-
If a region shows high funding but low impact, management investigates efficiency.
-
If a research area generates strong policy influence, organizations increase investment.
-
If monthly activity declines, teams adjust operational plans.
Thus, data-driven decisions replace assumptions.
Who Can Benefit from a Think Tanks Dashboard?
This dashboard serves multiple stakeholders.
Policy Research Organizations
Track research effectiveness and funding utilization.
Non-Profit Institutions
Measure program impact transparently.
Government Research Bodies
Monitor policy outcomes efficiently.
Academic Research Centers
Evaluate publications and engagement activities.
International Development Agencies
Analyze global research programs.
Why Choose Excel Instead of Complex BI Tools?
Although advanced tools exist, Excel offers unique advantages.
-
Familiar interface
-
Lower learning curve
-
Quick implementation
-
Flexible customization
-
Offline accessibility
-
No licensing complexity
Therefore, Excel remains a powerful analytics platform for research organizations.
Common Challenges and How to Overcome Them
Click to Purchases Think Tanks Dashboard in Excel
Challenge: Data Inconsistency
Solution: Use validation lists.
Challenge: Manual Updates
Solution: Standardize data entry templates.
Challenge: Large Data Volumes
Solution: Use Excel tables and pivot optimization.
Challenge: Misinterpreted Metrics
Solution: Define KPIs clearly in support sheets.
Future Enhancements You Can Add
Organizations can expand the dashboard further.
-
Automated data import using Power Query
-
KPI scorecards with traffic lights
-
Forecast analysis
-
Research impact benchmarking
-
Executive summary reports
Conclusion
The Think Tanks Dashboard in Excel provides a powerful yet simple way to manage research performance, funding efficiency, and policy impact within a single platform. Instead of relying on fragmented spreadsheets, organizations gain a unified analytical environment that supports smarter decisions.
Moreover, interactive slicers, structured analytical pages, and dynamic charts help leadership understand performance instantly. As a result, think tanks improve transparency, optimize funding allocation, and strengthen research outcomes.
Ultimately, this dashboard transforms data into actionable intelligence, enabling organizations to focus more on influencing policy and less on preparing reports.
Frequently Asked Questions (FAQs)
What is a Think Tanks Dashboard in Excel used for?
It helps organizations track research activities, funding performance, publications, events, and policy impact using interactive charts.
Do I need advanced Excel skills to use this dashboard?
No. The dashboard works as a ready-to-use solution with automated calculations.
Can I customize the dashboard?
Yes. Users can add KPIs, charts, and filters based on organizational needs.
How often should data be updated?
You should update data monthly for accurate trend analysis.
Is Excel suitable for large research organizations?
Yes. With proper data structure and pivot tables, Excel handles large datasets efficiently.
Can this dashboard support strategic planning?
Absolutely. It provides insights that guide funding decisions, research prioritization, and performance improvement.
Does the dashboard support multiple regions and research areas?
Yes. The slicer functionality allows dynamic filtering across categories.
Visit our YouTube channel to learn step-by-step video tutorials