The live events industry grows faster than ever. Concerts, corporate events, festivals, sports matches, and exhibitions attract massive audiences every month. However, event managers face intense competition, rising marketing costs, and fluctuating ticket demand. Therefore, you must track sales, revenue, ratings, and marketing spend in real time.
So, how do you monitor gross sales, net sales, ticket types, event performance, and monthly trends in one structured system?
Click to Purchases Ticketing and Live Events Dashboard in Excel
The answer is simple.
You need a Ticketing and Live Events Dashboard in Excel.
In this detailed guide, you will learn:
-
What a Ticketing and Live Events Dashboard in Excel is
-
Why event organizers need it
-
Dashboard structure and page details
-
Key metrics included
-
Advantages of Ticketing and Live Events Dashboard in Excel
-
Best Practices for the Ticketing and Live Events Dashboard in Excel
-
Frequently Asked Questions
Let’s dive in.
What Is a Ticketing and Live Events Dashboard in Excel?
A Ticketing and Live Events Dashboard in Excel is a ready-to-use analytics solution designed to track and analyze event performance in a structured format.
Instead of checking multiple spreadsheets, you can:
-
Track gross sales and net sales
-
Monitor marketing spend
-
Analyze event ratings
-
Compare performance by city and region
-
Review ticket types and event types
-
Study monthly sales trends
Because Excel supports Pivot Tables, Pivot Charts, slicers, and structured tables, you can create a fully interactive dashboard without complex tools.
As a result, event managers make faster and smarter decisions.
Why Do Event Organizers Need a Ticketing and Live Events Dashboard?
Event management involves multiple moving parts. Therefore, you must track:
-
Venue performance
-
City-wise sales
-
Marketing campaign results
-
Ticket category contribution
-
Customer satisfaction ratings
However, when you manage all this data manually, you waste time and miss trends.
On the other hand, when you use a structured Excel dashboard:
-
You see everything in one place
-
You identify top-performing events instantly
-
You control marketing budgets effectively
-
You improve ticket pricing strategies
Consequently, your event business becomes more profitable and data-driven.
Dashboard Structure: 5 Powerful Analytical Pages
This Ticketing and Live Events Dashboard in Excel includes 5 analytical pages along with a Support Sheet and Data Sheet.
Additionally, the dashboard includes a Page Navigator located on the left side. This feature allows smooth navigation across different pages.
Now let’s explore each page in detail.
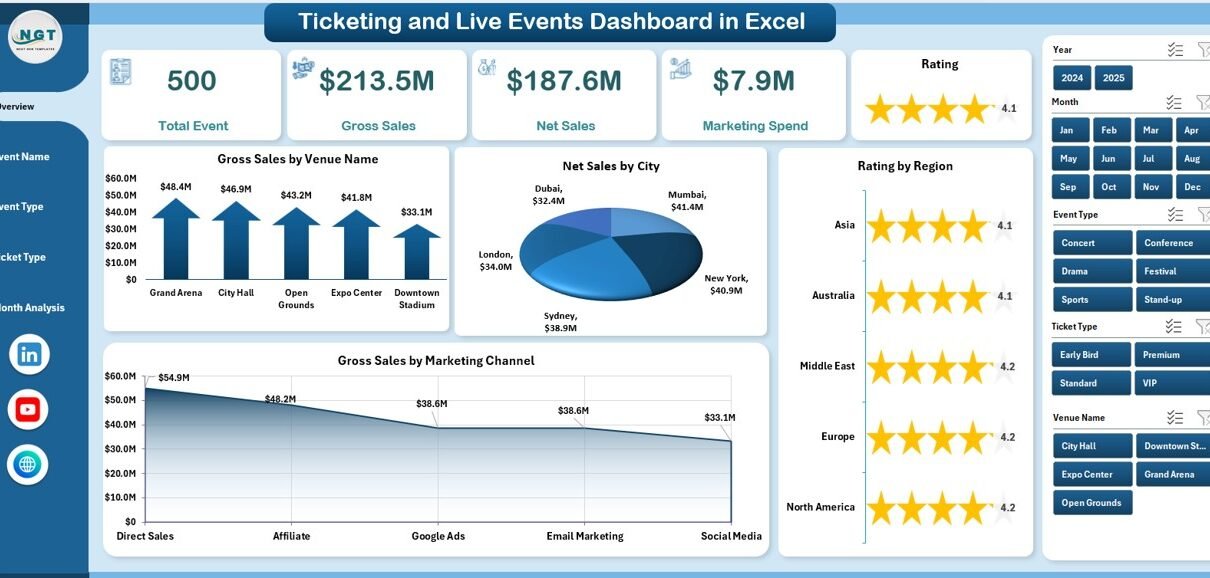
1️⃣ Overview Page – Complete Business Snapshot

The Overview Page works as the main control center of the dashboard.
On the right side, you get a slicer (silencer) that allows you to filter data dynamically.
Key Components of the Overview Page
✔ 4 KPI Cards
These cards display high-level summary information such as:
-
Total Gross Sales
-
Total Net Sales
-
Total Marketing Spend
-
Average Rating
Because these cards update instantly when you use slicers, you always see real-time insights.
Click to Purchases Ticketing and Live Events Dashboard in Excel
✔ 4 Interactive Charts
-
Gross Sales by Venue Name
-
Net Sales by City
-
Rating by Region
-
Gross Sales by Marketing
Therefore, you quickly understand:
-
Which venues generate the highest revenue
-
Which cities perform better
-
Which regions receive higher ratings
-
How marketing impacts gross revenue
As a result, you can optimize location and campaign strategies effectively.
2️⃣ Event Name Analysis – Which Events Perform Best?
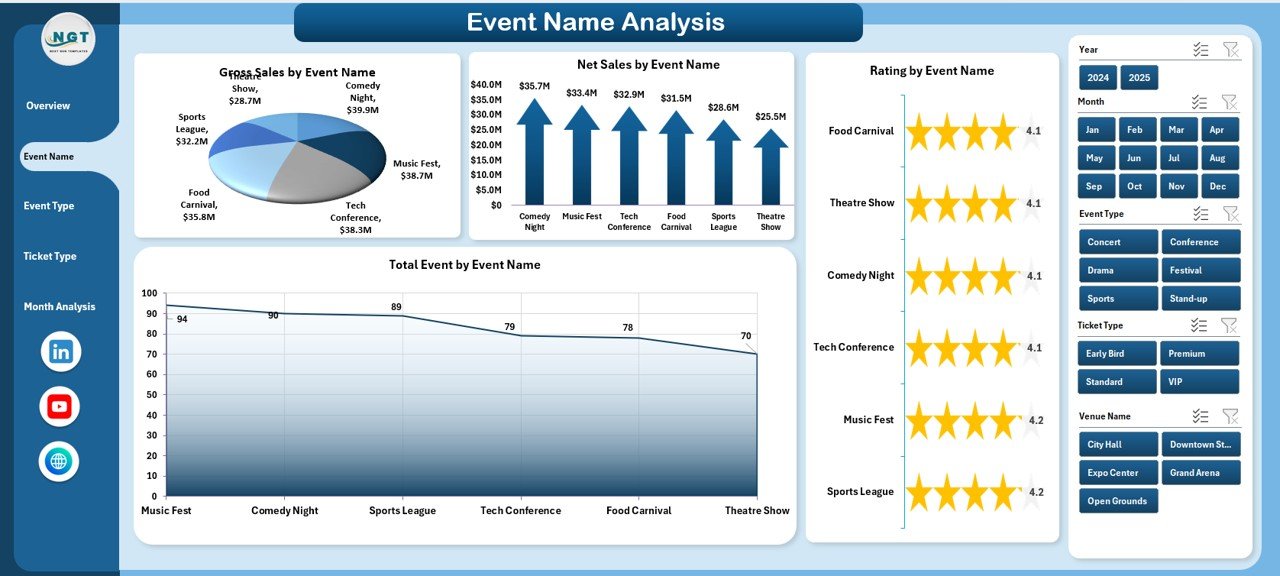
While the Overview gives a summary, the Event Name Analysis page dives deeper.
On the right side, you can use slicers to filter data by:
-
Month
-
City
-
Event Type
-
Ticket Type
4 Key Charts on This Page
-
Gross Sales by Event Name
-
Net Sales by Event Name
-
Rating by Event Name
-
Total Events by Event Name
Therefore, you can identify:
-
High-revenue events
-
Events with better customer ratings
-
Events that require marketing improvement
-
Events with lower profitability
For example, if one concert generates high gross sales but low net sales, you can analyze cost factors immediately.
Click to Purchases Ticketing and Live Events Dashboard in Excel
3️⃣ Event Type Analysis – Concert, Sports, Corporate & More
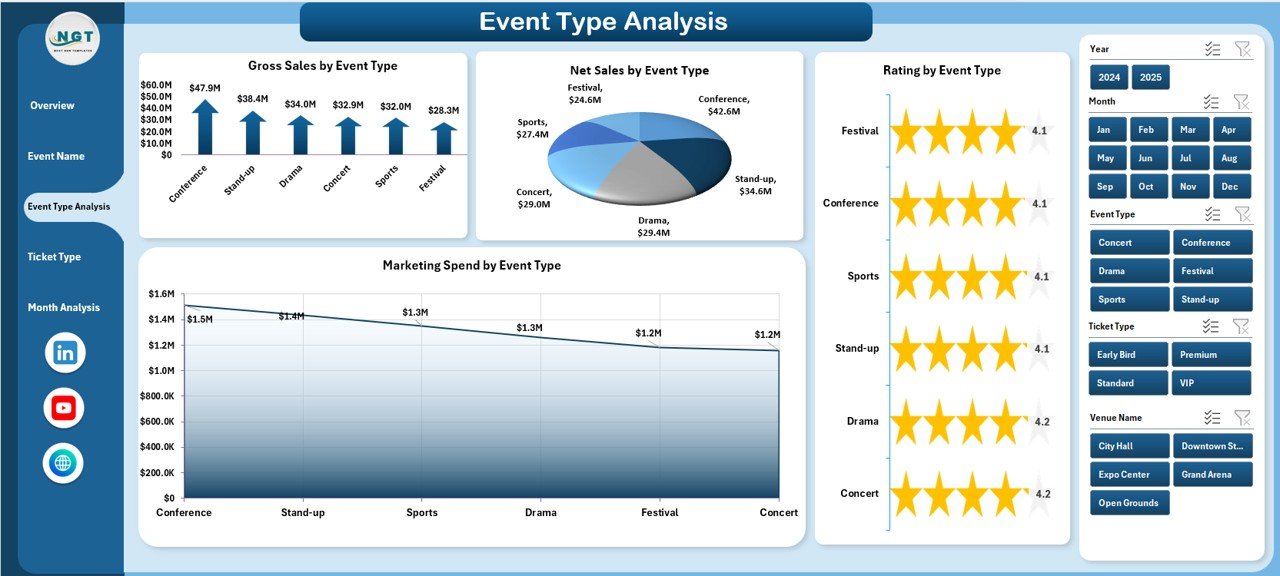
Different event types generate different revenue patterns.
Therefore, this page focuses on category-level performance.
4 Charts Included:
-
Gross Sales by Event Type
-
Net Sales by Event Type
-
Rating by Event Type
-
Marketing Spend by Event Type
Because of this structured layout, you can:
-
Compare concerts vs corporate events
-
Analyze marketing ROI by event type
-
Evaluate customer satisfaction trends
-
Allocate budget efficiently
As a result, you invest more in high-performing event categories.
4️⃣ Ticket Type Analysis – VIP vs Regular vs Early Bird
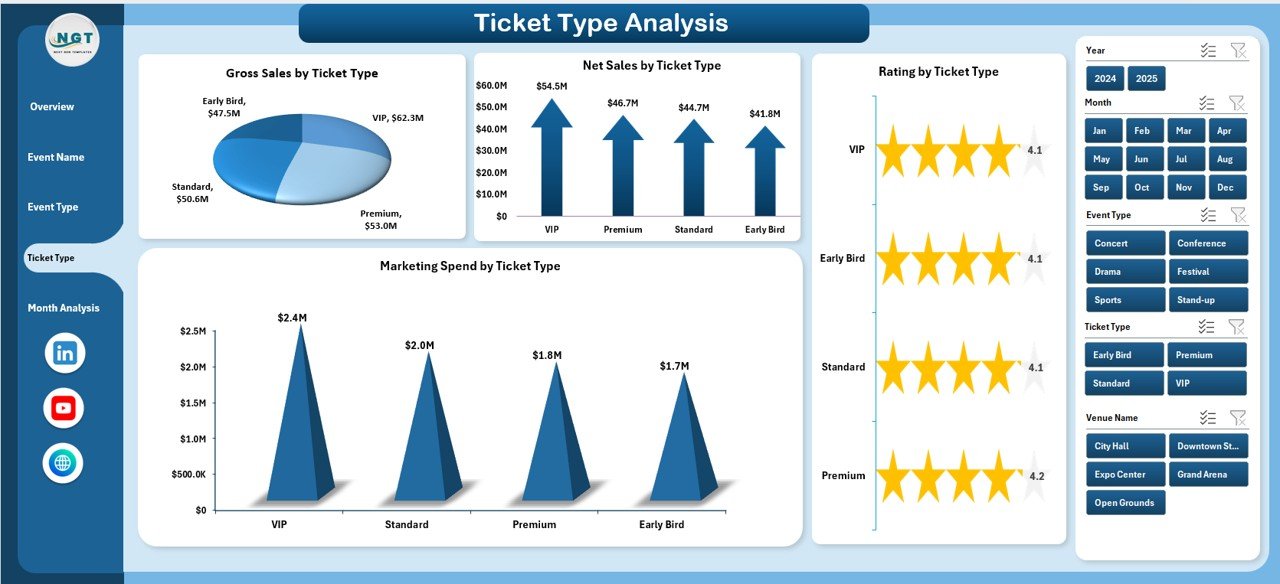
Ticket pricing strategy plays a critical role in profitability.
Therefore, the Ticket Type Analysis page helps you understand which ticket category drives revenue.
4 Charts Available:
-
Gross Sales by Ticket Type
-
Net Sales by Ticket Type
-
Rating by Ticket Type
-
Marketing Spend by Ticket Type
Using this page, you can:
-
Compare VIP vs General ticket performance
-
Evaluate early bird strategy effectiveness
-
Adjust pricing tiers
-
Optimize promotional campaigns
Consequently, you maximize revenue per event.
5️⃣ Month Analysis – Sales Trends Over Time
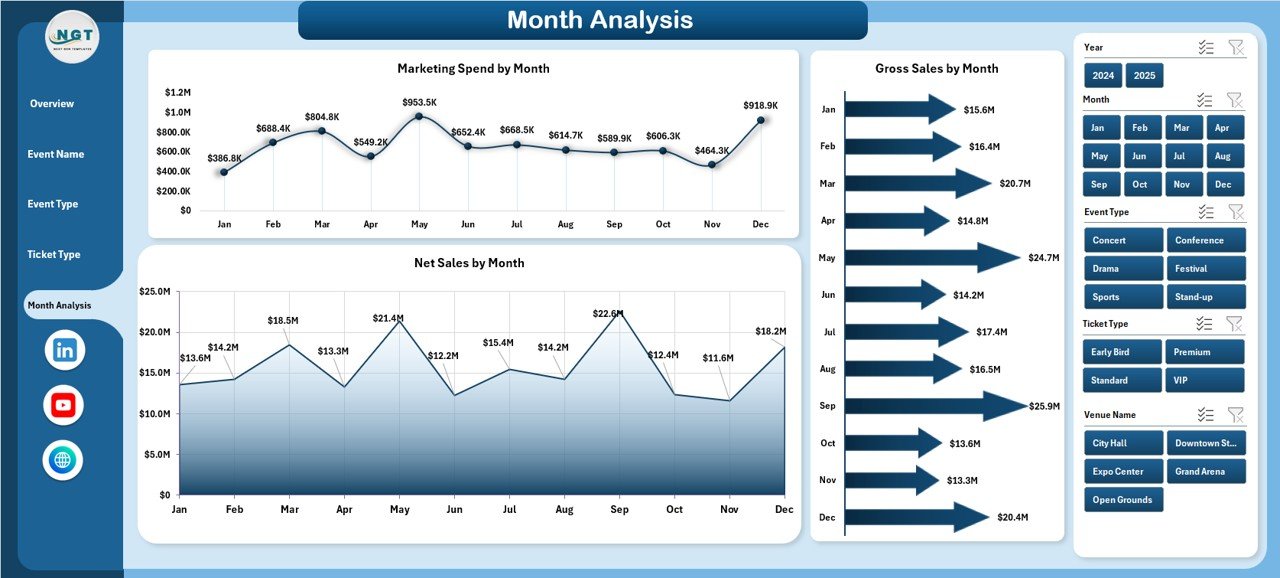
Monthly analysis helps you understand seasonality.
Therefore, the Month Analysis page focuses on time-based insights.
Charts Included:
-
Gross Sales by Month
-
Net Sales by Month
-
Marketing Spend by Month
Because this page shows trends clearly, you can:
-
Identify peak seasons
-
Prepare inventory in advance
-
Plan marketing before high-demand months
-
Control expenses during slow periods
As a result, your annual planning becomes strategic instead of reactive.
What Data Does the Data Sheet Include?
The Data Sheet stores structured event data such as:
-
Event Name
-
Event Type
-
Venue Name
-
City
-
Region
-
Ticket Type
-
Gross Sales
-
Net Sales
-
Marketing Spend
-
Rating
-
Event Date
-
Month
Because the dashboard uses structured tables, Pivot Tables update automatically when you add new records.
Therefore, the system remains scalable and flexible.
What Is the Role of the Support Sheet?
Click to Purchases Ticketing and Live Events Dashboard in Excel
The Support Sheet contains:
-
Helper calculations
-
Pivot table source ranges
-
Lookup tables
-
Calculated fields
This sheet ensures:
-
Smooth performance
-
Error-free formulas
-
Structured reporting
Thus, you maintain data accuracy at all times.
Key Metrics Included in the Ticketing and Live Events Dashboard in Excel
The dashboard tracks multiple KPIs, including:
-
Gross Sales
-
Net Sales
-
Marketing Spend
-
Average Rating
-
Sales by Venue
-
Sales by City
-
Sales by Event Type
-
Sales by Ticket Type
-
Monthly Sales Trends
Because these metrics cover revenue, cost, and performance, you gain complete business visibility.
Advantages of Ticketing and Live Events Dashboard in Excel
Now let’s explore the benefits.
1️⃣ Centralized Reporting
You see all event performance data in one file. Therefore, you save time and avoid confusion.
2️⃣ Better Revenue Management
You identify high-profit events instantly. As a result, you allocate resources more efficiently.
3️⃣ Improved Marketing Decisions
You track marketing spend against sales. Consequently, you optimize campaign budgets.
4️⃣ Data-Driven Ticket Pricing
You analyze ticket type contribution. Therefore, you adjust pricing smartly.
5️⃣ Enhanced Customer Insights
You monitor ratings by region and event type. Thus, you improve event quality.
6️⃣ Easy to Use
Because the dashboard runs in Excel, your team learns quickly without extra software.
Best Practices for the Ticketing and Live Events Dashboard in Excel
To get maximum value, follow these best practices.
✔ Maintain Clean Data
Always:
-
Remove duplicates
-
Standardize event names
-
Use consistent ticket categories
Clean data ensures accurate reporting.
✔ Update Data Regularly
Add new event records immediately after completion. Therefore, your dashboard remains up to date.
✔ Use Structured Tables
Convert your data range into an Excel Table. As a result, Pivot Tables update automatically.
✔ Analyze Monthly Trends
Review Month Analysis every month. Consequently, you identify patterns early.
✔ Compare Marketing ROI
Always compare marketing spend with net sales. This approach improves budget efficiency.
✔ Monitor Ratings Continuously
Customer satisfaction drives repeat attendance. Therefore, focus on improving low-rated events.
How Does This Dashboard Improve Business Decisions?
Because the dashboard combines revenue, cost, and ratings in one place, you:
-
Make faster decisions
-
Reduce manual reporting time
-
Improve profitability
-
Plan future events strategically
-
Increase operational efficiency
Moreover, Excel allows customization. Therefore, you can add new KPIs anytime.
Who Should Use the Ticketing and Live Events Dashboard in Excel?
This dashboard works perfectly for:
-
Event management companies
-
Concert organizers
-
Sports event planners
-
Corporate event managers
-
Exhibition organizers
-
Festival coordinators
If you sell tickets and manage live events, this dashboard fits your business.
Conclusion
The event industry changes rapidly. Therefore, you must track performance in real time.
The Ticketing and Live Events Dashboard in Excel gives you:
-
Complete revenue visibility
-
Detailed event analysis
-
Ticket category insights
-
Monthly trend tracking
-
Marketing performance monitoring
Instead of guessing, you make decisions based on data.
Consequently, you increase profitability, improve customer satisfaction, and scale your event business confidently.
Frequently Asked Questions (FAQs)
1️⃣ What is a Ticketing and Live Events Dashboard in Excel?
It is an interactive Excel dashboard that tracks ticket sales, revenue, marketing spend, and event performance in one structured file.
2️⃣ Can I customize this dashboard?
Yes. You can add new KPIs, event categories, and additional charts according to your business needs.
3️⃣ Does this dashboard require advanced Excel skills?
No. Basic knowledge of Excel, Pivot Tables, and slicers is enough to use it effectively.
4️⃣ How often should I update the data?
You should update the data after every event or at least monthly to maintain accuracy.
5️⃣ Can I use this dashboard for multiple cities?
Yes. The dashboard supports city and region-level analysis, so you can manage multi-location events easily.
Visit our YouTube channel to learn step-by-step video tutorials