Manufacturing leaders face constant pressure. Production targets rise. Material prices change. Labor costs increase. Meanwhile, customers demand higher quality and faster delivery.
Therefore, you must track profit, cost, and quality in real time. However, many tool rooms and die manufacturing units still rely on scattered spreadsheets. As a result, managers waste hours compiling reports. Moreover, they miss trends that directly impact profit.
So, how can you monitor your tool and die manufacturing performance in one place?
The answer is simple.
You need a Tool and Die Manufacturing Dashboard in Excel.
Click to Purchases Tool and Die Manufacturing Dashboard in Excel
In this detailed guide, you will learn:
-
What a Tool and Die Manufacturing Dashboard in Excel is
-
Why manufacturing units need it
-
A detailed explanation of all 5 dashboard pages
-
Advantages of Tool and Die Manufacturing Dashboard in Excel
-
Best practices for implementation
-
Frequently Asked Questions with answers
Let us explore everything step by step.
What Is a Tool and Die Manufacturing Dashboard in Excel?
A Tool and Die Manufacturing Dashboard in Excel is a ready-to-use, interactive reporting system designed for manufacturing units that produce tools, dies, molds, jigs, and fixtures.
It converts raw production data into meaningful visual insights. Instead of checking multiple sheets, managers get all performance metrics in one structured dashboard.
Moreover, this dashboard helps you monitor:
-
Profit Margin %
-
Labor Cost
-
Material Cost
-
Total Cost vs Revenue
-
Quality Rating
-
Performance by Tool Type, Die Type, Material Type, Industry Segment, and Month
Because the dashboard runs in Excel, you can easily update data, refresh pivot tables, and view instant results.
Why Do Tool and Die Manufacturing Companies Need a Dashboard?
Manufacturing involves multiple cost elements. Material cost affects margin. Labor cost impacts productivity. Quality rating influences customer satisfaction. Therefore, if you do not track these factors together, you cannot see the full picture.
Additionally:
-
Customers demand precision tools and high-quality dies.
-
Industry segments behave differently.
-
Material types impact cost and durability.
-
Tool types and die types require separate cost structures.
Hence, you need a centralized dashboard that connects all these elements.
A Tool and Die Manufacturing Dashboard in Excel solves this problem efficiently.
Key Features of the Tool and Die Manufacturing Dashboard in Excel
This dashboard includes a Page Navigator located on the left side. Therefore, users can easily move between analytical pages without confusion.
The dashboard contains 5 powerful analytical pages, along with support and data sheets.
Let us understand each page in detail.
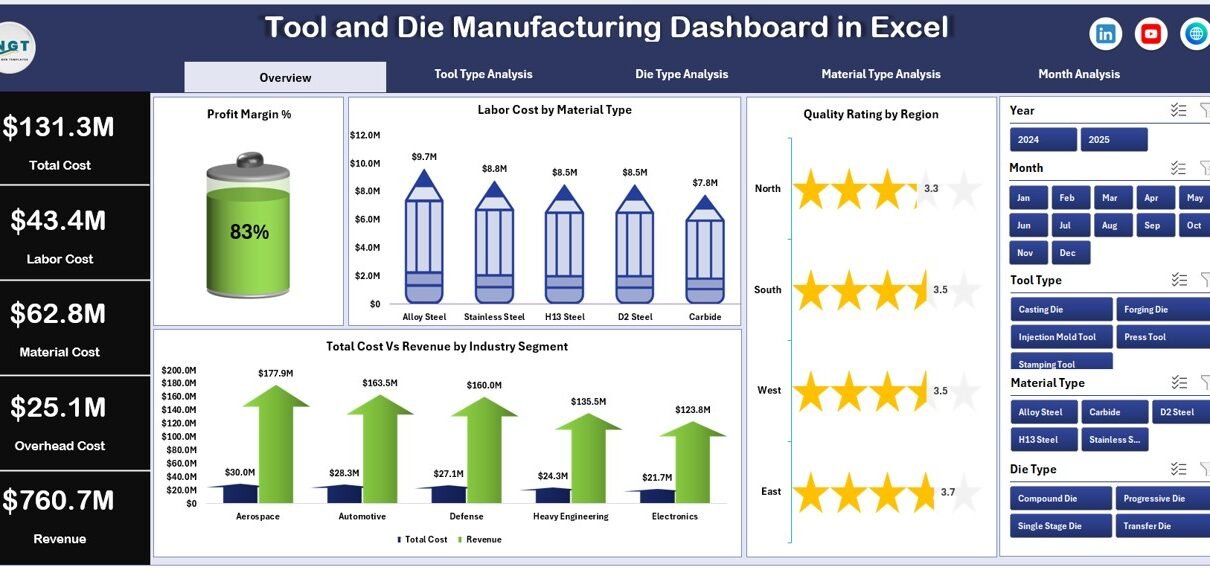
1️⃣ What Does the Overview Page Show?
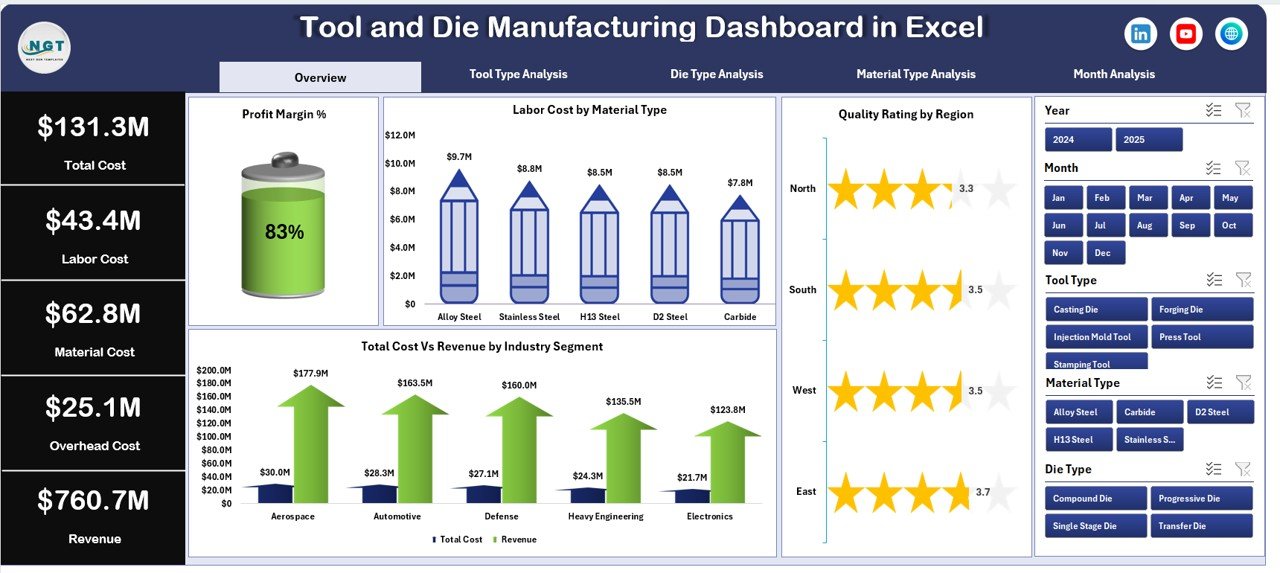
The Overview Page acts as the main control center of the dashboard.
Key Elements:
-
Right-side slicers (filters)
-
4 KPI cards
-
4 analytical charts
KPI Cards:
-
Profit Margin %
-
Labor Cost
-
Total Cost
-
Revenue
These cards immediately show the overall financial performance.
Charts Included:
-
Profit Margin %
-
Labor Cost by Material Type
-
Quality Rating by Region
-
Total Cost vs Revenue by Industry Segment
Why Is the Overview Page Important?
First, it gives a quick snapshot of business health.
Second, it highlights cost-heavy materials.
Third, it shows regional quality performance.
Finally, it reveals which industry segment generates better revenue.
Therefore, management can make faster decisions.
2️⃣ How Does Tool Type Analysis Help?
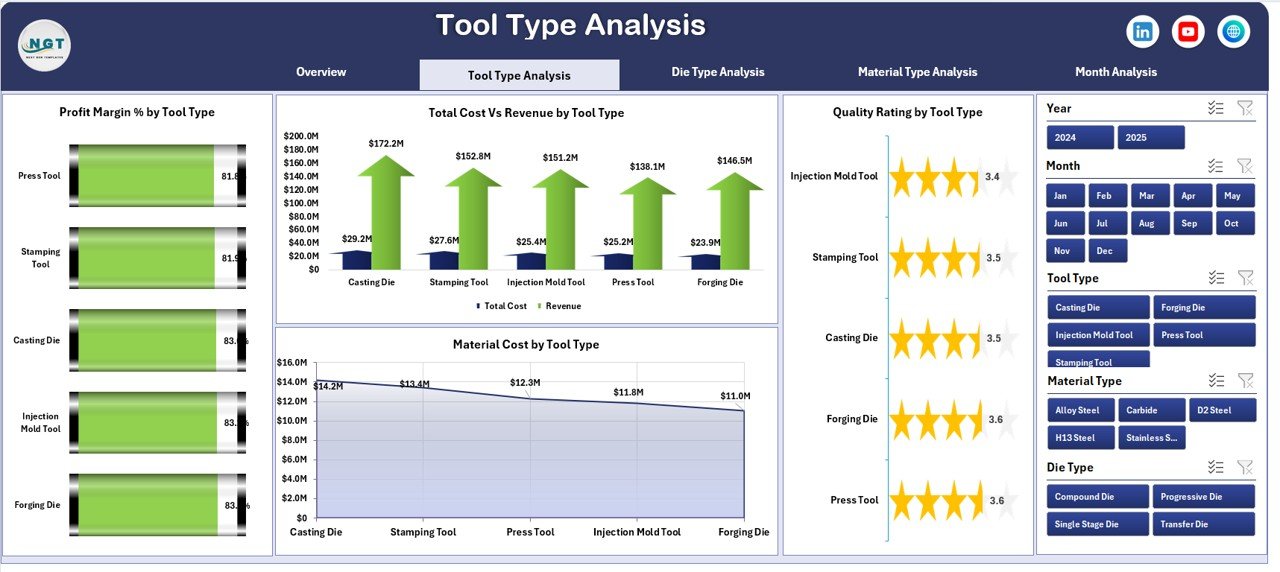
Different tool types carry different cost structures. Therefore, analyzing tool types separately becomes essential.
Charts Included:
-
Profit Margin % by Tool Type
-
Quality Rating by Tool Type
-
Total Cost vs Revenue by Tool Type
-
Material Cost by Tool Type
-
Click to Purchases Tool and Die Manufacturing Dashboard in Excel
What Insights Can You Get?
-
Which tool type generates the highest margin?
-
Which tool type consumes the most material?
-
Which tool type maintains better quality ratings?
-
Which tool type needs cost control?
As a result, production managers can adjust pricing or material sourcing strategies.
3️⃣ Why Is Die Type Analysis Important?
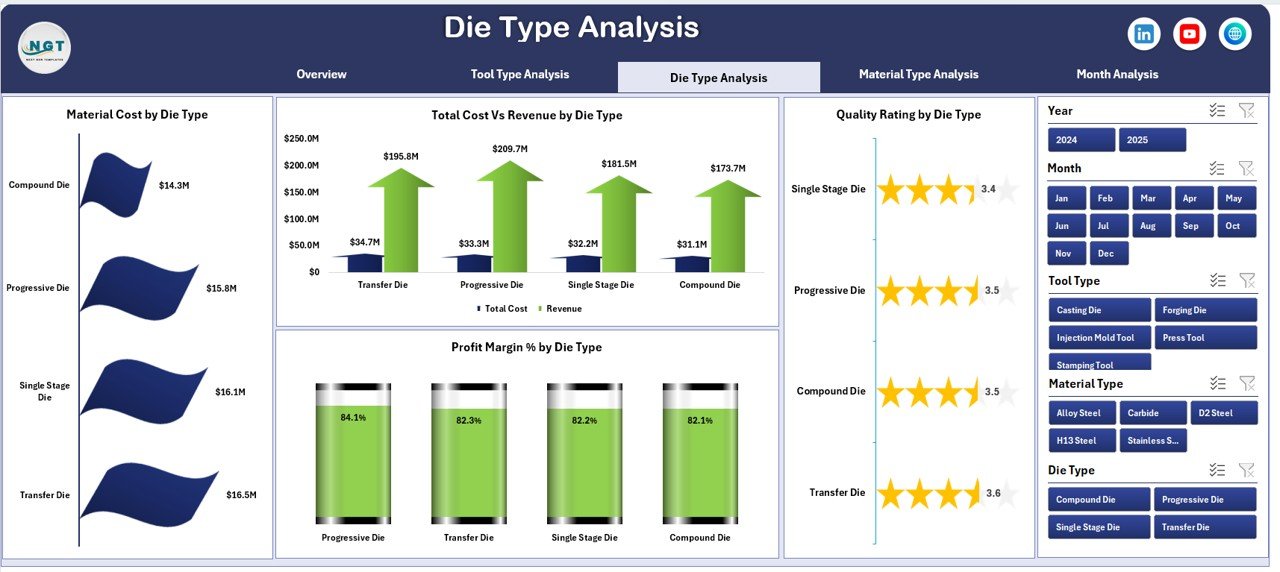
Die manufacturing often involves heavy machining and expensive materials. Therefore, die type analysis plays a critical role.
Charts Included:
-
Profit Margin % by Die Type
-
Quality Rating by Die Type
-
Total Cost vs Revenue by Die Type
-
Material Cost by Die Type
Key Benefits:
-
Compare progressive dies vs compound dies
-
Identify low-margin die types
-
Improve pricing strategy
-
Monitor quality trends
Thus, companies can focus on profitable die categories.
4️⃣ What Does Material Type Analysis Reveal?
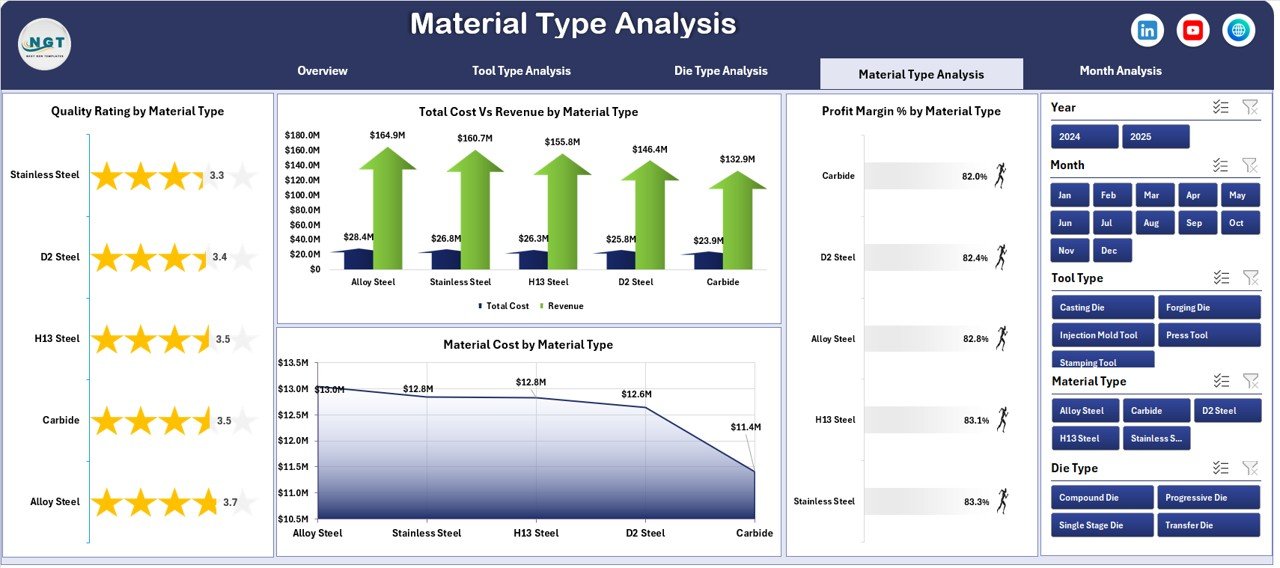
Material cost directly impacts profit margin. Therefore, tracking performance by material type becomes essential.
Charts Included:
-
Profit Margin % by Material Type
-
Quality Rating by Material Type
-
Total Cost vs Revenue by Material Type
-
Material Cost by Material Type
Practical Insights:
-
Which material increases production cost?
-
Which material delivers better quality ratings?
-
Does premium material justify higher pricing?
-
Which material requires cost negotiation?
Because material costs fluctuate, this page helps procurement and finance teams work together.
5️⃣ How Does Month Analysis Improve Planning?
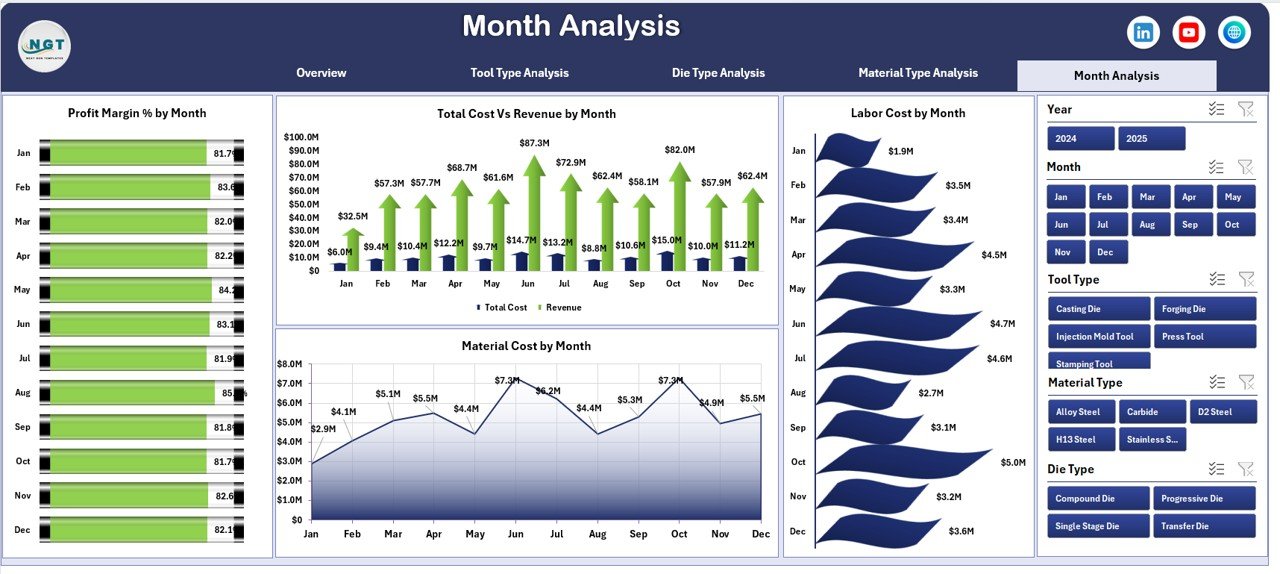
Monthly tracking allows trend analysis. Therefore, managers can monitor seasonality and cost fluctuations.
Charts Included:
-
Profit Margin % by Month
-
Total Cost vs Revenue by Month
-
Material Cost by Month
-
Labor Cost by Month
Why Monthly Analysis Matters:
-
Identify cost spikes
-
Detect seasonal demand patterns
-
Improve budgeting accuracy
-
Control labor overtime
Hence, management can plan production more efficiently.
Support Sheet and Data Sheet
Click to Purchases Tool and Die Manufacturing Dashboard in Excel
Support Sheet
The Support Sheet stores:
-
Master lists (Tool Types, Die Types, Material Types, Regions, Industry Segments)
-
Dropdown sources for slicers
-
Calculation formulas
Therefore, it ensures structured data handling.
Data Sheet
The Data Sheet contains raw transactional data such as:
-
Date
-
Tool Type
-
Die Type
-
Material Type
-
Region
-
Industry Segment
-
Labor Cost
-
Material Cost
-
Total Cost
-
Revenue
-
Quality Rating
-
Profit Margin %
Once you update this sheet, pivot tables refresh automatically.
Advantages of Tool and Die Manufacturing Dashboard in Excel
Now let us explore why this dashboard benefits manufacturing businesses.
1️⃣ Real-Time Performance Monitoring
You can instantly see cost, revenue, and margin changes. Therefore, you reduce reporting delays.
2️⃣ Better Cost Control
You track material and labor cost separately. As a result, you identify cost-heavy components quickly.
3️⃣ Improved Decision-Making
Because charts display trends visually, managers make faster decisions.
4️⃣ Enhanced Profit Tracking
You monitor profit margin across tool types, die types, and material types. Therefore, you focus on high-margin categories.
5️⃣ Quality Performance Tracking
You track quality rating by region and product category. Consequently, you improve customer satisfaction.
6️⃣ Easy Navigation
The left-side page navigator ensures smooth movement across pages.
7️⃣ Excel-Based Flexibility
Most manufacturing teams already use Excel. Therefore, adoption becomes easy.
Best Practices for the Tool and Die Manufacturing Dashboard in Excel
To maximize benefits, follow these best practices.
1️⃣ Maintain Clean Data
Always remove duplicate entries. Moreover, use consistent naming for tool types and material types.
2️⃣ Update Data Regularly
Update the Data Sheet daily or weekly. Therefore, reports remain accurate.
3️⃣ Use Standard Cost Codes
Define cost codes clearly. As a result, financial tracking becomes easier.
4️⃣ Monitor Low Margin Categories
If margin drops below target, investigate immediately.
5️⃣ Compare Actual vs Target
Set profit margin targets and compare monthly performance.
6️⃣ Review Quality Ratings Frequently
If quality rating drops, analyze material or labor issues.
7️⃣ Protect Formula Cells
Lock calculation cells to avoid accidental changes.
How Can This Dashboard Improve Manufacturing Efficiency?
This dashboard connects finance, production, and quality departments.
Because it shows integrated data:
-
Production managers control cost.
-
Finance teams monitor margin.
-
Quality teams track performance.
-
Sales teams analyze industry segments.
Therefore, cross-functional coordination improves significantly.
Who Should Use This Dashboard?
This dashboard works best for:
-
Tool manufacturing units
-
Die manufacturing companies
-
Mold production businesses
-
Industrial component manufacturers
-
CNC machine shops
-
Manufacturing consultants
If you run any of these businesses, this dashboard will simplify performance tracking.
How Does This Dashboard Help Increase Profit?
Click to Purchases Tool and Die Manufacturing Dashboard in Excel
First, it highlights low-margin categories.
Second, it shows cost-heavy materials.
Third, it tracks monthly cost trends.
Finally, it reveals high-performing industry segments.
Therefore, management can adjust pricing, reduce cost, and increase profitability.
Conclusion
Tool and die manufacturing requires precision, cost control, and quality consistency. However, manual reporting slows down decision-making.
Therefore, companies must adopt structured analytics.
The Tool and Die Manufacturing Dashboard in Excel provides:
-
Clear financial tracking
-
Detailed cost analysis
-
Quality performance insights
-
Monthly trend monitoring
-
Easy navigation across pages
Because it integrates all critical metrics in one system, it transforms how manufacturing businesses track performance.
If you want smarter decisions and higher profit margins, this dashboard becomes a powerful solution.
Frequently Asked Questions (FAQs)
1️⃣ What is a Tool and Die Manufacturing Dashboard in Excel?
It is an Excel-based analytical dashboard that tracks cost, revenue, profit margin, and quality metrics for tool and die manufacturing units.
2️⃣ Can I customize this dashboard?
Yes, you can modify tool types, die types, and material categories based on your business needs.
3️⃣ Do I need advanced Excel skills to use it?
No. You only need basic Excel knowledge to update data and use slicers.
4️⃣ How often should I update the data?
You should update data weekly or monthly, depending on production volume.
5️⃣ Does the dashboard support pivot charts?
Yes. The dashboard uses pivot tables and pivot charts for dynamic analysis.
6️⃣ Can this dashboard help reduce manufacturing cost?
Yes. It identifies cost-heavy materials and low-margin categories. Therefore, you can take corrective actions.
7️⃣ Is this dashboard suitable for small manufacturing units?
Yes. Both small and medium manufacturing companies can use it effectively.
Visit our YouTube channel to learn step-by-step video tutorials