The toy and games industry thrives on creativity, trends, and seasonal demand. However, without clear data visibility, even the most innovative toy businesses struggle to grow. That is exactly where a Toy and Games Industry Dashboard in Power BI becomes a game-changer.
This article explains what a Toy and Games Industry Dashboard in Power BI is, why it matters, how it works, and how each dashboard page supports smarter decisions. Moreover, you will learn about its advantages, best practices, and frequently asked questions. By the end, you will clearly understand how this dashboard helps toy manufacturers, distributors, and retailers turn raw sales data into actionable insights.
Click to Purchases Toy and Games Industry Dashboard in Power BI
What Is a Toy and Games Industry Dashboard in Power BI?
A Toy and Games Industry Dashboard in Power BI is an interactive analytics solution designed to track, analyze, and visualize sales, profit, discounts, and performance trends across the toy and gaming business.
Instead of relying on static Excel reports or manual analysis, this dashboard brings all critical metrics into one centralized Power BI file. As a result, decision-makers gain real-time visibility into business performance.
Moreover, Power BI allows users to slice and filter data dynamically. Therefore, teams can instantly analyze performance by product category, brand, sales channel, region, customer type, store, and month.
Why Does the Toy and Games Industry Need a Power BI Dashboard?
The toy and games market changes rapidly. New products launch frequently, customer preferences shift quickly, and seasonal demand plays a major role. Because of this, businesses must respond faster than ever.
A Toy and Games Industry Dashboard in Power BI helps because:
-
It consolidates data from multiple sources
-
It highlights profitable and underperforming products
-
It tracks discounts and margins clearly
-
It supports faster and smarter decisions
Most importantly, it eliminates guesswork and replaces it with data-driven insights.
How Does a Toy and Games Industry Dashboard in Power BI Work?
The dashboard connects to structured sales data, usually stored in Excel or databases. Once connected, Power BI transforms raw data into interactive visuals.
Users can then:
-
Apply slicers to filter data
-
Compare performance across dimensions
-
Identify trends over time
-
Drill down into details instantly
Because Power BI updates visuals automatically, users only need to refresh the data. Therefore, reports always stay up to date.
What Are the Key Pages in a Toy and Games Industry Dashboard in Power BI?
This dashboard includes five powerful pages, each designed for a specific type of analysis. Let us explore each page in detail.
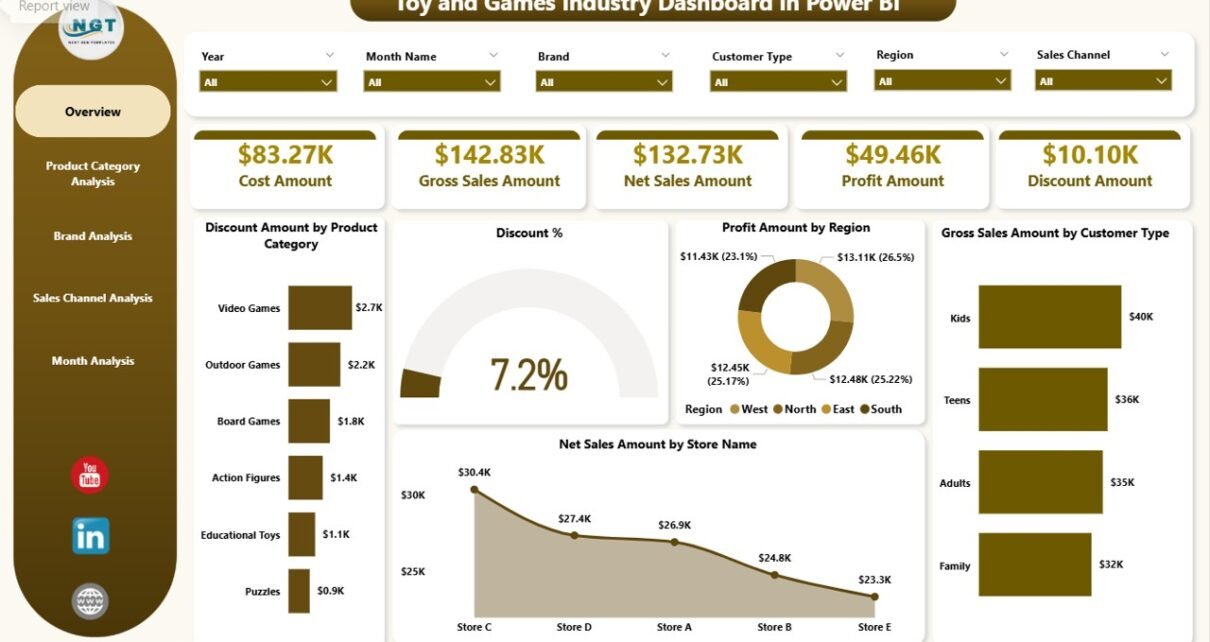
Overview Page: How Do You Get a Complete Business Snapshot?
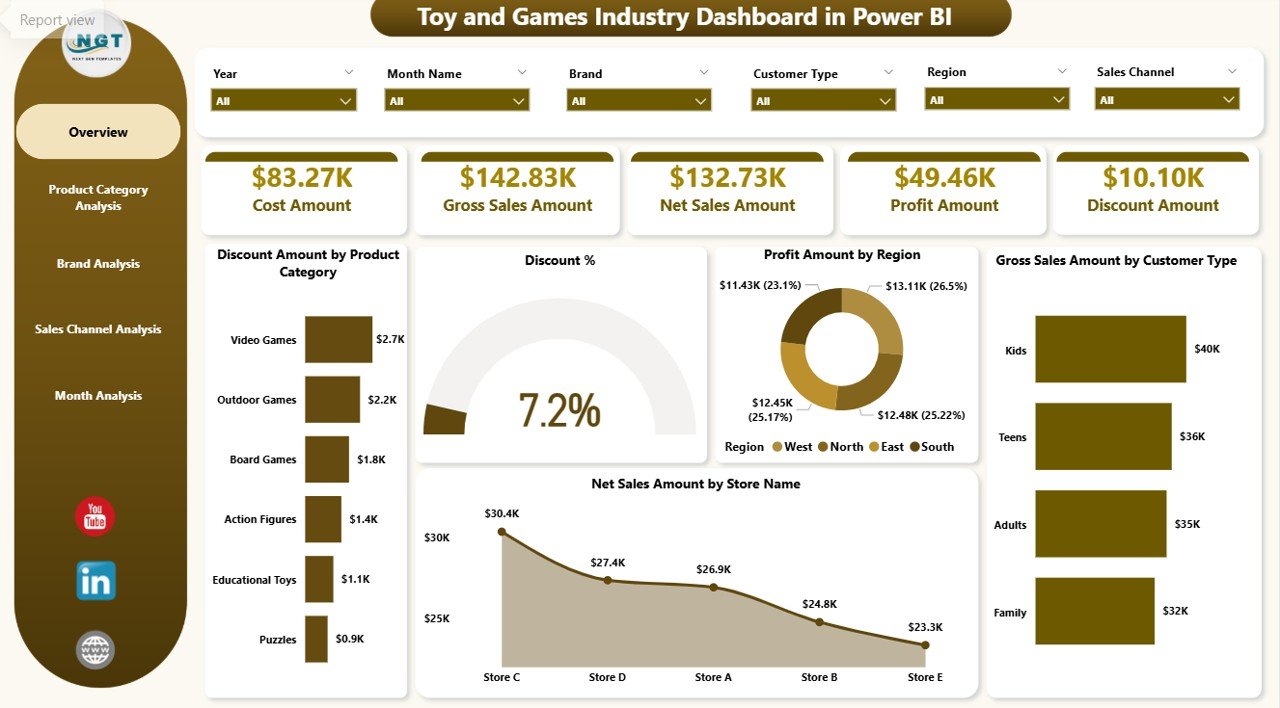
The Overview Page acts as the control center of the dashboard. It provides a high-level snapshot of overall business performance.
Key Features of the Overview Page
-
Interactive slicers for quick filtering
-
KPI cards for instant insights
-
Summary visuals for sales, profit, and discounts
Key Metrics Displayed
Click to Purchases Toy and Games Industry Dashboard in Power BI
-
Discount Amount by Product Category
-
Discount Percentage
-
Profit Amount by Region
-
Gross Sales Amount by Customer Type
-
Net Sales Amount by Store Name
Because this page highlights critical KPIs, leadership teams can quickly assess performance. Moreover, they can identify problem areas without digging into raw data.
Product Category Analysis: Which Categories Drive the Most Revenue?
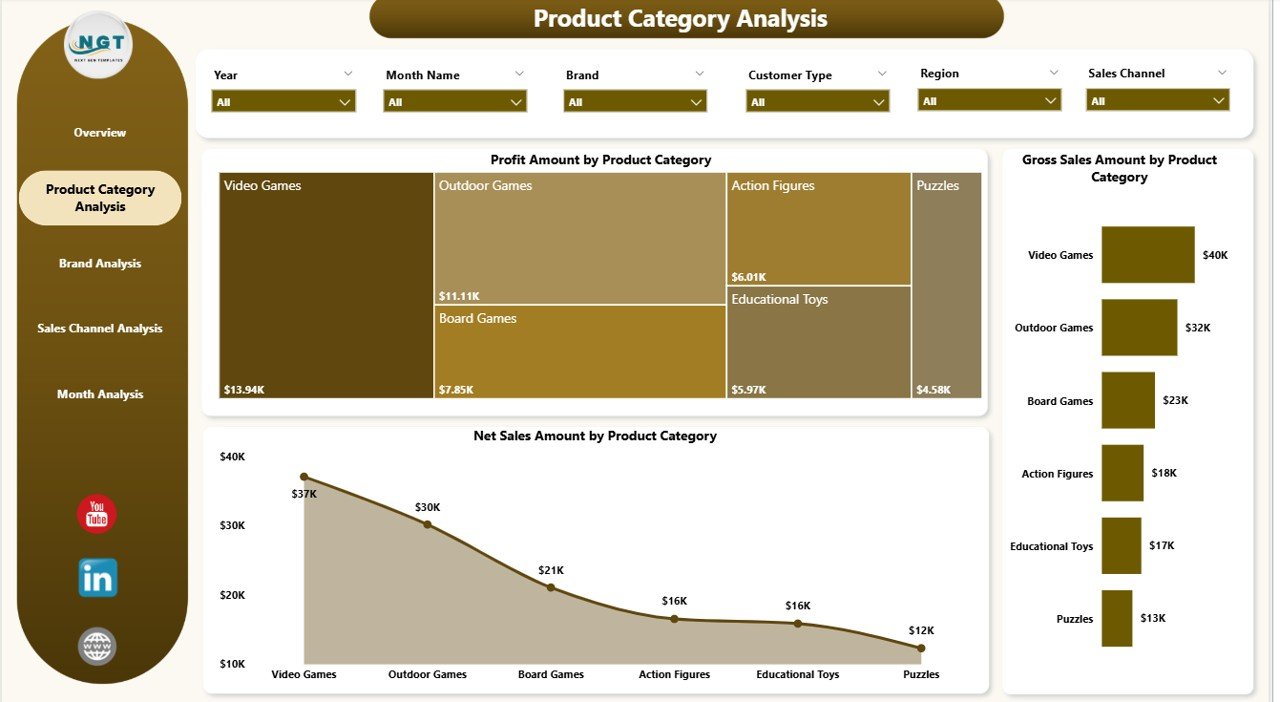
The Product Category Analysis Page focuses on understanding performance across different toy and game categories.
Why This Page Matters
Toy businesses often manage multiple categories such as educational toys, action figures, board games, puzzles, and electronic games. Therefore, category-level insights become essential.
Key Charts on This Page
-
Profit Amount by Product Category
-
Gross Sales Amount by Product Category
-
Net Sales Amount by Product Category
With slicers in place, users can instantly compare categories. As a result, they can identify high-performing categories and optimize inventory and promotions.
Brand Analysis: Which Brands Perform the Best?
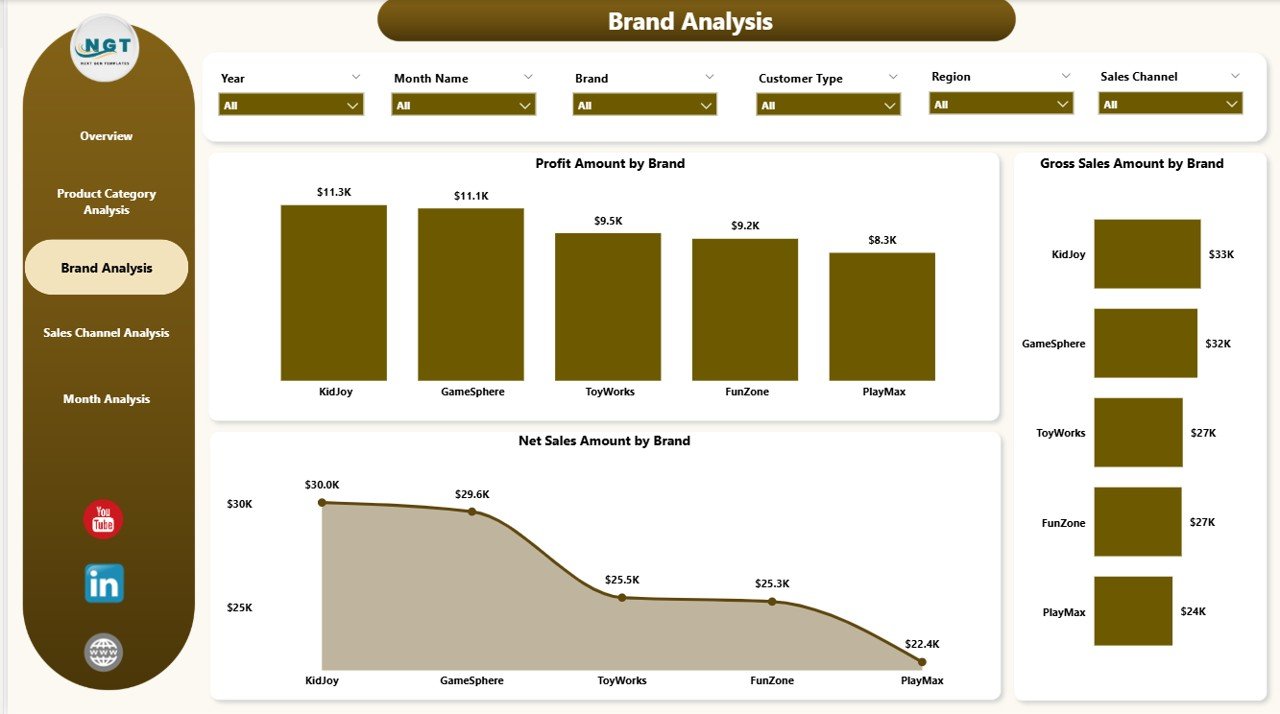
The Brand Analysis Page helps businesses evaluate brand-level performance.
Why Brand Analysis Is Important
In the toy and games industry, brand loyalty plays a major role. Some brands generate consistent revenue, while others fluctuate.
Key Charts on This Page
-
Profit Amount by Brand
-
Gross Sales Amount by Brand
-
Net Sales Amount by Brand
Because this page highlights brand contribution, businesses can focus marketing efforts on high-performing brands. Additionally, they can renegotiate supplier terms for underperforming brands.
Sales Channel Analysis: Which Channels Deliver Maximum Profit?
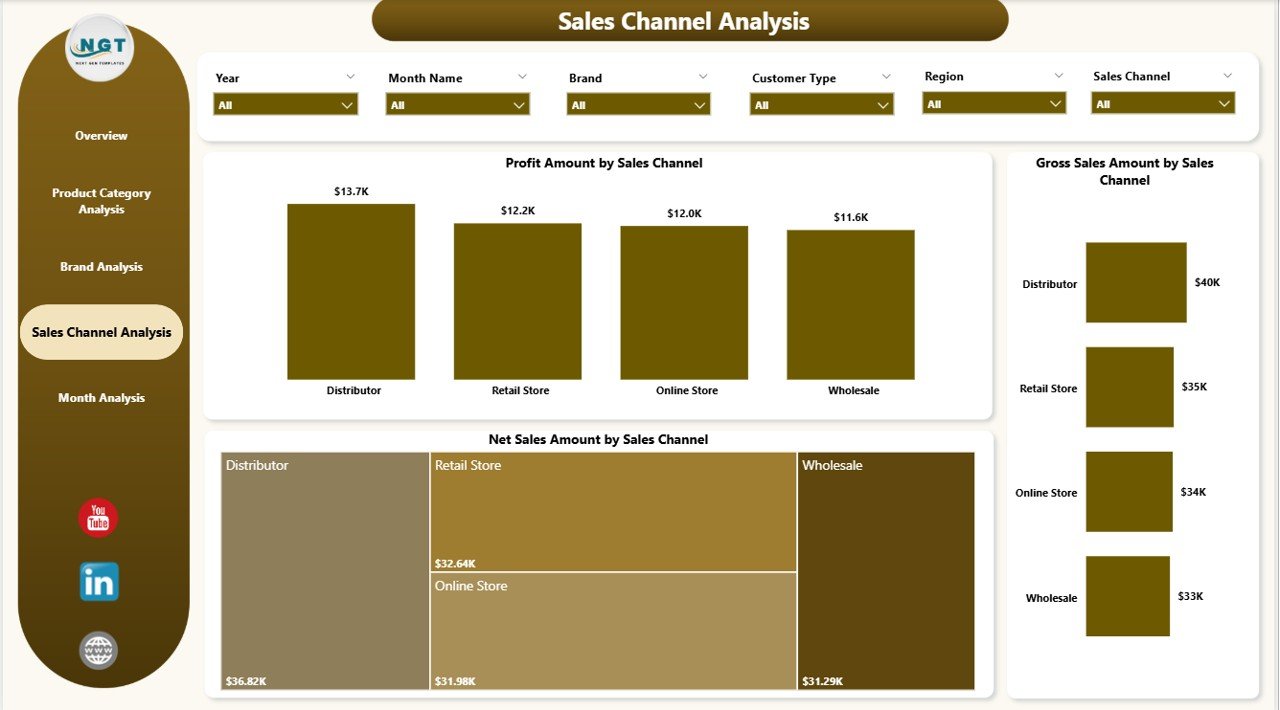
The Sales Channel Analysis Page evaluates performance across different sales channels.
Common Sales Channels
-
Online marketplaces
-
Retail stores
-
Distributors
-
Direct-to-consumer platforms
Key Charts on This Page
-
Profit Amount by Sales Channel
-
Gross Sales Amount by Sales Channel
-
Net Sales Amount by Sales Channel
-
Click to Purchases Toy and Games Industry Dashboard in Power BI
This page helps businesses understand where revenue truly comes from. Therefore, teams can invest more in profitable channels and optimize weaker ones.
Month Analysis: How Does Performance Change Over Time?
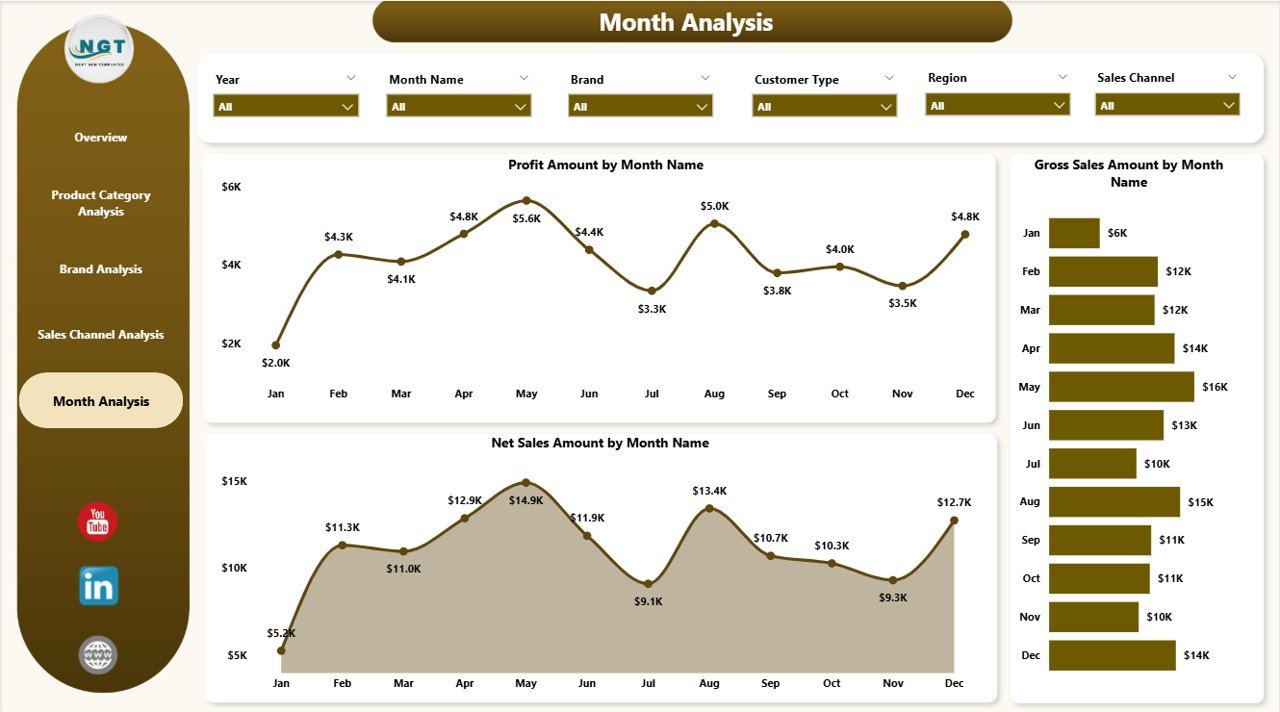
The Month Analysis Page focuses on time-based trends.
Why Month Analysis Matters
The toy and games industry experiences strong seasonality. Sales often spike during holidays, festivals, and school vacations.
Key Charts on This Page
-
Profit Amount by Month
-
Gross Sales Amount by Month
-
Net Sales Amount by Month
With this analysis, businesses can plan inventory, staffing, and promotions more effectively.
What Types of Insights Can You Get from This Dashboard?
A Toy and Games Industry Dashboard in Power BI delivers multiple actionable insights, such as:
-
Identifying top-selling product categories
-
Tracking discount impact on profitability
-
Comparing performance across regions
-
Understanding customer buying behavior
-
Monitoring seasonal sales trends
Because of these insights, businesses can make confident decisions backed by data.
Advantages of Toy and Games Industry Dashboard in Power BI
Using a Toy and Games Industry Dashboard in Power BI offers several advantages.
1. Centralized Data Visibility
All key metrics appear in one dashboard. Therefore, teams save time and avoid confusion.
2. Real-Time Decision Making
With refreshed data, decisions rely on current information, not outdated reports.
3. Interactive and User-Friendly
Slicers and visuals make analysis easy, even for non-technical users.
4. Better Profitability Tracking
The dashboard highlights profit, discounts, and margins clearly.
5. Improved Strategic Planning
Time-based and category-based insights support long-term planning.
How Does This Dashboard Support Different Stakeholders?
Click to Purchases Toy and Games Industry Dashboard in Power BI
Different teams benefit in different ways.
For Management
-
Quick performance overview
-
Data-driven strategy decisions
For Sales Teams
-
Channel and customer insights
-
Better sales targeting
For Finance Teams
-
Profit and discount monitoring
-
Margin optimization
For Marketing Teams
-
Brand and category performance
-
Campaign effectiveness analysis
Best Practices for the Toy and Games Industry Dashboard in Power BI
To maximize the value of this dashboard, follow these best practices.
1. Maintain Clean and Structured Data
Ensure consistent naming for products, brands, and categories.
2. Use Meaningful Slicers
Add slicers that users actually need, such as month, region, and category.
3. Focus on Business-Relevant KPIs
Avoid clutter. Always highlight metrics that drive decisions.
4. Refresh Data Regularly
Schedule frequent data refreshes to keep insights accurate.
5. Keep Visuals Simple
Use clear charts and avoid unnecessary complexity.
Click to Purchases Toy and Games Industry Dashboard in Power BI
How Does Power BI Improve Reporting Compared to Excel Alone?
Although Excel works well for data storage, Power BI enhances reporting significantly.
-
Power BI offers interactive visuals
-
Power BI handles large datasets efficiently
-
Power BI supports real-time filtering
-
Power BI improves storytelling with data
Therefore, combining Excel with Power BI creates a powerful reporting solution.
Who Should Use a Toy and Games Industry Dashboard in Power BI?
This dashboard suits:
-
Toy manufacturers
-
Game publishers
-
Retail chains
-
E-commerce sellers
-
Distributors and wholesalers
Any organization that deals with toy and game sales data can benefit.
Conclusion: Why Is a Toy and Games Industry Dashboard in Power BI Essential?
A Toy and Games Industry Dashboard in Power BI transforms complex sales data into clear, actionable insights. It empowers businesses to understand performance, optimize profitability, and respond quickly to market changes.
Because the dashboard covers overview, product categories, brands, sales channels, and monthly trends, it supports decisions at every level. Most importantly, it replaces manual reporting with smart, visual analytics.
Frequently Asked Questions (FAQs)
What is a Toy and Games Industry Dashboard in Power BI used for?
It tracks sales, profit, discounts, and trends across products, brands, channels, and time.
Can non-technical users use this dashboard easily?
Yes. The dashboard uses intuitive visuals and slicers, making it user-friendly.
Does this dashboard support seasonal analysis?
Yes. The Month Analysis page highlights seasonal trends clearly.
Can this dashboard connect to Excel data?
Yes. Power BI integrates seamlessly with Excel files.
Is this dashboard customizable?
Yes. You can add KPIs, charts, and slicers based on business needs.
Visit our YouTube channel to learn step-by-step video tutorials