Trade associations play an important role in supporting businesses, industries, and professional communities. They represent member interests, organize events, influence policies, and promote industry growth. However, managing the performance of such organizations can become complex because they handle large volumes of operational, financial, and membership-related data.
Therefore, organizations need a powerful system to monitor performance metrics and track progress toward strategic goals.
A Trade Associations KPI Dashboard in Power BI solves this problem by transforming raw operational data into clear visual insights. It helps leadership teams, analysts, and managers monitor key performance indicators (KPIs) efficiently.
In this article, we will explore what a Trade Associations KPI Dashboard in Power BI is, how it works, its structure, advantages, best practices, and frequently asked questions.
Click to buy Trade Associations KPI Dashboard in Power BI
What is a Trade Associations KPI Dashboard in Power BI?
A Trade Associations KPI Dashboard in Power BI is a data visualization and performance monitoring tool designed to track important metrics related to association operations.
This dashboard collects KPI data from Excel and presents it through interactive charts, tables, and visual indicators. As a result, decision-makers can easily track performance, analyze trends, and identify improvement opportunities.
Moreover, the dashboard enables organizations to monitor:
- Membership growth
- Financial performance
- Event participation
- Industry engagement
- Operational efficiency
Because the dashboard uses Power BI’s interactive features, users can quickly filter data by month, KPI group, or KPI name.
Consequently, organizations gain faster insights and better control over their strategic initiatives.
Why Do Trade Associations Need KPI Dashboards?
Trade associations manage multiple programs and initiatives. Without proper monitoring tools, leaders struggle to evaluate performance.
However, a KPI dashboard simplifies performance management.
Key reasons organizations use KPI dashboards
- Monitor organizational performance in real time
- Compare actual performance with targets
- Analyze trends across months and years
- Identify underperforming KPIs quickly
- Improve strategic decision-making
Additionally, dashboards reduce the need for manual reports. Instead of analyzing multiple spreadsheets, managers can review performance from one centralized view.
Therefore, organizations save time while improving transparency and accountability.
Overview of the Trade Associations KPI Dashboard in Power BI
The Trade Associations KPI Dashboard is a ready-to-use Power BI solution that uses Excel as its data source.
Users only need to enter KPI data in Excel sheets. After that, Power BI automatically updates the visual reports.
This dashboard contains three main pages that provide detailed KPI insights.
These pages include:
- Summary Page
- KPI Trend Page
- KPI Definition Page
Each page serves a specific purpose and together they provide a complete performance analysis system.
Click to buy Trade Associations KPI Dashboard in Power BI
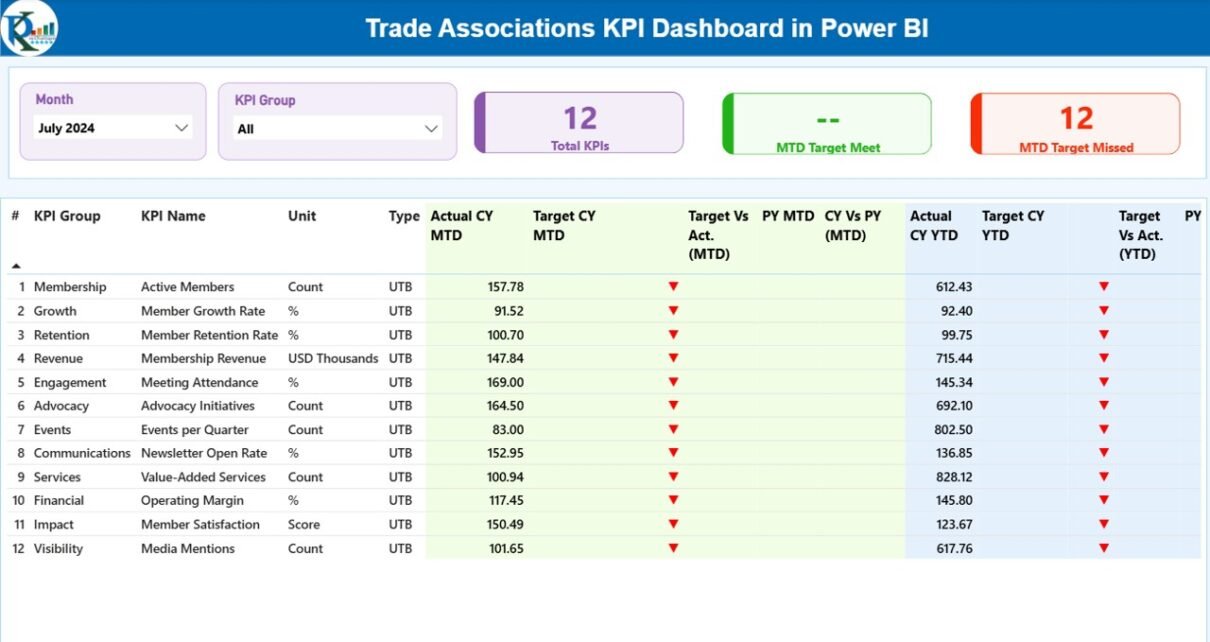
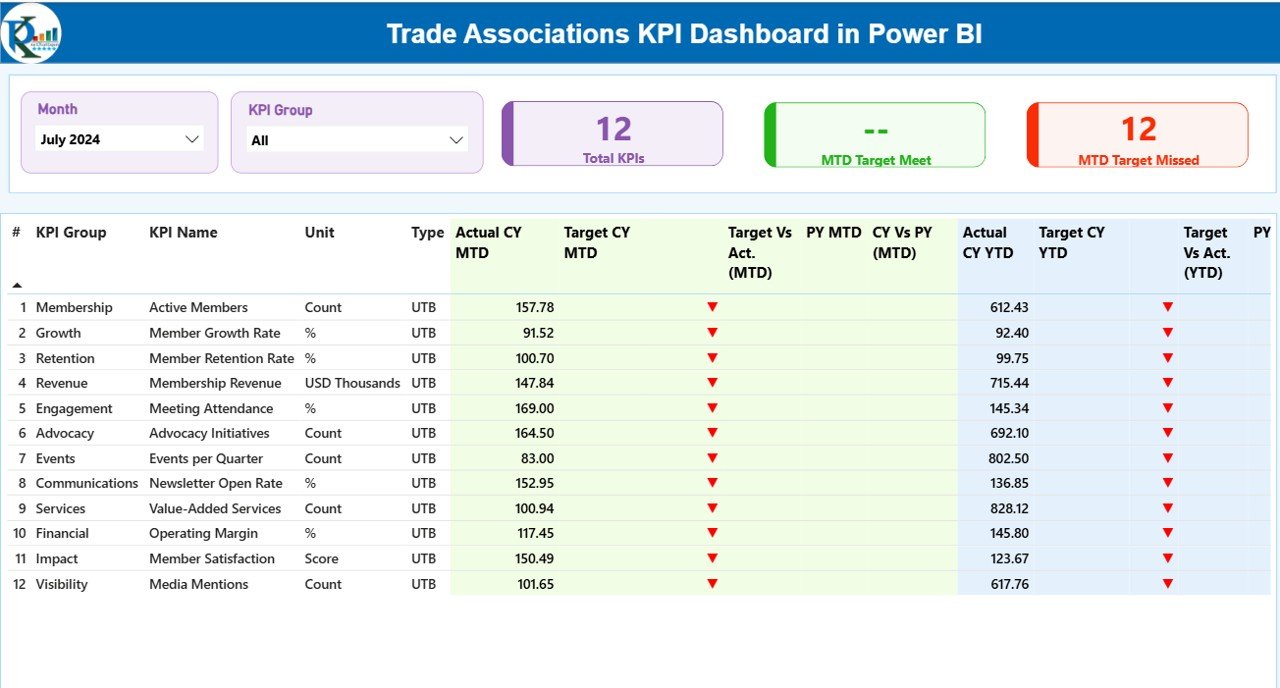
Summary Page – Main Performance Overview
The Summary Page acts as the central monitoring interface of the dashboard.
First, users see two important slicers at the top of the dashboard:
- Month Slicer
- KPI Group Slicer
These slicers allow users to filter KPI performance dynamically.
As a result, users can instantly analyze performance for specific time periods or KPI categories.
KPI Performance Cards
The dashboard displays three KPI cards that provide quick insights:
- Total KPIs Count – Shows the total number of KPIs tracked
- MTD Target Meet Count – Shows how many KPIs met the monthly target
- MTD Target Missed Count – Shows how many KPIs failed to meet targets
Because these cards update dynamically, decision-makers can immediately understand the organization’s performance status.
Detailed KPI Table
Below the KPI cards, the dashboard displays a detailed KPI table.
This table provides a comprehensive view of all KPI metrics.
KPI Table Fields
The table includes the following columns:
KPI Number
- This field represents the sequence number assigned to each KPI.
KPI Group
- This field categorizes KPIs into different groups or business areas.
KPI Name
- This field shows the specific KPI title.
Unit
- This column represents the measurement unit for the KPI.
Examples include:
- Percentage
- Count
- Revenue
- Number of members
Type
This field defines the KPI evaluation method:
- UTB (Upper the Better) – Higher values indicate better performance
- LTB (Lower the Better) – Lower values indicate better performance
Monthly KPI Performance Metrics
The dashboard also tracks monthly KPI performance using the following metrics.
Actual CY MTD
This field displays the Actual Current Year Month-to-Date value for the KPI.
Target CY MTD
This field shows the Target Current Year Month-to-Date value.
MTD Icon
The dashboard displays visual indicators:
- ▲ Green arrow → KPI performing well
- ▼ Red arrow → KPI below target
Therefore, users can quickly understand KPI performance without analyzing numbers.
Target vs Actual (MTD)
This metric compares actual performance against targets.
Formula used:
Actual MTD / Target MTD
This percentage shows how close the organization is to achieving its monthly goals.
Previous Year Comparison
Comparing performance with previous years helps organizations measure growth.
PY MTD
This field shows Previous Year Month-to-Date performance.
CY vs PY (MTD)
This metric compares current year performance with last year.
Formula used:
Current Year MTD / Previous Year MTD
As a result, organizations can evaluate progress over time.
Year-to-Date KPI Analysis
The dashboard also tracks Year-to-Date performance.
Actual CY YTD
Shows the Current Year YTD actual value.
Target CY YTD
Displays the Current Year YTD target value.
YTD Icon
The dashboard shows visual indicators for YTD performance:
- Green arrow → Target achieved
- Red arrow → Target missed
Target vs Actual (YTD)
This metric compares YTD actual performance against targets.
Formula used:
Actual YTD / Target YTD
YTD Previous Year Comparison
The dashboard also tracks historical performance.
PY YTD
Shows the Previous Year YTD value.
CY vs PY (YTD)
This metric compares current year YTD performance with previous year results.
Formula used:
Current Year YTD / Previous Year YTD
Consequently, organizations can identify long-term growth patterns.
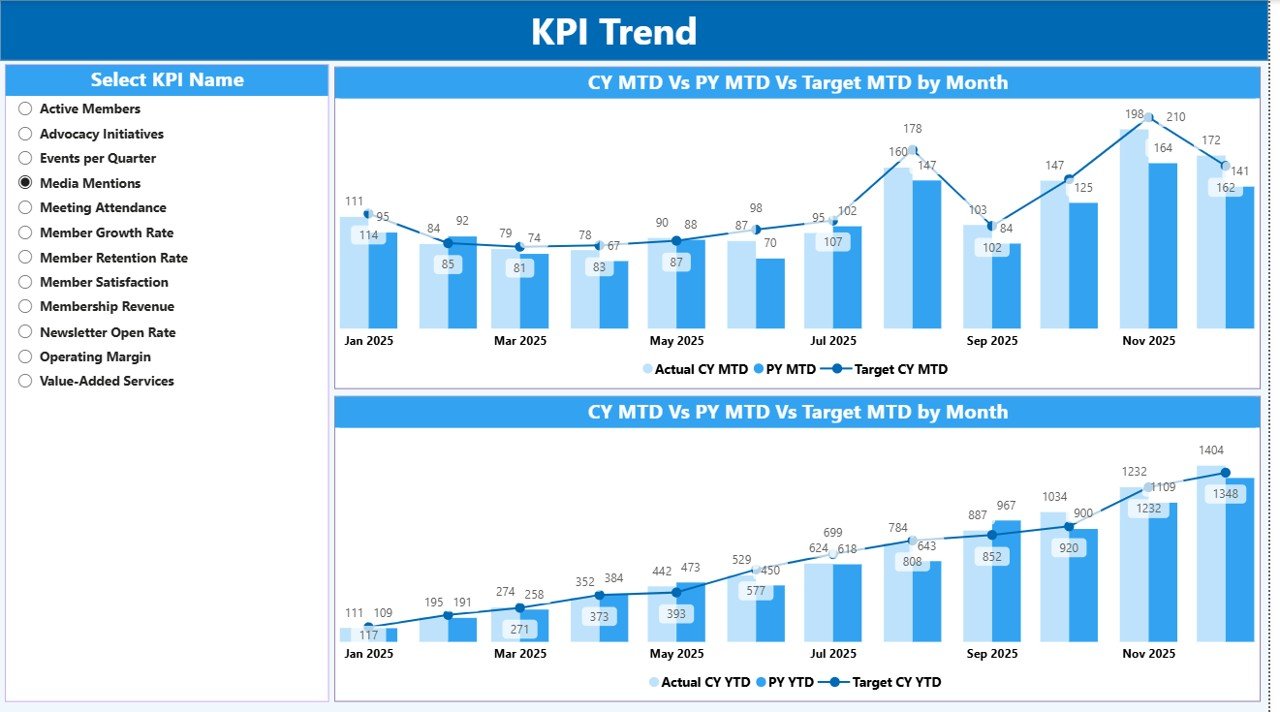
KPI Trend Page – Performance Analysis Over Time
The KPI Trend Page helps organizations analyze KPI trends.
Instead of viewing static data, users can observe performance patterns across months.
This page includes two combo charts.
MTD Trend Chart
This chart compares:
- Current Year Actual MTD
- Previous Year MTD
- Target MTD
Because the chart displays these values together, users can evaluate whether current performance exceeds previous results.
YTD Trend Chart
This chart displays:
- Current Year YTD Actual
- Previous Year YTD
- Target YTD
Therefore, decision-makers can monitor long-term KPI performance.
KPI Selection Slicer
On the left side of the page, users can select a specific KPI using the slicer.
As soon as users choose a KPI, both charts automatically update.
This feature allows users to analyze KPI performance in detail.
Click to buy Trade Associations KPI Dashboard in Power BI
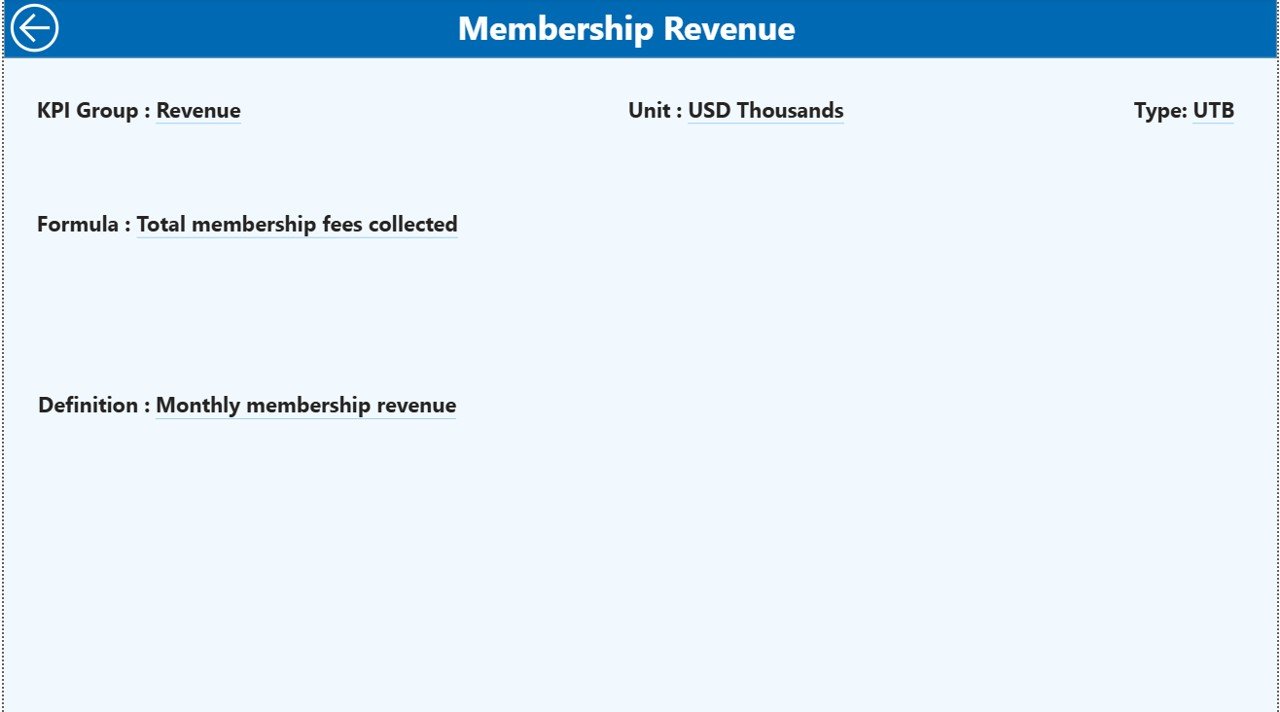
KPI Definition Page – Detailed KPI Information
The KPI Definition Page provides detailed KPI documentation.
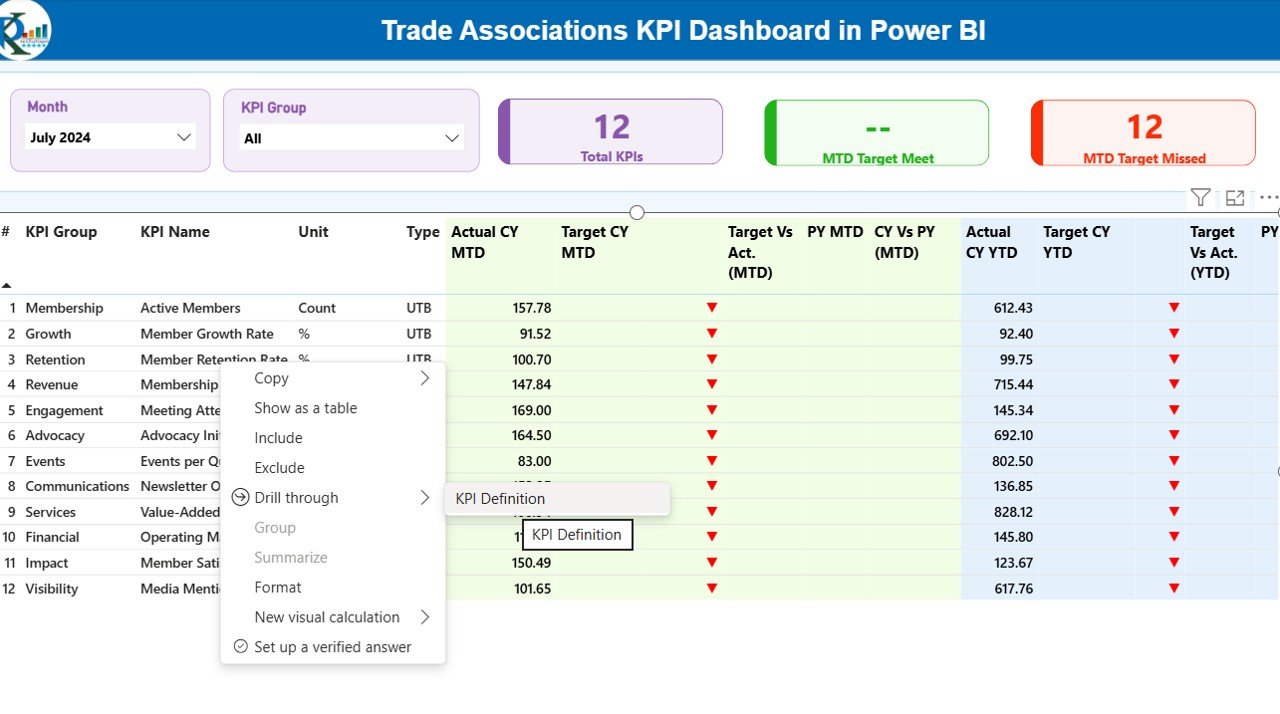
However, this page remains hidden by default.
Users can access it through drill-through functionality.
What information does this page show?
- KPI Number
- KPI Name
- KPI Formula
- KPI Definition
- Measurement Unit
- KPI Type
This page helps users understand how each KPI is calculated.
Additionally, it improves transparency and ensures consistent KPI interpretation.
Users can return to the main dashboard by clicking the Back Button on the top left corner.
Click to buy Trade Associations KPI Dashboard in Power BI
Excel Data Structure Used in the Dashboard
This Power BI dashboard uses Excel as the data source.
Users only need to update Excel sheets. Then Power BI automatically refreshes the dashboard.
The Excel file contains three worksheets.
Input_Actual Sheet
This sheet stores the actual KPI values.
Users need to enter:
- KPI Name
- Month (first date of the month)
- MTD Value
- YTD Value
After entering the data, Power BI automatically reads the updated values.
Click to buy Trade Associations KPI Dashboard in Power BI
Input_Target Sheet
This sheet stores KPI targets.
Users enter the following information:
- KPI Name
- Month
- Target MTD
- Target YTD
This information helps Power BI calculate performance against targets.
KPI Definition Sheet
This sheet defines the KPI structure.
Users enter:
- KPI Number
- KPI Group
- KPI Name
- Unit
- Formula
- Definition
- Type (LTB or UTB)
Because of this sheet, users can maintain consistent KPI definitions.
Advantages of Trade Associations KPI Dashboard in Power BI
Organizations gain several benefits when they use KPI dashboards.
- Better Decision Making
Dashboards present data visually.
Therefore, leaders can identify problems quickly and take corrective actions.
- Real-Time Performance Monitoring
Power BI updates reports instantly after refreshing data.
As a result, organizations always see the latest performance results.
- Improved Transparency
KPI dashboards make performance visible to stakeholders.
Therefore, teams understand organizational goals more clearly.
- Faster Reporting
Manual reporting requires hours of spreadsheet analysis.
However, dashboards generate reports automatically.
- Historical Performance Tracking
The dashboard compares current data with previous year performance.
Consequently, organizations can measure long-term progress.
Best Practices for the Trade Associations KPI Dashboard
To maximize the value of this dashboard, organizations should follow best practices.
Define KPIs Clearly
Organizations must define KPIs carefully.
Each KPI should include:
- Clear definition
- Formula
- Measurement unit
This ensures consistent reporting.
Maintain Data Accuracy
Accurate data leads to reliable insights.
Therefore, teams should validate Excel inputs regularly.
Update Data Consistently
Organizations should update KPI data monthly.
Consistent updates ensure meaningful trend analysis.
Limit KPI Overload
Tracking too many KPIs reduces focus.
Therefore, organizations should track only strategic KPIs.
Train Users
Users must understand how to read dashboard metrics.
Therefore, organizations should train employees to interpret KPI insights.
Who Can Use the Trade Associations KPI Dashboard?
This dashboard helps many professionals.
Typical users include:
- Trade association executives
- Membership managers
- Financial analysts
- Strategic planners
- Data analysts
Additionally, consulting firms and outsourced accounting teams can also use this dashboard.
Conclusion
Trade associations must track performance across multiple operational areas.
However, analyzing large volumes of KPI data manually can become difficult.
A Trade Associations KPI Dashboard in Power BI simplifies this process.
It transforms raw data into meaningful insights through interactive charts, KPI tables, and trend analysis.
Moreover, the dashboard allows organizations to monitor monthly and yearly performance, compare historical results, and identify improvement opportunities.
Therefore, organizations that adopt KPI dashboards improve decision-making, transparency, and operational efficiency.
Frequently Asked Questions (FAQs)
- What is a KPI dashboard in Power BI?
A KPI dashboard in Power BI is a visual reporting tool that displays key performance indicators using charts, tables, and metrics.
- Why do trade associations need KPI dashboards?
Trade associations use KPI dashboards to monitor operational performance, membership growth, financial health, and strategic initiatives.
- What data source does this dashboard use?
The dashboard uses Excel files as the data source.
- How many pages does this dashboard include?
The dashboard includes three pages:
- Summary Page
- KPI Trend Page
- KPI Definition Page
- What are MTD and YTD metrics?
- MTD (Month-to-Date) shows KPI performance for the current month.
- YTD (Year-to-Date) shows cumulative KPI performance for the entire year.
- What is the difference between UTB and LTB KPIs?
- UTB (Upper the Better) means higher values indicate better performance.
- LTB (Lower the Better) means lower values indicate better performance.
- Can organizations customize this dashboard?
Yes. Organizations can add new KPIs, modify formulas, and update Excel data to match their business requirements.
Visit our YouTube channel to learn step-by-step video tutorials
Watch the step-by-step video tutorial: