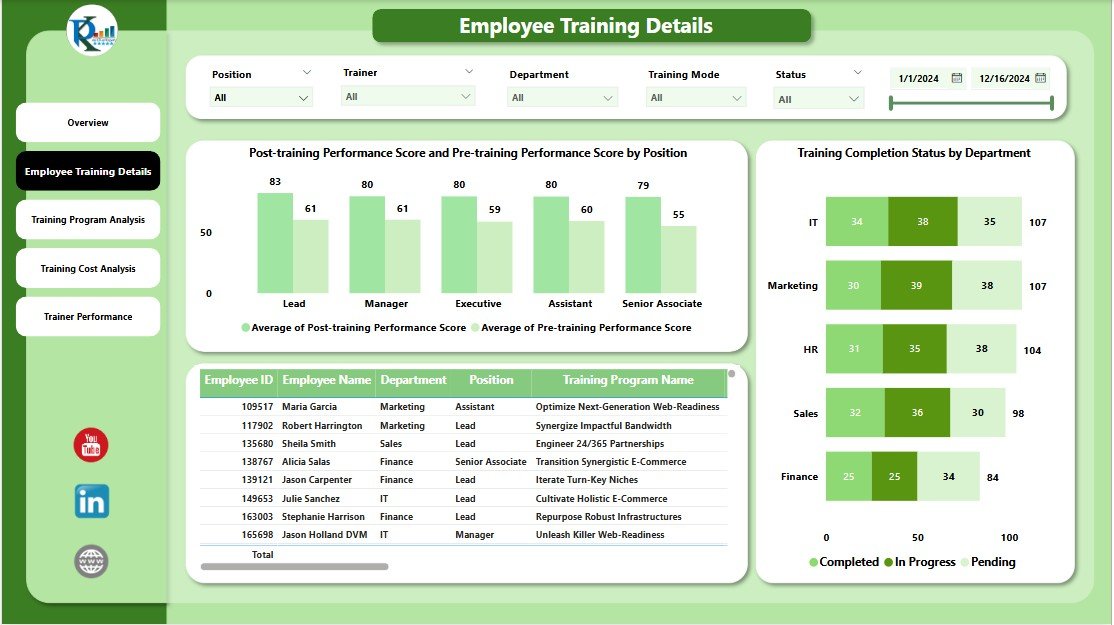
Welcome to our step-by-step guide on how to seamlessly connect charts slicers in Excel. This tutorial is perfect for anyone looking
In today's digital age, Artificial Intelligence (AI) is transforming how customer service operates. Whether you're leading an IT support team
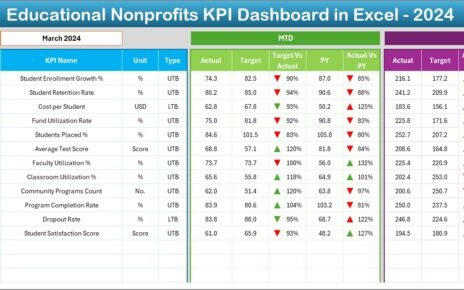
Educational nonprofits work with a powerful mission. They aim to improve learning outcomes, expand access to education, and create long-term