In today’s fast-moving business world, transportation and logistics are the backbone of every successful supply chain. Whether it’s delivering goods to customers, managing fleets, or monitoring fuel efficiency, transportation data drives operational excellence.
However, analyzing this data manually can be time-consuming and error-prone. That’s where a Transportation Report in Excel becomes invaluable. This interactive Excel-based tool helps logistics professionals and managers make informed decisions through clear visual reports, interactive dashboards, and accurate performance tracking.
In this article, you’ll learn everything about the Transportation Report in Excel — its structure, benefits, how to use it effectively, and the best practices to maximize its impact.
Click to Purchases Transportation Report in Excel
What Is a Transportation Report in Excel?
A Transportation Report in Excel is a data-driven reporting template designed to track, analyze, and visualize transportation performance metrics. It consolidates data from various logistics activities such as fuel cost, delivery time, delays, and route performance — all in one unified dashboard.
This Excel report provides actionable insights that help you identify bottlenecks, optimize delivery operations, and manage costs more effectively. With built-in charts, slicers, and summaries, users can view trends at a glance without needing any advanced software or coding knowledge.
In simple terms, this tool transforms raw logistics data into clear visuals and measurable insights, empowering better business decisions.
Structure of the Transportation Report Template
The Transportation Report in Excel is organized into three primary pages, each serving a specific function:
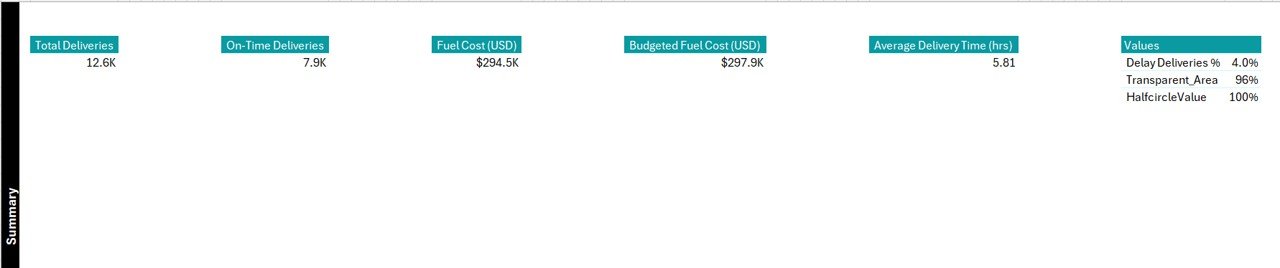
Summary Page – The Main Dashboard
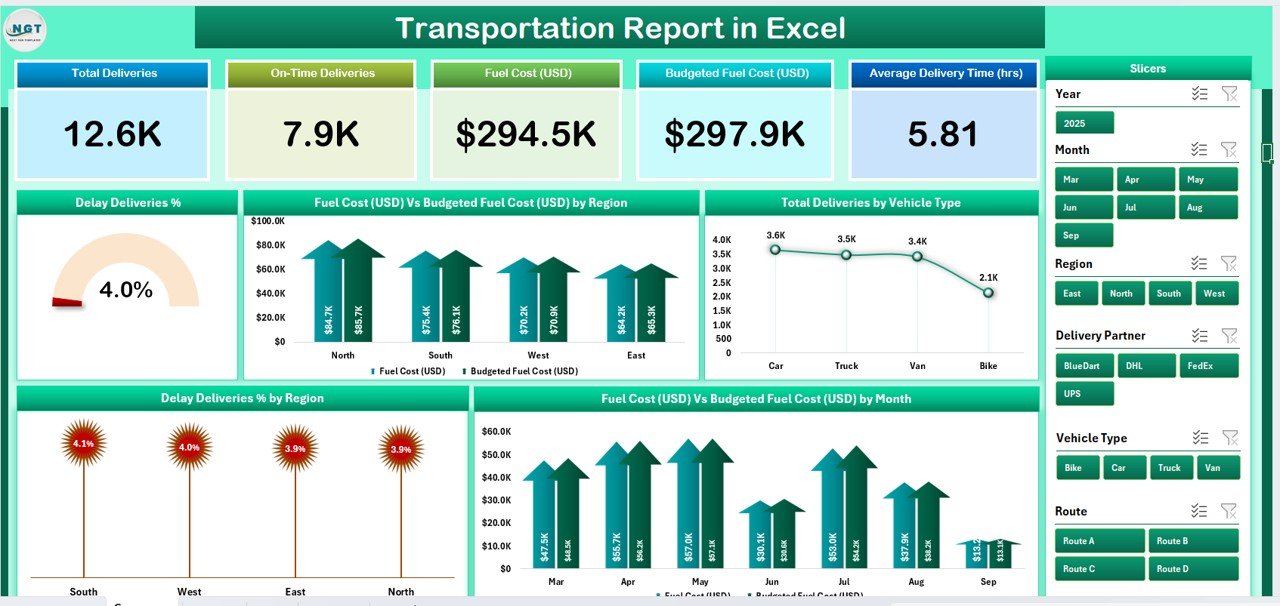
This is the central page of the report where most visual analysis happens.
-
It features five key performance cards on the top that display quick highlights such as:
- Total Deliveries
- Total Fuel Cost (USD)
- Delay Deliveries (%)
- Budget Fuel Cost (USD)
- Average Delivery Time
-
On the right-hand side, you’ll find slicers for easy filtering by Month, Region, or Vehicle Type.
Slicers allow instant updates of all visuals and tables with a single click, making it easy to analyze specific time frames or regional performance. -
Below the cards, the page includes five interactive charts:
- Delay Deliveries (%)
- Fuel Cost (USD) vs. Budget Fuel Cost (USD) by Region
- Total Deliveries by Vehicle Type
- Delay Deliveries (%) by Region
- Fuel Cost (USD) vs. Budget Fuel Cost (USD) by Month
These visuals provide an immediate overview of delivery performance, cost management, and operational efficiency.
2️⃣ Report Page – Detailed Analysis
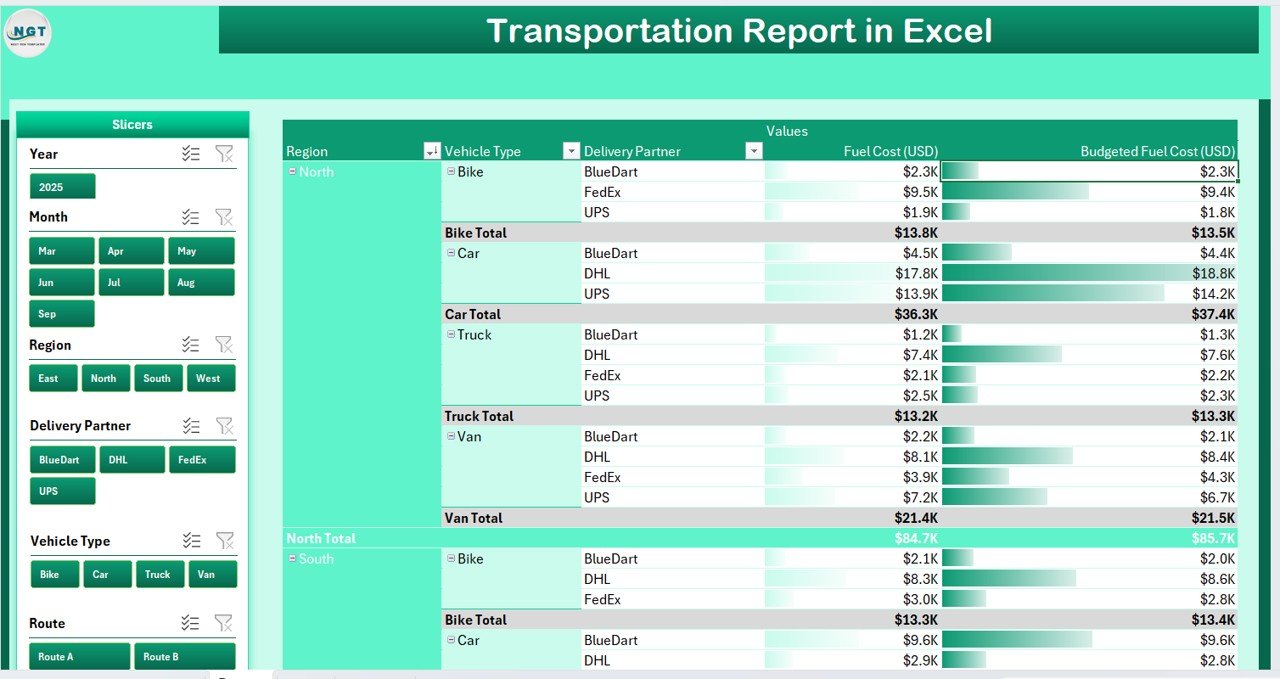
The Report Page provides a deeper view of the transportation data.
-
A left-side slicer panel allows users to filter data by parameters like Region, Vehicle Type, Driver, or Month.
The main section displays an information table showing:
-
-
Delivery Date
-
- Delivery ID
- Origin and Destination
- Vehicle Type
- Fuel Cost
- Budget Fuel Cost
- Delivery Status (On Time / Delayed)
- Delay Duration (if applicable)
This sheet is ideal for operational tracking and root cause analysis, helping logistics teams identify where problems occur — such as high fuel costs in certain regions or recurring delivery delays with specific vehicles.
3️⃣ Data Sheet – The Source of Truth
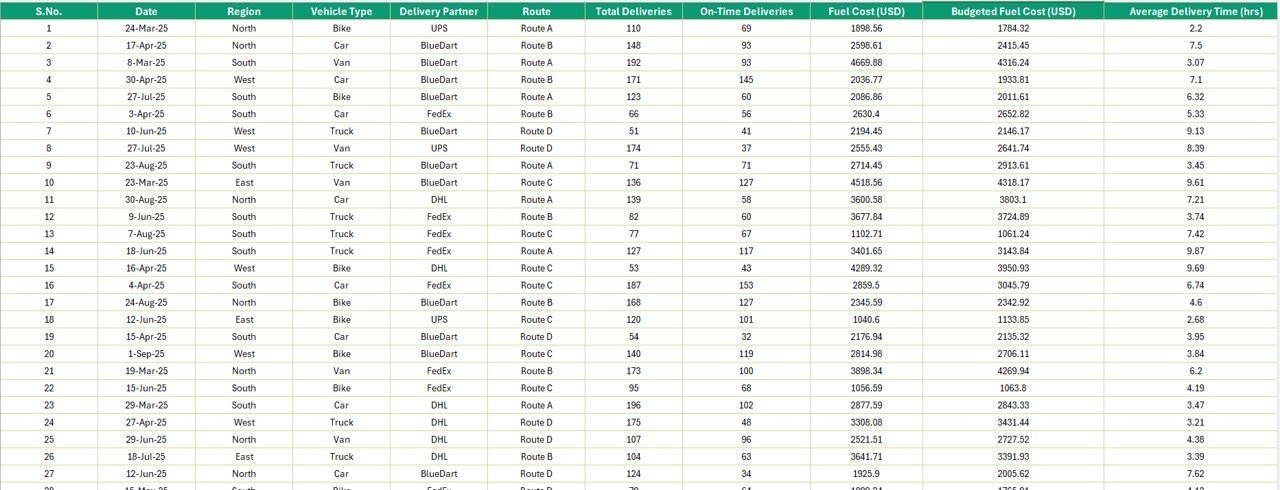
All raw data entries are stored in the Data Sheet.
It includes detailed records of each delivery transaction, such as:
- Delivery ID
- Region
- Vehicle Type
- Distance (km or miles)
- Fuel Consumed
- Fuel Cost
- Delivery Status
- Delivery Date
- Budget Fuel
This is the backbone of the report. The Summary and Report pages pull data from this sheet using Excel formulas, pivot tables, and dynamic ranges.
Because of this structure, users can simply update the Data Sheet with new records each month, and the entire report automatically updates — saving hours of manual effort.
4️⃣ Support Sheet – Reference Data and Settings
The Support Sheet stores reference lists and settings used throughout the report.
Click to Purchases Transportation Report in Excel
It may include:
-
Dropdown list values for regions, vehicle types, and drivers
-
Lookup tables for fuel budget, standard delay limits, or distance rates
-
Basic configuration data for formulas or conditional formatting
This design ensures that the entire report runs smoothly and maintains consistency in data entry.
Why Use Excel for Transportation Reporting?
Although several advanced logistics software tools exist, Excel remains one of the most powerful and accessible platforms for transportation analytics.
Here are a few reasons why Excel continues to be the go-to choice:
✅ Universal Accessibility: Almost everyone in an organization uses Excel — no need for complex installations.
✅ Flexibility: Excel allows customization of reports based on business requirements.
✅ Cost-Effective: No subscription or licensing fees for building performance dashboards.
✅ Automation Features: With formulas, pivot tables, and slicers, you can automate repetitive calculations.
✅ Integration Capability: You can import data from ERP, CRM, or logistics systems directly into Excel.
Advantages of a Transportation Report in Excel
Using a Transportation Report in Excel offers several advantages that simplify logistics management and decision-making:
1. Centralized View of Transportation Operations
All relevant performance metrics — from delivery counts to fuel budgets — appear in one place. This eliminates the need to check multiple files or systems.
2. Quick Decision-Making
Interactive charts and slicers allow you to analyze regional or monthly performance instantly. You can spot issues like high delay rates or increased costs and act immediately.
3. Improved Cost Control
By comparing actual fuel cost vs. budgeted cost, you can identify cost overruns, improve fuel planning, and optimize resource allocation.
4. Enhanced Performance Tracking
Tracking Delay Deliveries % by Region or Vehicle Type provides valuable insight into which routes or vehicles are causing inefficiencies.
5. Increased Accuracy and Efficiency
Automated formulas and charts reduce human errors. Once the data is entered, the report calculates all key metrics automatically.
6. Easy Customization
You can modify KPI cards, colors, or slicers to match your company’s reporting needs or branding style.
How to Create a Transportation Report in Excel
Building a Transportation Report in Excel doesn’t require advanced programming skills. Here’s a step-by-step approach:
-
Prepare the Data Table
Gather transportation data — including deliveries, fuel usage, routes, and costs — and organize it in a clean tabular format. -
Insert Pivot Tables
Use PivotTables to summarize the data by region, vehicle type, or month. These summaries will form the base for your charts. -
Add Charts and Cards
Use Excel’s charts (column, bar, pie, line) to visualize trends. Add formula-based cards on top for key KPIs like “Total Deliveries” or “Average Delay %.” -
Create Slicers
Insert slicers for Month, Region, or Vehicle Type so users can interact with the dashboard easily. -
Design the Dashboard Layout
Arrange the elements neatly using shapes, colors, and conditional formatting. Keep it visually consistent and simple. -
Link Data to a Separate Sheet
Always keep raw data in a separate sheet. The dashboard should reference it dynamically to avoid clutter and ensure easy updates.
Best Practices for the Transportation Report in Excel
To make the most of your Transportation Report, follow these best practices:
✅ 1. Keep Data Entry Consistent
Ensure that each column follows the same format. For instance, all dates should use the same format (DD-MMM-YYYY), and region names should be standardized.
✅ 2. Automate Calculations
Use formulas such as SUMIFS, AVERAGEIFS, and COUNTIFS for dynamic KPI computation. This reduces manual work and improves accuracy.
✅ 3. Use Conditional Formatting
Click to Purchases Transportation Report in Excel
Highlight delays, cost overruns, or low performance using color codes. For example:
-
Green for On-Target
-
Yellow for Slightly Over Budget
-
Red for Critical or Delayed Deliveries
✅ 4. Add Interactive Filters
Slicers or drop-down filters make your dashboard user-friendly and interactive. They allow managers to drill down into specific metrics.
✅ 5. Secure Your Data
Protect formula cells or dashboards from unwanted edits using Excel’s “Protect Sheet” feature.
✅ 6. Refresh Regularly
Schedule weekly or monthly updates by importing new data. Regularly refreshing ensures decisions are based on the latest insights.
✅ 7. Keep Visuals Clean
Avoid cluttering your dashboard with too many charts. Use a maximum of 5–6 visuals per page for clarity and focus.
Common Challenges in Transportation Reporting (and How to Solve Them)
Even with powerful Excel tools, transportation teams may face challenges like:
1. Data Overload
Too many variables can make reports difficult to interpret.
Solution: Focus on top 10–12 KPIs that matter most to your business goals.
2. Manual Errors
Human errors in data entry can affect report accuracy.
Solution: Use drop-down lists and data validation to minimize mistakes.
3. Difficulty in Interpretation
Non-technical users may struggle to understand numbers.
Solution: Add charts, color indicators, and KPI cards for visual simplicity.
4. Delayed Updates
Reports lose value if not updated regularly.
Solution: Set a routine (weekly or monthly) to refresh the data sheet automatically.
How the Transportation Report Supports Business Growth
A Transportation Report in Excel goes beyond tracking — it empowers strategic growth. Here’s how:
-
Operational Efficiency: Identify underperforming routes or vehicles and optimize them.
-
Cost Optimization: Track and reduce unnecessary fuel consumption.
-
Customer Satisfaction: Improve on-time deliveries and reduce delays.
-
Strategic Planning: Use trends to forecast future resource needs or budget allocations.
-
Performance Accountability: Managers can review regional or driver performance objectively.
When implemented correctly, this report becomes a decision-support system for your logistics operations.
Steps to Maintain and Update the Report
To ensure that your Transportation Report remains accurate and relevant:
-
Collect Data Regularly – Input delivery and cost data after every reporting period.
-
Validate Inputs – Check for missing or inconsistent entries.
-
Refresh Pivot Tables – Click “Refresh All” in Excel to update charts and tables automatically.
-
Archive Old Data – Move older data to a separate file to keep your workbook light and fast.
-
Back Up Files – Always save backups on cloud drives to avoid accidental data loss.
Conclusion
A Transportation Report in Excel is more than just a spreadsheet — it’s a complete logistics performance management system.
It enables companies to track deliveries, analyze fuel costs, identify delays, and optimize routes — all in one simple, dynamic dashboard.
With a well-structured design and consistent data updates, you can transform ordinary data into powerful insights that drive operational efficiency and cost savings.
Whether you manage a small delivery fleet or a large logistics network, this Excel template provides everything you need to monitor and improve your transportation operations.
Frequently Asked Questions (FAQs)
1. What is the purpose of a Transportation Report in Excel?
It helps logistics managers track delivery performance, fuel expenses, and delay trends in an organized and visual format. It’s ideal for monitoring efficiency and identifying areas for improvement.
2. Can I customize the Transportation Report template?
Yes, you can modify KPI cards, slicers, and visual layouts to match your organization’s needs or reporting standards.
3. Is this report suitable for small businesses?
Absolutely! Small and medium businesses can use it to manage fleet performance, fuel budgets, and delivery trends without investing in expensive software.
4. How often should I update the Transportation Report?
Updating it weekly or monthly ensures the data reflects real-time operations, which helps in accurate analysis and decision-making.
5. Can I link this Excel report with other software?
Yes, Excel allows importing data from ERP, CRM, or GPS tracking systems. You can also use Power Query or macros for automation.
6. What skills are required to use this report?
Basic Excel knowledge — such as handling formulas, filters, and charts — is enough. No advanced coding or Power BI experience is necessary.
7. Does this report work on Excel Online or Google Sheets?
While designed for desktop Excel, most functions (except some slicers or macros) also work in Excel Online and Google Sheets with slight adjustments.
Visit our YouTube channel to learn step-by-step video tutorials