Travel tech startups operate in a fast-moving and highly competitive market. Customer behavior changes quickly, demand fluctuates by season, and operational costs remain high. Therefore, founders and leadership teams must track performance daily, monthly, and yearly. However, many startups still rely on scattered Excel sheets, manual reports, and delayed analysis.
That is exactly where a Travel Tech Startups KPI Dashboard in Power BI delivers massive value.
This ready-to-use dashboard helps travel technology companies monitor key performance indicators (KPIs) in a structured, visual, and actionable way. Moreover, it connects Excel-based data with Power BI visuals to deliver real-time insights without complex setup.
In this detailed article, you will learn what this dashboard is, how it works, why travel tech startups need it, its pages and features, advantages, best practices, and frequently asked questions.
What Is a Travel Tech Startups KPI Dashboard in Power BI?
A Travel Tech Startups KPI Dashboard in Power BI is an interactive analytics solution designed to track, analyze, and compare business KPIs for travel technology companies.
Instead of reviewing raw data, teams can instantly:
- Track Month-to-Date (MTD) and Year-to-Date (YTD) performance
- Compare actual values with targets
- Analyze trends across current year and previous year
- Identify underperforming and high-performing KPIs
- Drill down into KPI definitions and formulas
Because the dashboard uses Excel as the data source and Power BI for visualization, it remains flexible, scalable, and easy to maintain.
Why Do Travel Tech Startups Need a KPI Dashboard?
Travel tech startups face multiple challenges at the same time. Customer acquisition costs increase, margins fluctuate, and operational efficiency becomes critical. Therefore, leadership teams must make decisions quickly and confidently.
A KPI dashboard helps because it:
- Centralizes all performance data
- Eliminates manual reporting work
- Improves visibility across teams
- Supports data-driven decisions
- Saves time during monthly reviews
As a result, startups move faster and scale smarter.
What Are the Key Features of the Travel Tech Startups KPI Dashboard in Power BI?
This dashboard comes as a ready-to-use Power BI file connected to an Excel data source. It includes three structured pages, each designed for a specific purpose.
How Does the Summary Page Help Decision-Makers?
Summary Page Overview
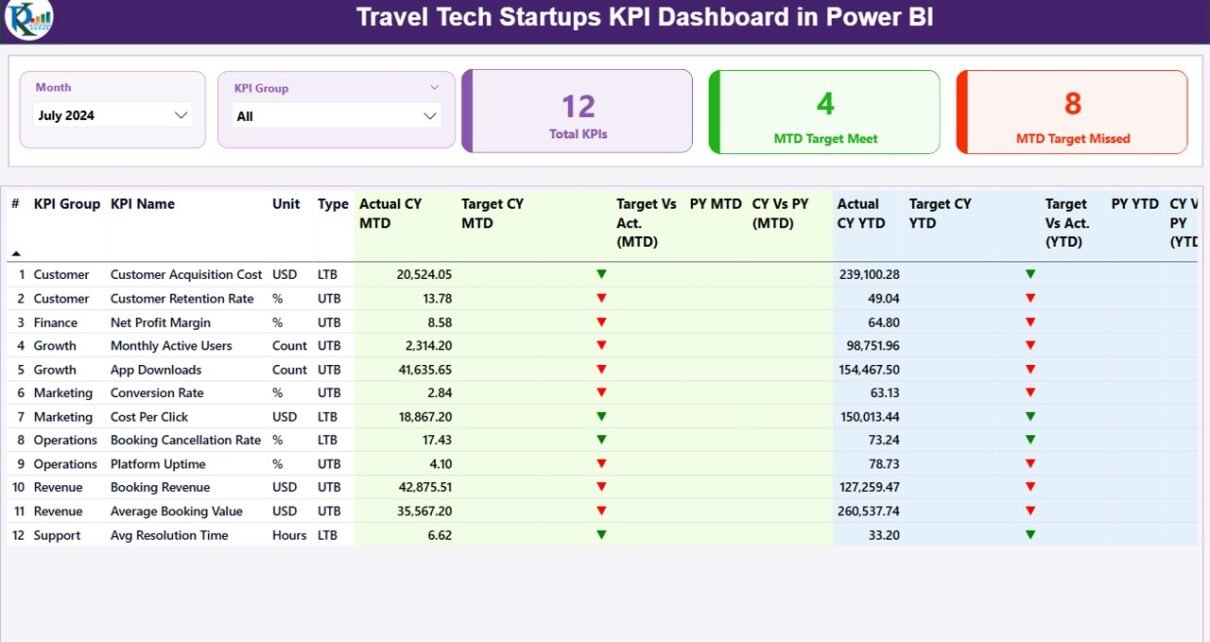
The Summary Page works as the control center of the dashboard. It gives leadership teams an instant snapshot of overall performance.
At the top of the page, you will find:
- Month slicer to select reporting period
- KPI Group slicer to filter KPIs by category
These slicers allow users to analyze performance dynamically without changing the data.
What KPI Cards Are Available on the Summary Page?
The dashboard includes three KPI cards at the top:
- Total KPIs Count – Shows how many KPIs exist
- MTD Target Met Count – Shows KPIs meeting targets
- MTD Target Missed Count – Shows KPIs missing targets
Because these cards update instantly, decision-makers can identify issues at a glance.
What Details Does the KPI Table Show?
Below the cards, the dashboard displays a detailed KPI table with complete performance metrics.
Each row represents one KPI and includes:
- KPI Number – Sequence number of the KPI
- KPI Group – Category or business area
- KPI Name – Name of the KPI
- Unit – Unit of measurement
- Type – LTB (Lower the Better) or UTB (Upper the Better)
How Does the Dashboard Show MTD Performance?
For Month-to-Date analysis, the table includes:
- Actual CY MTD – Current year actual value
- Target CY MTD – Target value for the month
- MTD Icon –
- ▲ Green arrow for target met
- ▼ Red arrow for target missed
- Target vs Actual (MTD) –
- Formula: Actual / Target
- PY MTD – Previous year MTD value
- CY vs PY (MTD) –
- Formula: Current Year MTD / Previous Year MTD
Therefore, teams can instantly compare performance against goals and past results.
How Does the Dashboard Show YTD Performance?
For Year-to-Date analysis, the dashboard shows:
- Actual CY YTD – Current year YTD actual
- Target CY YTD – Current year YTD target
- YTD Icon –
- ▲ Green arrow for success
- ▼ Red arrow for underperformance
- Target vs Actual (YTD) –
- Formula: Actual / Target
- PY YTD – Previous year YTD value
- CY vs PY (YTD) –
- Formula: Current Year YTD / Previous Year YTD
As a result, leadership teams gain a long-term performance view.

What Insights Does the KPI Trend Page Provide?
KPI Trend Page Overview
The KPI Trend Page focuses on performance trends over time.
This page includes:
- Two combo charts
- KPI Name slicer on the left
Users can select any KPI to analyze trends instantly.
What Do the Combo Charts Show?
Each combo chart displays:
- Current Year Actual values
- Previous Year Actual values
- Target values
One chart shows MTD trends, while the other shows YTD trends.
Because these charts combine bars and lines, trends become easy to understand and explain.

Why Are Trend Charts Important for Startups?
Trend analysis helps startups because it:
- Identifies seasonal patterns
- Highlights consistent growth or decline
- Supports forecasting and planning
- Strengthens investor presentations
Therefore, trend visibility improves strategic decisions.
What Is the KPI Definition Page and Why Does It Matter?
KPI Definition Page Overview
The KPI Definition Page acts as a drill-through page.
This page remains hidden by default. However, users can drill through from the Summary Page to view detailed KPI information.
What Information Does the KPI Definition Page Show?
For each KPI, this page displays:
- KPI Number
- KPI Group
- KPI Name
- Unit
- Formula
- KPI Definition
- Type (LTB or UTB)
Because definitions stay centralized, confusion disappears during reviews.
How Can Users Navigate Back?
A Back button appears at the top-left corner. With one click, users return to the Summary Page instantly.

How Does the Excel Data Source Work?
The dashboard connects to an Excel file with three structured worksheets.
Input_Actual Sheet
In this sheet, users enter:
- KPI Name
- Month (use first date of the month)
- MTD actual value
- YTD actual value
This structure ensures clean and consistent data.

Input_Target Sheet
In this sheet, users enter:
- KPI Name
- Month (use first date of the month)
- MTD target value
- YTD target value
Because targets remain separate, comparisons stay accurate.
KPI Definition Sheet
This sheet stores master data:
- KPI Number
- KPI Group
- KPI Name
- Unit
- Formula
- Definition
- Type (LTB or UTB)
As a result, KPI logic stays standardized.
Advantages of Travel Tech Startups KPI Dashboard in Power BI
Using this dashboard delivers multiple advantages:
- Centralized KPI tracking
- Clear MTD and YTD analysis
- Visual target vs actual comparison
- Easy Excel-based data entry
- Drill-through KPI transparency
- Faster management reviews
- Improved accountability
- Investor-ready reporting
Therefore, startups gain control over performance.
Best Practices for the Travel Tech Startups KPI Dashboard in Power BI
To get maximum value, follow these best practices:
- Always update Excel data monthly
- Use consistent KPI names across sheets
- Review LTB and UTB logic carefully
- Analyze both MTD and YTD regularly
- Use trend charts for forecasting
- Limit KPIs to meaningful metrics
- Keep definitions simple and clear
- Share dashboards with leadership teams
When teams follow these practices, insights remain reliable.
How Can This Dashboard Support Executive Search & Staffing Use Cases?
Interestingly, this same structure also works for Executive Search & Staffing KPI Dashboards. Because the KPI logic remains flexible, companies can track:
- Placement success rates
- Revenue per consultant
- Client acquisition metrics
- Time-to-hire KPIs
Therefore, the dashboard design scales across industries.
Conclusion: Why Should Travel Tech Startups Use This KPI Dashboard?
A Travel Tech Startups KPI Dashboard in Power BI transforms raw data into meaningful insights. Instead of guessing performance, teams track it precisely. Instead of reacting late, leaders act early.
Because the dashboard combines Excel simplicity with Power BI visuals, it fits perfectly into startup environments. Moreover, it supports growth, accountability, and smarter decisions.
If your travel tech startup wants clarity, speed, and control, this dashboard becomes a powerful asset.
Frequently Asked Questions (FAQs)
What is the main purpose of a Travel Tech KPI Dashboard?
The dashboard helps track, analyze, and compare startup KPIs using MTD and YTD views.
Do I need advanced Power BI skills to use this dashboard?
No. You only need to update Excel data. The visuals update automatically.
Can I add new KPIs later?
Yes. You can add new KPIs by updating the Excel sheets.
Does the dashboard support year-over-year comparison?
Yes. It compares current year and previous year for both MTD and YTD.
Is this dashboard suitable for early-stage startups?
Yes. It works well for both early-stage and scaling startups.
Can this dashboard work for other industries?
Yes. The structure fits staffing, SaaS, consulting, and service businesses.
Watch the step-by-step video tutorial:
Visit our YouTube channel to learn step-by-step video tutorials