Trucking companies manage routes, drivers, fuel cost, maintenance, shipments, and customer ratings every day. Because the logistics industry moves very fast, trucking businesses need a clear way to track performance and reduce operational issues. That is why the Trucking Companies Dashboard in Excel becomes the perfect tool for fleet managers, logistics teams, dispatchers, and business owners.
This dashboard brings all important trucking KPIs into a single Excel file. It also helps managers monitor trends, compare performance, and make faster decisions. In this article, we explore everything about this dashboard—its pages, charts, features, advantages, best practices, and FAQs.
Let’s begin the journey!
Click to Purchases Trucking Companies Dashboard in Excel
What Is a Trucking Companies Dashboard in Excel?
A Trucking Companies Dashboard in Excel is a ready-to-use template that tracks trucking KPIs such as revenue, fuel cost, delivery performance, maintenance cost, shipment count, and driver efficiency. It uses Excel formulas, charts, slicers, and page navigation buttons to create a complete logistics monitoring system.
It includes five main analytical pages:
✔ Overview Page
✔ Destination Analysis
✔ Driver Name Analysis
✔ Cost Analysis
✔ Monthly Trends
The dashboard allows trucking companies to understand the entire business in one place.
Click to Purchases Trucking Companies Dashboard in Excel
Why Trucking Companies Need a Dashboard
Running a trucking company without clear KPIs creates delays, increased costs, low customer satisfaction, and missed delivery timelines. However, when companies use an Excel-based dashboard, they get instant insights and avoid problems.
You need this dashboard because:
-
It tracks daily, monthly, and yearly logistics activities.
-
It highlights cost-heavy areas.
-
It identifies top-performing and low-performing destinations.
-
It gives real-time visibility of revenue, profit, fuel cost, and shipments.
-
It helps reduce delays and increase customer satisfaction.
In short, this dashboard gives complete control over operations.
Key Features of the Trucking Companies Dashboard in Excel
This Excel dashboard contains five powerful pages, and each page shows a different type of analysis.
Let’s explore them.
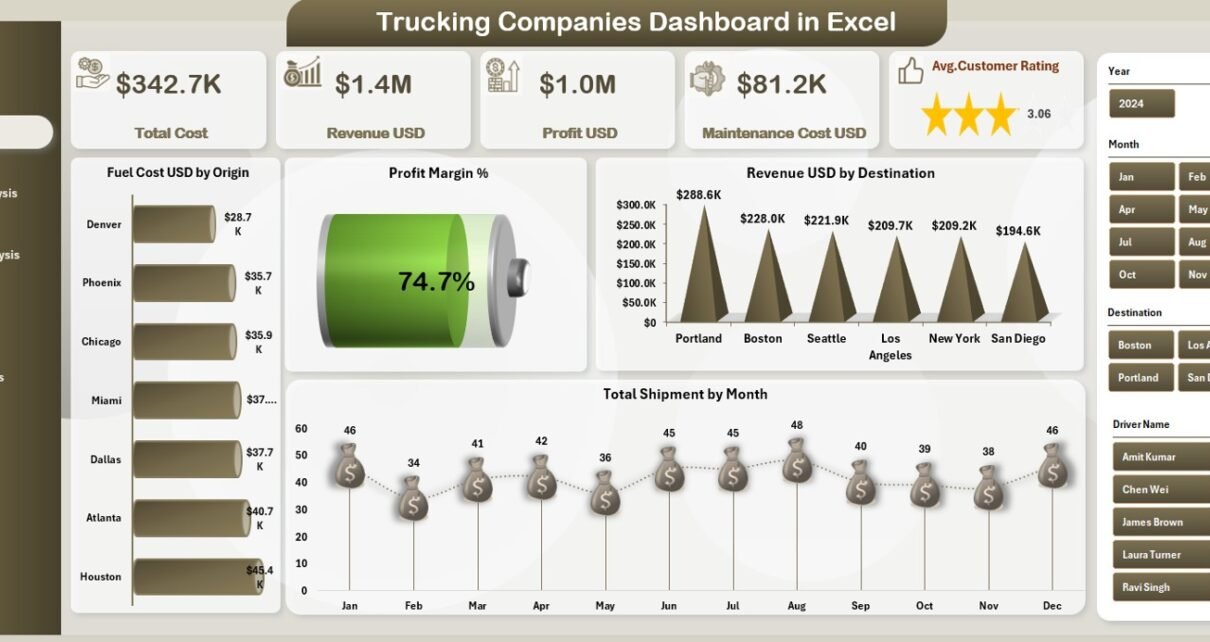
1. Overview Page – Your Main Trucking Summary
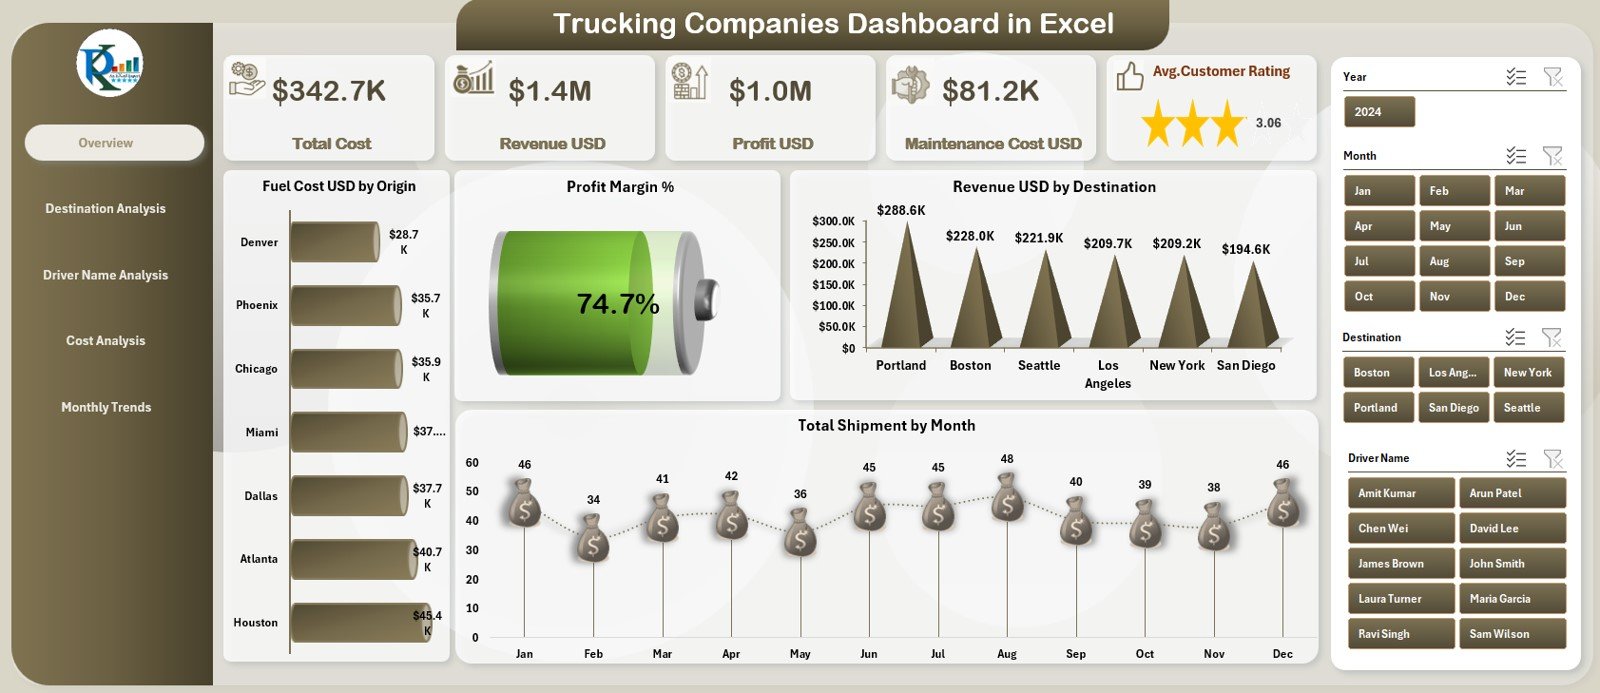
The Overview Page gives a complete picture of your trucking business.
This page includes:
✔ Five KPI Cards
These cards highlight the major KPIs:
-
Total Revenue
-
Total Profit
-
Total Shipments
-
Average Customer Rating
-
Fuel Cost
These values change instantly when the month or filter changes.
✔ Four Key Charts
⭐ 1. Profit Margin %
Shows how much profit the company earns after all costs.
⭐ 2. Revenue USD by Destination
Reveals top revenue-generating locations.
⭐ 3. Fuel Cost USD by Origin
Shows where fuel spending is high.
⭐ 4. Total Shipments by Month
Helps track shipment volume trends over time.
The Overview page allows users to analyze performance at a glance.
Click to Purchases Trucking Companies Dashboard in Excel
2. Destination Analysis – Understand Route Performance
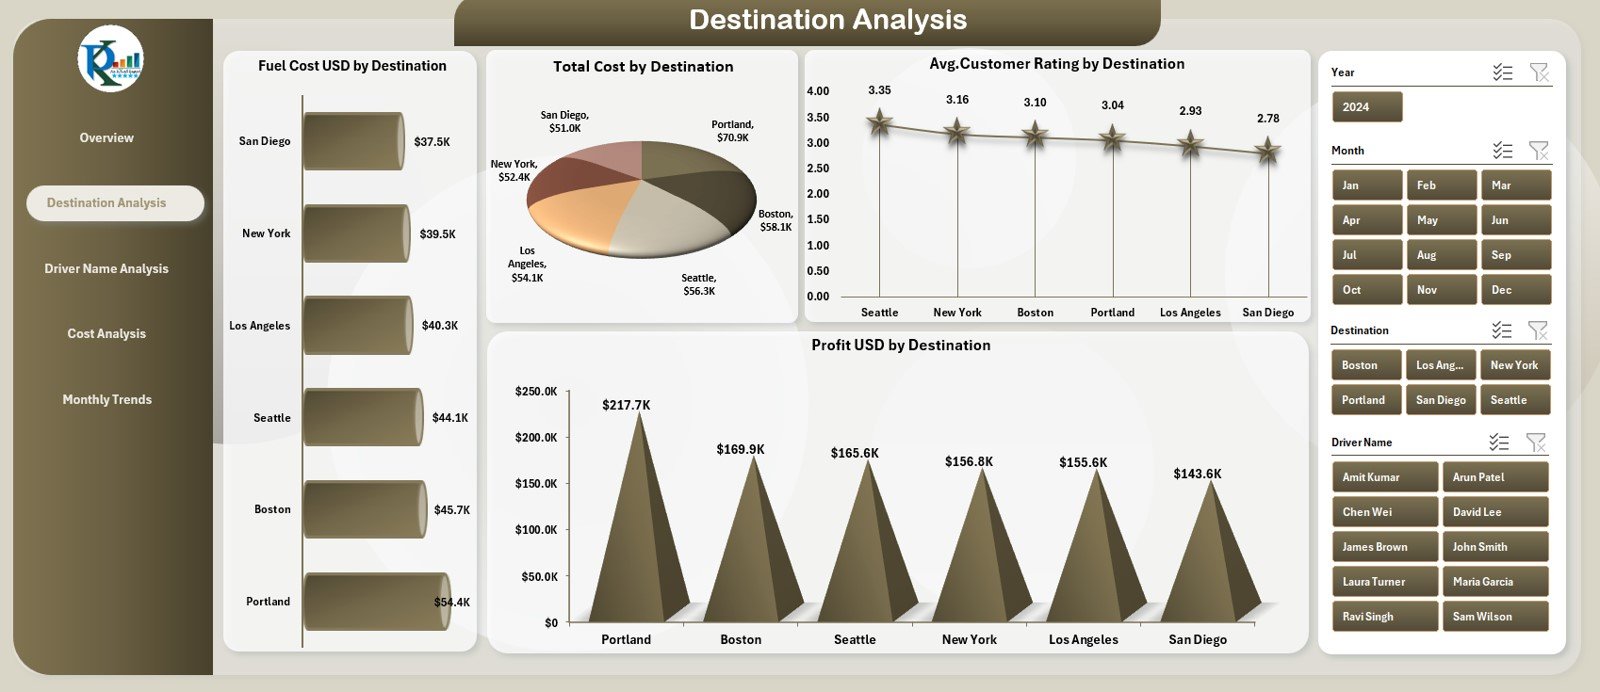
This page helps analyze every destination separately.
It includes four charts:
✔ 1. Total Cost USD by Destination
Shows which destinations consume the highest cost.
✔ 2. Average Customer Rating by Destination
Indicates customer satisfaction for each route.
✔ 3. Fuel Cost USD by Destination
Helps track the most fuel-heavy locations.
✔ 4. Profit USD by Destination
Shows which destinations generate high or low profit.
This section helps companies optimize routes, reduce fuel consumption, and improve profitability.
3. Driver Name Analysis – Measure Driver Performance
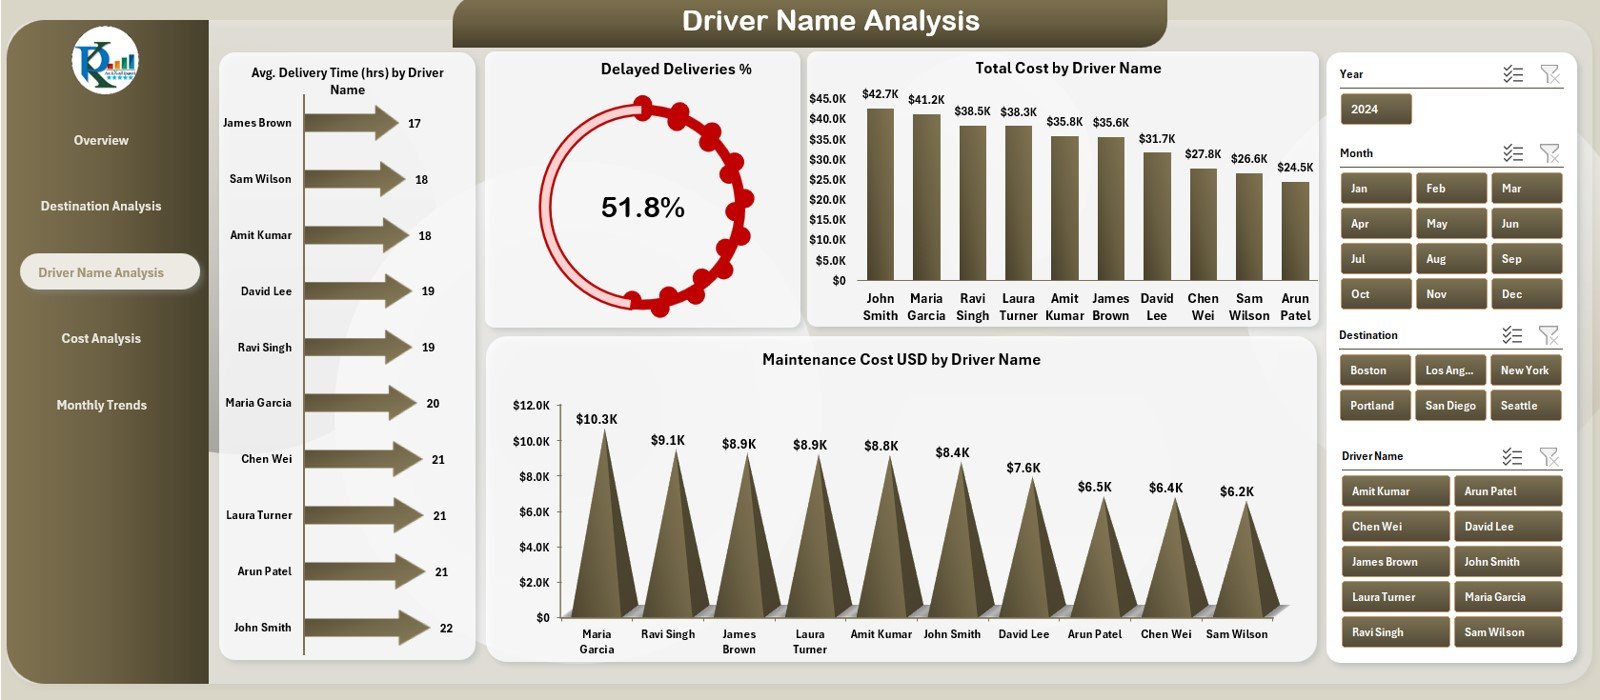
Drivers play a crucial role in on-time delivery and cost control. That’s why this page focuses on driver-level analytics.
It includes four important charts:
✔ 1. Delayed Deliveries % by Driver Name
Shows which drivers frequently delay deliveries.
✔ 2. Total Cost USD by Driver Name
Displays cost distribution among drivers.
✔ 3. Average Delivery Time (Hrs) by Driver Name
Helps monitor delivery speed.
✔ 4. Maintenance Cost USD by Driver Name
Shows equipment-related costs per driver.
This page supports performance evaluation, training needs, and driver reward programs.
Click to Purchases Trucking Companies Dashboard in Excel
4. Cost Analysis – Find Where Money Goes
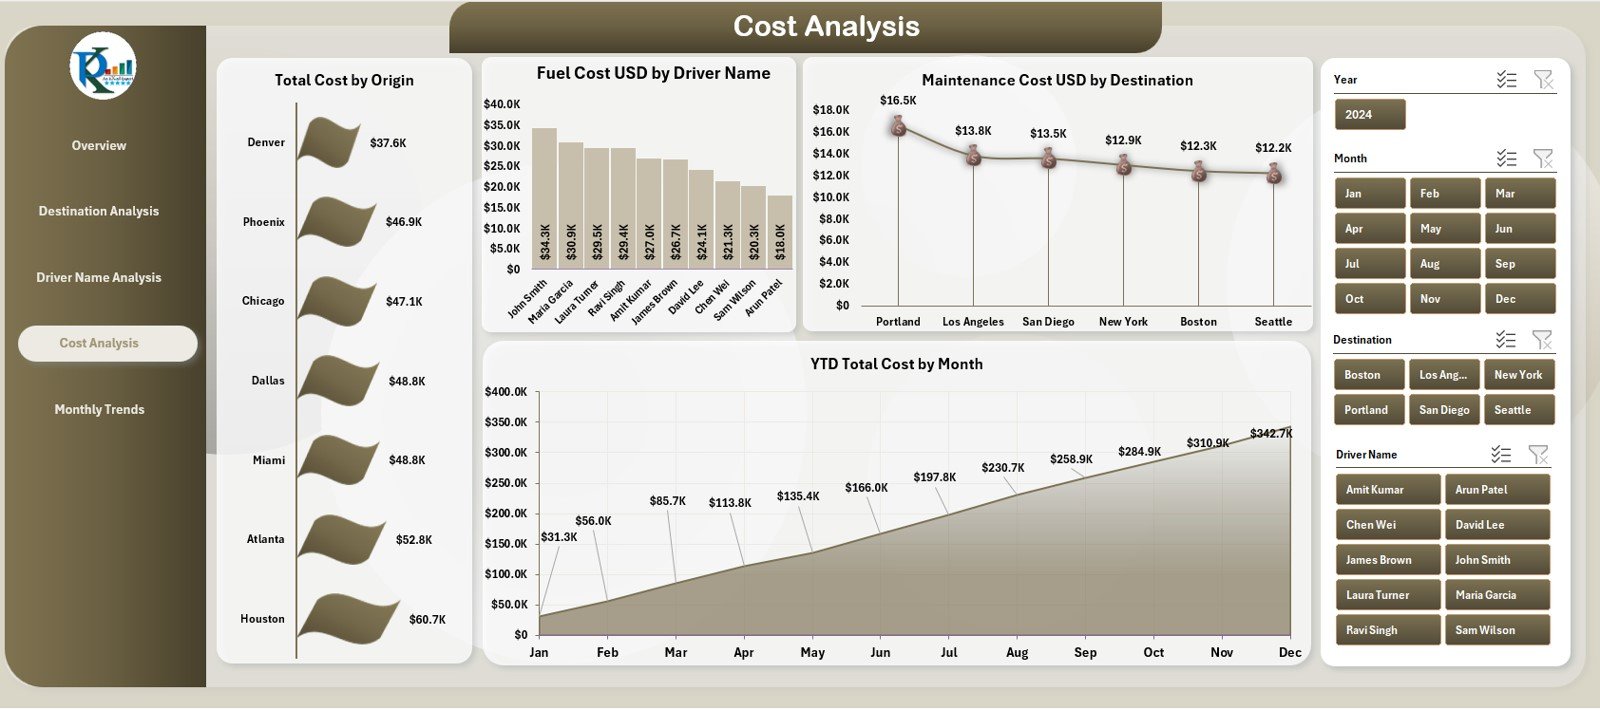
This page focuses on the financial side of trucking operations.
It displays four key visuals:
✔ 1. Total Cost by Origin
Shows how different starting points affect cost.
✔ 2. Fuel Cost USD by Driver Name
Identifies drivers with high fuel usage.
✔ 3. Maintenance Cost USD by Destination
Shows repair and maintenance expenses.
✔ 4. YTD Total Cost by Month
Displays month-wise cost trends throughout the year.
This page helps companies reduce operational cost and improve efficiency.
5. Monthly Trends – Understand Month-Wise Performance
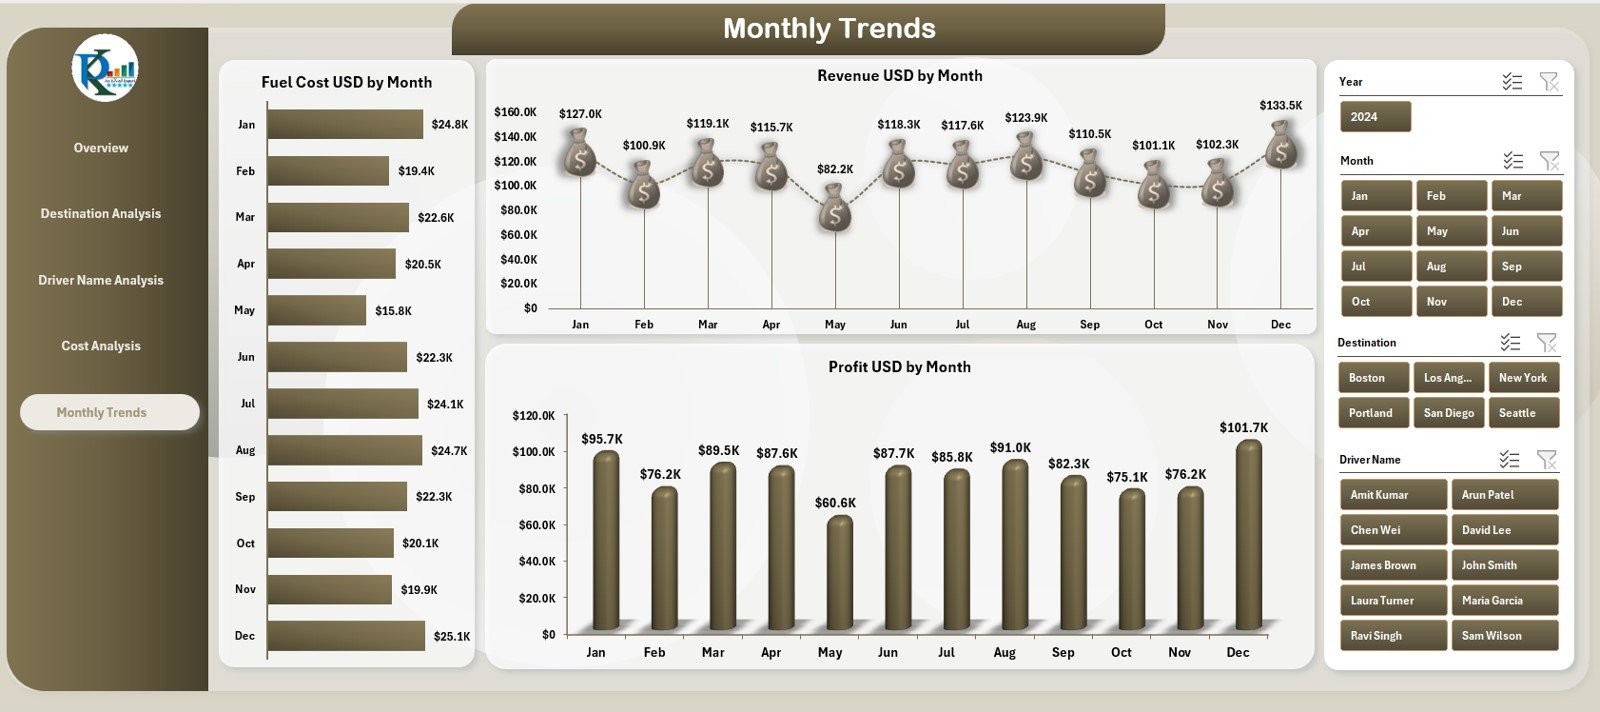
This page allows managers to track business growth every month.
It includes three charts:
✔ Fuel Cost USD by Month
Shows how fuel spending changes over time.
✔ Revenue USD by Month
Displays monthly income from shipments.
✔ Profit USD by Month
Tracks profit trends across the year.
These charts help companies understand seasonality and business behavior.
Support Sheet & Data Sheet
The dashboard also includes:
✔ Support Sheet
For storing lists, dropdown values, and reference tables.
✔ Data Sheet
Where users enter raw trucking data:
-
Driver name
-
Destination
-
Origin
-
Shipment date
-
Cost
-
Fuel usage
-
Revenue
-
Delivery time
-
Customer rating
These sheets make the dashboard dynamic and fully automated.
Click to Purchases Trucking Companies Dashboard in Excel
Advantages of the Trucking Companies Dashboard in Excel
1. Clear Operational Visibility
The dashboard summarizes fleet, routes, drivers, and costs in one view.
2. Faster Decision-Making
Managers see performance instantly and fix issues quickly.
3. Route Optimization
Destination analysis helps adjust trucking routes and reduce fuel cost.
4. Better Driver Management
Driver insights help reward top drivers and improve awareness.
5. Improved Profitability
Tracking revenue, profit, and maintenance cost leads to better efficiency.
6. Trend Tracking
Users understand month-wise patterns and plan ahead.
7. Easy Navigation
The Page Navigator on the left side helps users switch between pages easily.
How to Build a Trucking Dashboard in Excel
Step 1: Load the Data Sheet
Enter shipment, driver, destination, cost, profit, and fuel details.
Step 2: Create Pivot Tables
Use Pivot Tables for:
-
Revenue
-
Cost
-
Fuel usage
-
Profit
-
Delivery performance
Step 3: Insert Pivot Charts
Use line, bar, column, and combo charts.
Step 4: Build KPI Cards
Use formulas like:
-
SUMIFS
-
AVERAGEIFS
-
COUNTIFS
Step 5: Design Navigation Buttons
Create clickable buttons using shapes.
Step 6: Format the Dashboard
Use clear colors and conditional formatting.
Click to Purchases Trucking Companies Dashboard in Excel
Best Practices for the Trucking Companies Dashboard in Excel
1. Keep the Layout Simple
Avoid clutter and present only important KPIs.
2. Use Consistent Units
Use the same units for cost, fuel, and revenue.
3. Update Data Regularly
Add new shipments daily or monthly.
4. Use Conditional Formatting
Highlight negative trends in red and positive trends in green.
5. Optimize Pivot Tables
Always refresh the pivot tables after updating data.
6. Track Yearly Patterns
Monthly Trends help you understand seasonality.
Conclusion
The Trucking Companies Dashboard in Excel gives trucking businesses a powerful, easy, and professional way to track fleet operations. With five detailed pages—Overview, Destination Analysis, Driver Analysis, Cost Analysis, and Monthly Trends—this dashboard becomes a complete solution for logistics performance tracking.
Because it highlights revenue, profit, fuel cost, driver performance, customer rating, and more, companies get a full view of operations and make smarter decisions. If you want a clear and reliable system to manage your trucking business, this dashboard is the perfect tool.
Click to Purchases Trucking Companies Dashboard in Excel
Frequently Asked Questions (FAQs)
1. What is a Trucking Companies Dashboard in Excel?
It is a visual performance dashboard that tracks trucking KPIs like revenue, cost, shipments, driver performance, and profit.
2. How many pages does this dashboard include?
It includes five pages: Overview, Destination Analysis, Driver Name Analysis, Cost Analysis, and Monthly Trends.
3. Do I need Excel experience to use it?
No, the dashboard is easy to use with dropdowns, charts, and automatic calculations.
4. Can I add more KPIs?
Yes, you can add new KPIs in the data sheet and update pivot tables.
5. Does the dashboard calculate profit automatically?
Yes, revenue minus cost gives the profit metrics.
6. Is it suitable for small trucking companies?
Yes, it works for small, medium, and large trucking businesses.
Click to Purchases Trucking Companies Dashboard in Excel
Visit our YouTube channel to learn step-by-step video tutorials