Video production has become a critical part of modern marketing, entertainment, and digital communication. Organizations constantly create videos for YouTube, social media, online courses, corporate communication, and advertising campaigns. However, producing high-quality videos requires careful planning, resource management, and performance tracking.
Because video production involves multiple stages such as scripting, filming, editing, publishing, and distribution, teams must monitor performance metrics closely. Without structured monitoring, production teams may struggle to measure productivity, evaluate quality, and track project performance.
Therefore, organizations need a structured performance monitoring system that tracks video production KPIs effectively. This is where the Video Production KPI Scorecard in Excel becomes extremely valuable.
The Video Production KPI Scorecard in Excel is a ready-to-use Excel template designed to help video production teams track performance metrics, compare targets with actual results, and analyze production trends. Because this scorecard combines structured KPI tracking with visual indicators, managers can quickly evaluate performance and make data-driven decisions.
In this comprehensive guide, you will learn everything about the Video Production KPI Scorecard in Excel, including its features, advantages, best practices, and implementation strategies.
Click to Purchases Video Production KPI Scorecard in Excel
What Is a Video Production KPI Scorecard in Excel?
A Video Production KPI Scorecard in Excel is a performance monitoring tool designed to track key performance indicators related to video production processes.
This scorecard collects data related to production performance and displays it in structured tables, charts, and visual indicators.
Because Excel provides dynamic reporting and automation features, production managers can easily analyze video production performance.
The scorecard helps teams monitor:
-
Video production efficiency
-
Production timelines
-
Content performance metrics
-
Production costs
-
Target achievement rates
-
Monthly and yearly performance trends
As a result, video production teams can improve productivity and maintain content quality.
Click to Purchases Video Production KPI Scorecard in Excel
Why Do Video Production Teams Need a KPI Scorecard?
Video production teams often manage multiple projects simultaneously. Without structured KPI monitoring, managing these projects becomes challenging.
Common challenges include:
-
Difficulty tracking production performance
-
Poor visibility into production timelines
-
Limited insights into content productivity
-
Lack of structured reporting
-
Difficulty comparing targets with actual results
Because of these issues, production managers cannot easily evaluate team performance.
However, the Video Production KPI Scorecard in Excel solves these challenges by providing a centralized performance monitoring system.
With this scorecard, teams can:
-
Track production KPIs efficiently
-
Compare actual performance with targets
-
Monitor monthly and yearly trends
-
Identify production bottlenecks
-
Improve team productivity
Consequently, production teams can produce high-quality content more efficiently.
Click to Purchases Video Production KPI Scorecard in Excel
Key Features of the Video Production KPI Scorecard in Excel
The Video Production KPI Scorecard in Excel includes four structured worksheets that help teams monitor performance effectively.
Each worksheet performs a specific role in the KPI monitoring process.
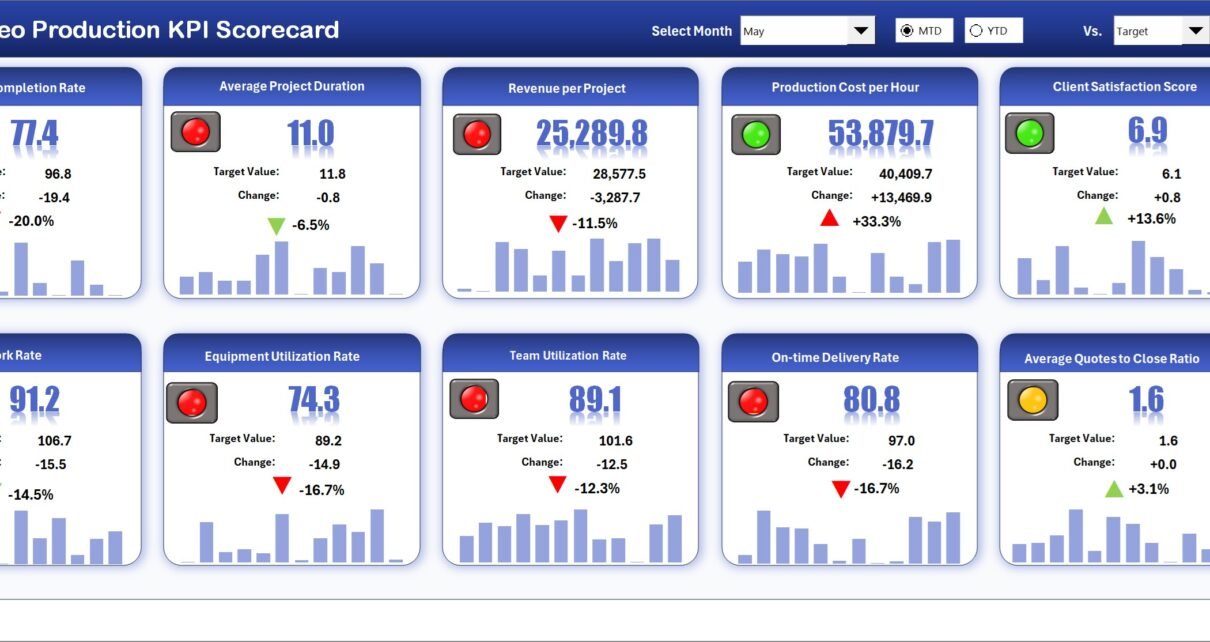
Scorecard Sheet – Main KPI Dashboard
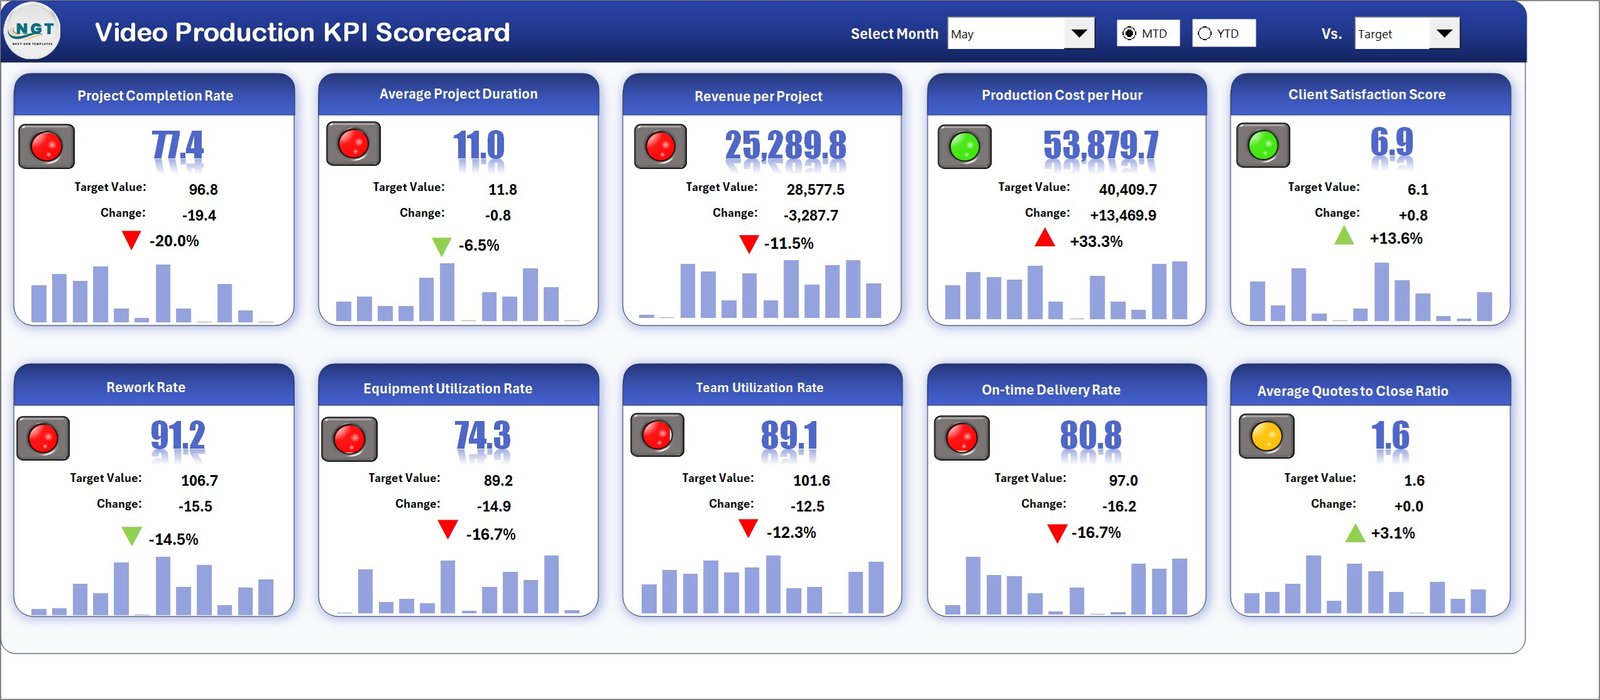
The Scorecard Sheet serves as the main interface where users monitor KPI performance.
This sheet provides a comprehensive overview of all video production KPIs.
Users can easily analyze production performance through dynamic controls and visual indicators.
Dropdown Selection Options
The scorecard includes dropdown menus that allow users to customize performance analysis.
Users can select:
-
Month
-
MTD (Month-to-Date)
-
YTD (Year-to-Date)
Once a selection is made, the scorecard automatically updates the displayed KPI values.
Because of this dynamic feature, managers can quickly evaluate production performance across different time periods.
Actual vs Target Comparison
The scorecard allows users to compare actual results with target values.
For every KPI, the scorecard displays:
-
Actual value
-
Target value
-
Performance comparison
This comparison helps production managers determine whether performance goals are achieved.
Visual Performance Indicators
The template includes color-coded visual indicators that highlight KPI performance.
Conditional formatting automatically displays performance status using colors.
For example:
-
Green indicators show KPIs performing well.
-
Red indicators highlight KPIs that require attention.
Because of these visual signals, managers can quickly identify performance gaps.
Comprehensive KPI Overview
The scorecard provides detailed KPI information including:
-
KPI performance for MTD
-
KPI performance for YTD
-
Target vs actual comparisons
-
Visual status indicators
This comprehensive overview allows decision-makers to evaluate performance instantly.
Click to Purchases Video Production KPI Scorecard in Excel
KPI Trend Sheet – Performance Trend Analysis
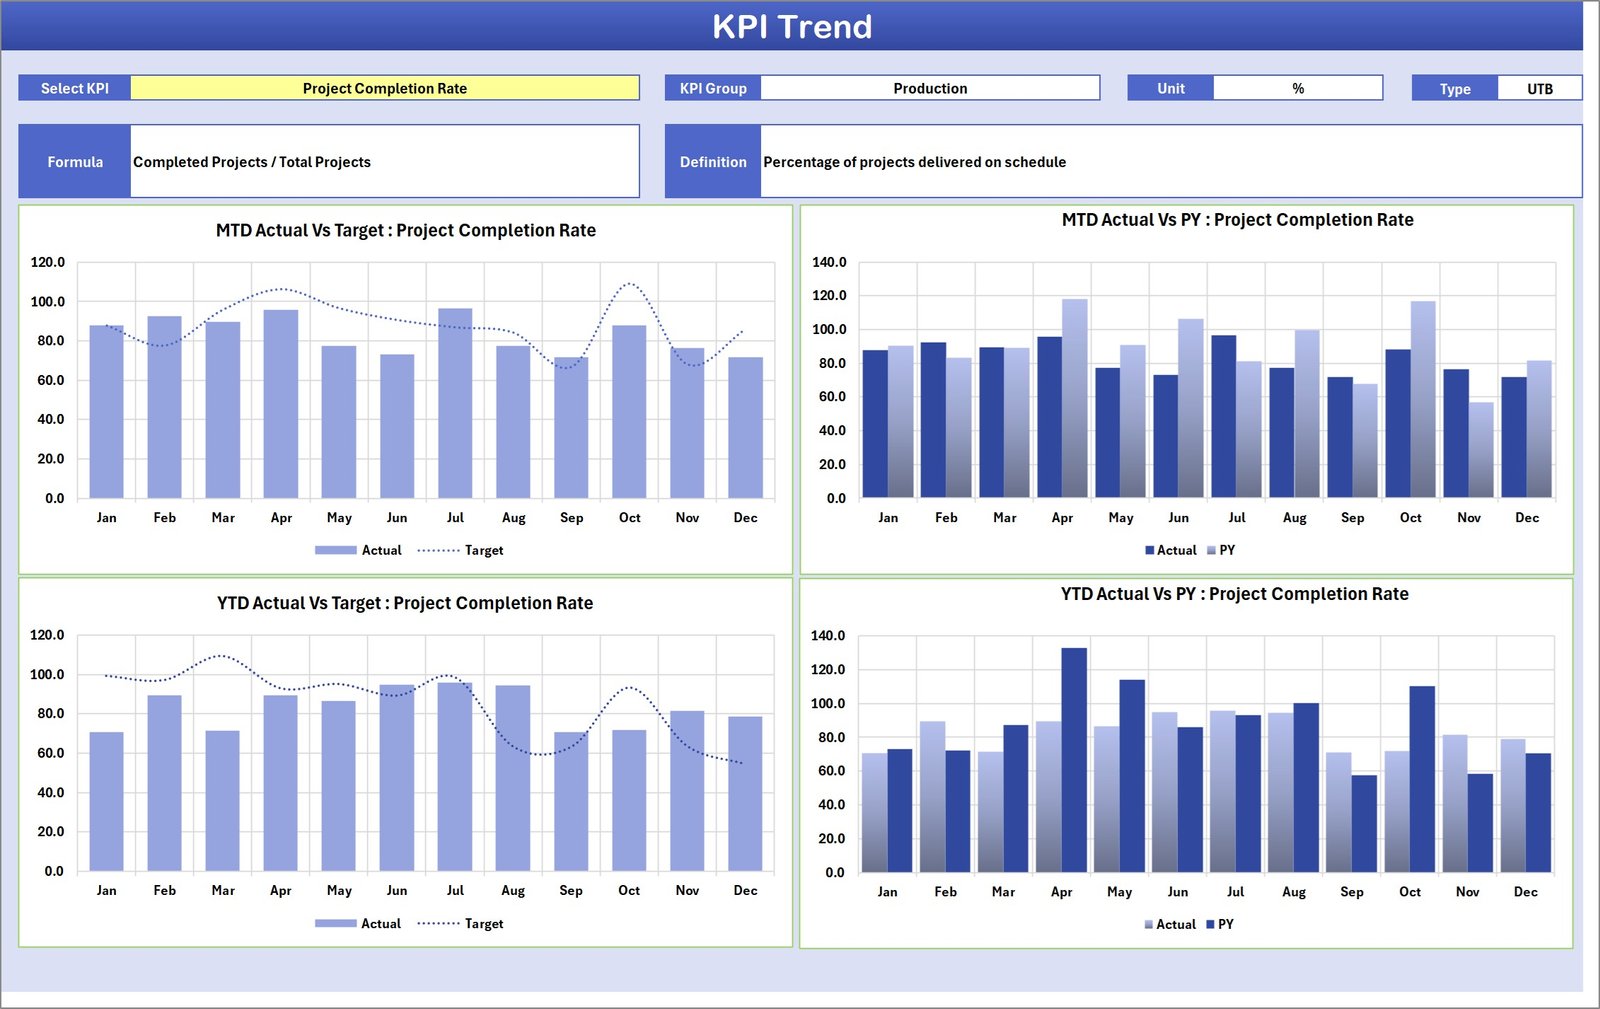
The KPI Trend Sheet provides deeper insights into the performance of individual KPIs.
This sheet allows users to analyze how KPI values change over time.
KPI Selection
Users can select a KPI from the dropdown list available in cell C3.
Once a KPI is selected, the sheet displays detailed KPI information.
KPI Information Displayed
The dashboard shows:
-
KPI Group
-
KPI Unit
-
KPI Type
-
KPI Formula
-
KPI Definition
This information helps users understand how each KPI is calculated and interpreted.
Trend Charts
The sheet also includes MTD and YTD trend charts.
These charts display the following data:
-
Actual performance values
-
Target values
-
Previous year values
Because these charts combine multiple performance indicators, they provide a clear view of performance trends.
Managers can easily identify whether production performance is improving or declining.
Click to Purchases Video Production KPI Scorecard in Excel
Input Data Sheet – Data Entry Section
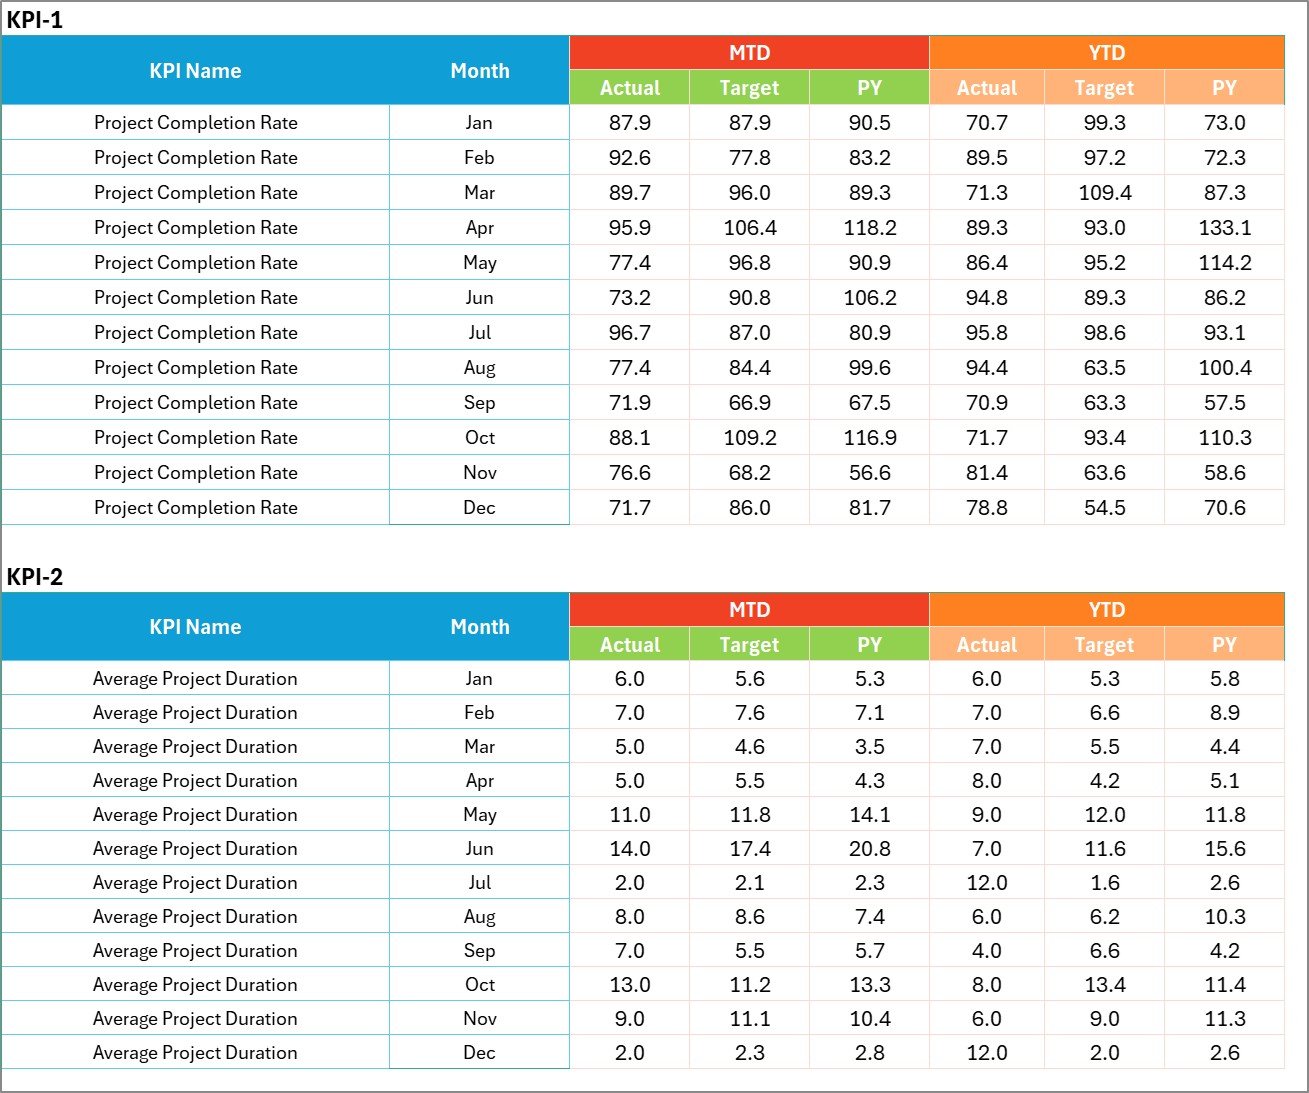
The Input Data Sheet is the primary location for entering KPI data.
Users record performance values here.
Data Entry Features
The sheet allows users to input:
-
Actual KPI values
-
Target values
-
Other performance metrics
Because the dashboard automatically connects to this sheet, any updates immediately reflect in the scorecard.
This structure ensures that the KPI scorecard always displays current performance data.
Click to Purchases Video Production KPI Scorecard in Excel
KPI Definition Sheet – KPI Information Database
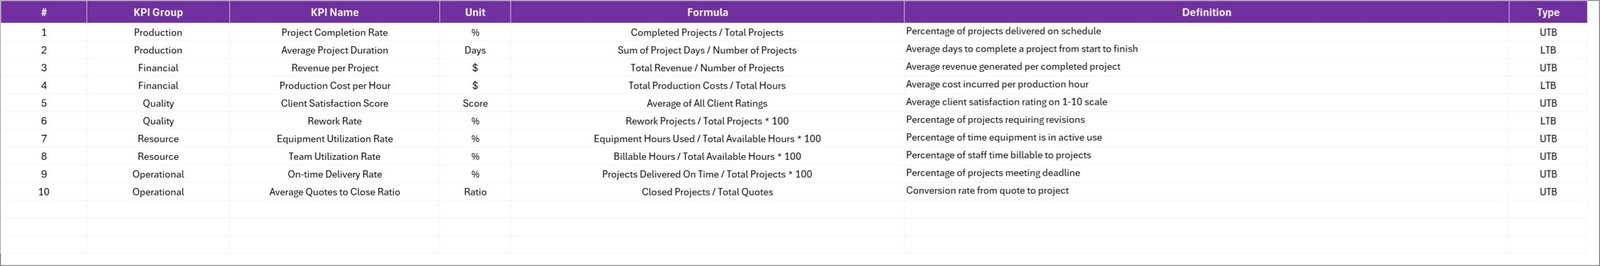
The KPI Definition Sheet stores detailed information about each KPI.
Users must enter the following information:
-
KPI Name
-
KPI Group
-
Unit of measurement
-
KPI Formula
-
KPI Definition
This sheet standardizes KPI definitions across the organization.
As a result, all users understand how KPIs are calculated.
Click to Purchases Video Production KPI Scorecard in Excel
Advantages of Video Production KPI Scorecard in Excel
Implementing a KPI scorecard offers several benefits for video production teams.
Centralized Performance Monitoring
All video production KPIs are tracked in one structured system.
Faster Decision Making
Visual indicators allow managers to identify performance issues quickly.
Improved Productivity
Tracking KPIs helps teams improve production efficiency.
Clear Performance Insights
MTD and YTD comparisons provide deeper performance insights.
Easy Data Management
Excel allows users to update data easily.
Better Strategic Planning
Historical trends help managers plan future production activities.
Opportunities for Improvement in Video Production Analytics
Although this scorecard provides powerful analytics, organizations can enhance it further.
Integrate Video Platform Analytics
Connecting data from platforms like YouTube or Vimeo can provide deeper insights.
Add Audience Engagement Metrics
Tracking views, watch time, and engagement rates improves performance analysis.
Implement Automation
Automating data collection can reduce manual data entry.
Use Predictive Analytics
Predictive models can forecast video performance trends.
Click to Purchases Video Production KPI Scorecard in Excel
Best Practices for Using a Video Production KPI Scorecard
Organizations should follow best practices to maximize the effectiveness of the scorecard.
Define Clear KPIs
Examples include:
-
Video production time
-
Content completion rate
-
Cost per video
-
Publishing frequency
-
Video engagement metrics
Maintain Data Accuracy
Accurate data ensures reliable reports.
Update Data Regularly
Frequent updates ensure the scorecard reflects current performance.
Standardize KPI Definitions
Clearly defined KPIs improve consistency.
Train Team Members
Teams should understand how to use the scorecard effectively.
Click to Purchases Video Production KPI Scorecard in Excel
How to Implement the Video Production KPI Scorecard
Organizations can implement the scorecard through the following steps.
Step 1 – Identify Key KPIs
Determine which metrics best measure production performance.
Step 2 – Collect Data
Gather production data from project management tools and analytics systems.
Step 3 – Enter Data into Excel
Input KPI values into the Input Data sheet.
Step 4 – Analyze Performance
Use the scorecard and trend charts to analyze results.
Step 5 – Improve Production Processes
Use insights to optimize workflows and improve efficiency.
Conclusion
Video production plays a major role in digital marketing, entertainment, and corporate communication. Because production teams handle multiple projects simultaneously, performance monitoring becomes essential.
The Video Production KPI Scorecard in Excel provides a powerful solution for tracking production performance and evaluating KPI results.
This scorecard centralizes KPI monitoring, compares targets with actual results, and displays performance trends through visual charts.
By implementing this scorecard, video production teams can improve productivity, optimize workflows, and achieve better content performance.
Click to Purchases Video Production KPI Scorecard in Excel
Frequently Asked Questions (FAQs)
What is a Video Production KPI Scorecard?
A Video Production KPI Scorecard is a performance monitoring tool used to track production metrics and evaluate team productivity.
Why should video production teams use a KPI scorecard?
A KPI scorecard provides structured performance monitoring and helps teams improve production efficiency.
What KPIs are important for video production?
Common KPIs include:
-
Video completion rate
-
Production cycle time
-
Cost per video
-
Publishing frequency
-
Content engagement metrics
Can Excel handle video production performance tracking?
Yes. Excel provides powerful tools for data analysis, visualization, and reporting.
How often should the scorecard be updated?
Teams should update KPI data regularly, typically monthly or weekly.
Click to Purchases Video Production KPI Scorecard in Excel
Visit our YouTube channel to learn step-by-step video tutorials