Water scarcity continues to grow across cities, industries, and communities. Therefore, organizations can no longer depend on assumptions or manual registers to manage water harvesting initiatives. Instead, they need clarity, structure, and measurable performance tracking. That is exactly where a Water Harvesting KPI Dashboard in Excel becomes a powerful and practical solution.
In this detailed guide, you will learn what a Water Harvesting KPI Dashboard in Excel is, how it works, why it matters, and how different teams can use it to monitor performance with confidence. Moreover, this article explains each worksheet, highlights advantages, shares best practices, and answers common questions at the end.
Click to Purchases Water Harvesting KPI Dashboard in Excel
What Is a Water Harvesting KPI Dashboard in Excel?
A Water Harvesting KPI Dashboard in Excel is a ready-to-use performance monitoring tool designed to track key indicators related to water harvesting, conservation, and usage efficiency. Instead of managing scattered spreadsheets or handwritten logs, this dashboard brings all KPIs into one structured and interactive Excel file.
Moreover, the dashboard converts raw water data into meaningful insights using automated calculations, conditional formatting, and trend analysis. As a result, users gain a clear view of water harvesting performance at both monthly and yearly levels.
Why Do Water Harvesting Projects Need KPI Dashboards?
Water harvesting initiatives involve targets, seasonal variations, and long-term goals. However, without proper tracking, teams struggle to understand whether efforts deliver real impact.
A KPI dashboard helps because it:
-
Tracks water harvesting performance consistently
-
Compares actual results with targets
-
Highlights underperforming areas early
-
Supports sustainability and compliance goals
-
Improves decision-making with real data
Therefore, a structured Excel dashboard becomes essential for water management teams.
How Does a Water Harvesting KPI Dashboard in Excel Work?
This dashboard works entirely within Microsoft Excel. You only need to input actual values, targets, and previous-year numbers in dedicated sheets. After that, the dashboard automatically updates all calculations, comparisons, and visuals.
Moreover, users can select a specific month to analyze performance. Consequently, the dashboard instantly refreshes MTD and YTD numbers across all KPIs.
Because Excel remains familiar to most users, this solution requires no complex tools or technical training.
Click to Purchases Water Harvesting KPI Dashboard in Excel
Key Features of the Water Harvesting KPI Dashboard in Excel
This dashboard includes 7 well-structured worksheets, each serving a specific purpose in the analysis workflow.
What Is the Purpose of the Home Sheet?

Home Sheet: Easy Navigation Hub
The Home sheet acts as an index page for the entire dashboard.
Key features include:
-
Six navigation buttons
-
One-click access to all major worksheets
-
Clean and user-friendly layout
As a result, users can move between sheets quickly without confusion.
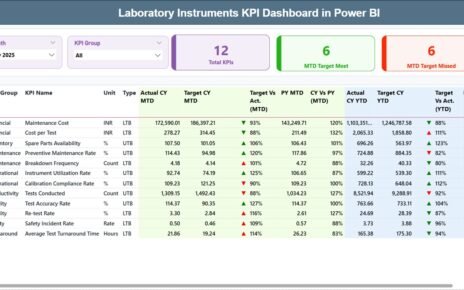
What Can You Analyze on the Dashboard Sheet?

Dashboard Sheet: Central Performance Overview
The Dashboard sheet serves as the main analysis page.
Month Selection for Dynamic Analysis
On cell D3, users can select the month from a drop-down list. Once selected, the entire dashboard updates automatically for that month.
Therefore, monthly reviews become fast and accurate.
KPI Performance Metrics Displayed
The dashboard displays the following metrics for each KPI:
Month-to-Date (MTD) Metrics
-
MTD Actual – Actual water harvesting value for the selected month
-
MTD Target – Target value for the selected month
-
MTD Previous Year – Same month value from the previous year
-
Target vs Actual (MTD) – Performance percentage
-
PY vs Actual (MTD) – Year-over-year comparison
Moreover, conditional formatting arrows (▲ / ▼) with green and red colors clearly show whether performance meets expectations.
Year-to-Date (YTD) Metrics
-
YTD Actual – Cumulative actual value for the year
-
YTD Target – Cumulative target value
-
YTD Previous Year – Previous year cumulative value
-
Target vs Actual (YTD) – Achievement percentage
-
PY vs Actual (YTD) – Growth or decline indicator
As a result, users can track both short-term and long-term performance clearly.
How Does the KPI Trend Sheet Help Decision-Making?

KPI Trend Sheet: Deep Performance Analysis
The KPI Trend sheet focuses on detailed KPI-level analysis.
KPI Selection for Focused Insights
On cell C3, users can select a KPI name from a drop-down list. Instantly, all related details and charts update.
KPI Details Displayed
For the selected KPI, the dashboard shows:
-
KPI Group
-
Unit of Measurement
-
KPI Type (Lower the Better or Upper the Better)
-
KPI Formula
-
KPI Definition
Therefore, users always understand what each KPI represents.
Trend Charts for MTD and YTD
This sheet also displays:
-
MTD Trend Chart – Actual vs Target vs Previous Year
-
YTD Trend Chart – Actual vs Target vs Previous Year
These charts help identify:
-
Seasonal patterns
-
Performance gaps
-
Improvement trends
-
Long-term impact
Consequently, planning becomes more data-driven.
Click to Purchases Water Harvesting KPI Dashboard in Excel
How Do You Enter Data in the Actual Numbers Input Sheet?

Actual Numbers Input Sheet: Recording Real Performance
In the Actual Numbers Input sheet, users enter real water harvesting data.
Key steps include:
-
Set the first month of the year in cell E1
-
Enter MTD actual values for each KPI
-
Enter YTD actual values for each KPI
Once entered, all dashboards update automatically.
What Is the Role of the Target Sheet?

Target Sheet: Setting Performance Expectations
The Target Sheet allows users to define expected performance levels.
In this sheet, users enter:
-
KPI-wise MTD targets
-
KPI-wise YTD targets
-
Monthly target values
As a result, the dashboard can calculate achievement percentages accurately.
Click to Purchases Water Harvesting KPI Dashboard in Excel
Why Is the Previous Year Number Sheet Important?

Previous Year Number Sheet: Historical Comparison
This sheet stores previous year data for the same KPIs.
Users enter:
-
MTD values for each KPI
-
YTD values for each KPI
Therefore, the dashboard can perform meaningful year-over-year comparisons.
What Information Goes into the KPI Definition Sheet?

KPI Definition Sheet: KPI Clarity and Consistency
The KPI Definition sheet defines each KPI clearly.
It includes:
-
KPI Name
-
KPI Group
-
Unit of Measurement
-
Formula
-
KPI Definition
This sheet ensures everyone interprets KPIs the same way.
Advantages of Water Harvesting KPI Dashboard in Excel
Using this dashboard delivers several practical benefits.
Clear Visibility of Water Performance
-
View all KPIs on one screen
-
Identify high and low performance instantly
Better Decision-Making
-
Compare actual values with targets
-
Track improvement or decline quickly
Time and Effort Savings
-
No manual calculations
-
Automatic updates across all sheets
Improved Accountability
-
Track responsibility for each KPI
-
Monitor progress regularly
Flexible and Scalable Design
-
Add new KPIs easily
-
Adjust targets without redesign
Who Can Use a Water Harvesting KPI Dashboard in Excel?
This dashboard suits a wide range of users, including:
-
Municipal corporations
-
Industrial water management teams
-
Facility managers
-
Sustainability officers
-
Environmental consultants
-
Educational institutions
Because Excel remains widely used, anyone can adopt this dashboard easily.
How Does This Dashboard Support Sustainability Goals?
Water sustainability requires continuous monitoring and improvement. This dashboard supports sustainability by:
-
Tracking water conservation efforts
-
Highlighting efficiency improvements
-
Supporting compliance reporting
-
Encouraging data-driven actions
Therefore, organizations can align operations with long-term environmental goals.
Click to Purchases Water Harvesting KPI Dashboard in Excel
Best Practices for the Water Harvesting KPI Dashboard in Excel
To maximize value, follow these best practices.
Define KPIs Clearly
Always write simple and clear KPI definitions. As a result, users avoid confusion.
Update Data Regularly
Enter actual and target data monthly. Therefore, insights remain accurate.
Use Logical KPI Groups
Group KPIs by source, location, or purpose. Consequently, analysis becomes easier.
Review Trends, Not Just Numbers
Focus on MTD and YTD trends. Single values may mislead without context.
Validate Data Before Entry
Check numbers before input. Clean data ensures reliable insights.
How Can This Dashboard Improve Water Harvesting Strategy?
This dashboard turns raw data into actionable insights. As a result, teams can:
-
Identify inefficiencies early
-
Optimize water harvesting systems
-
Improve target planning
-
Demonstrate measurable impact
Therefore, strategy improves continuously instead of reacting late.
Conclusion: Why Should You Use a Water Harvesting KPI Dashboard in Excel?
A Water Harvesting KPI Dashboard in Excel brings structure, clarity, and accountability to water management efforts. By combining simple data input with automated analysis, this dashboard empowers teams to track performance accurately and act confidently.
Moreover, it supports sustainability goals, saves time, and improves long-term planning. If you want reliable insights into water harvesting performance without complex tools, this Excel dashboard becomes the ideal solution.
Frequently Asked Questions (FAQs)
What is a Water Harvesting KPI Dashboard in Excel?
It is an Excel-based tool that tracks water harvesting performance using KPIs, targets, trends, and comparisons.
Do I need advanced Excel skills to use this dashboard?
No. You only need basic Excel knowledge to enter data and view results.
Can I customize KPIs in this dashboard?
Yes. You can add or modify KPIs using the KPI Definition sheet.
How often should I update the dashboard?
You should update it monthly. However, you can update it more frequently if needed.
Does this dashboard support year-over-year comparison?
Yes. It includes previous year MTD and YTD comparisons automatically.
Can this dashboard handle multiple water harvesting sites?
Yes. You can include site-specific KPIs or create separate KPI groups.
Is this dashboard suitable for sustainability reporting?
Yes. It supports sustainability tracking, performance reviews, and compliance reporting.
Click to Purchases Water Harvesting KPI Dashboard in Excel
Visit our YouTube channel to learn step-by-step video tutorials