In today’s fast-moving digital world, web development agencies face intense competition. Clients expect fast delivery. Projects demand quality code. Teams must manage timelines, budgets, and client satisfaction at the same time.However, many agencies still rely on scattered Excel sheets and manual reports. As a result, leaders struggle to track revenue, project delivery, billable hours, and client retention in one place.So, how can web development agencies monitor performance clearly and make faster decisions?You need a Web Development Agencies KPI Dashboard in Excel.This ready-to-use KPI dashboard helps agencies track operational, financial, and client performance in one structured system. Moreover, it simplifies reporting. Therefore, leaders can focus on growth instead of manual tracking.
In this complete guide, you will learn:
- What a Web Development Agencies KPI Dashboard in Excel is
- Why agencies need it
- Key features of the dashboard
- Advantages of using it
- Best practices for implementation
- Frequently asked questions with answers
Click to buy Web Development Agencies KPI Dashboard in Excel
What Is a Web Development Agencies KPI Dashboard in Excel?
A Web Development Agencies KPI Dashboard in Excel is a performance tracking tool designed specifically for web development companies.
It helps agencies:
- Monitor financial performance
- Track project progress
- Measure team productivity
- Analyze client satisfaction
- Compare actual vs target performance
- Review month-to-date (MTD) and year-to-date (YTD) data
Instead of reviewing multiple spreadsheets, managers can see all KPIs in one interactive dashboard. As a result, they can identify gaps quickly and take action immediately.
Why Do Web Development Agencies Need a KPI Dashboard?
Web development agencies manage multiple projects simultaneously. At the same time, they must balance revenue targets, resource allocation, deadlines, and client expectations.
Without structured monitoring:
- Deadlines slip
- Budgets exceed
- Developers remain underutilized
- Client churn increases
- Profit margins shrink
However, when agencies implement a KPI dashboard, they gain control. They see performance trends. They compare targets. They detect risks early.
Therefore, the dashboard does not just show numbers. It drives smarter decisions.
Key Features of Web Development Agencies KPI Dashboard in Excel
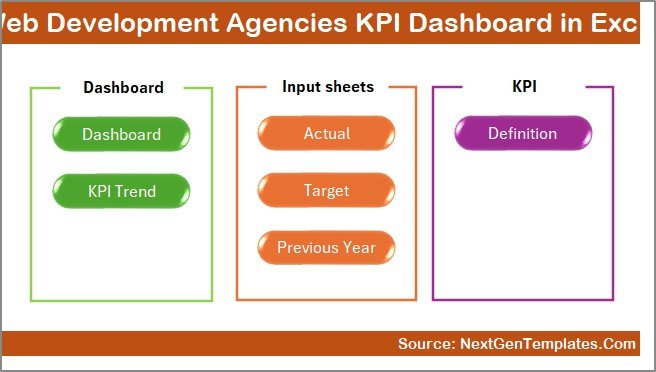
This dashboard includes 7 structured worksheets. Each worksheet serves a specific purpose. Together, they create a complete performance management system.
Summary Page – Your Navigation Center
The Summary page works as an index sheet.
Here, you get:
- 6 navigation buttons
- Quick access to all worksheets
- Smooth user experience
Instead of scrolling through multiple tabs, you can jump directly to any sheet. Therefore, it saves time and improves usability.
Click to buy Web Development Agencies KPI Dashboard in Excel
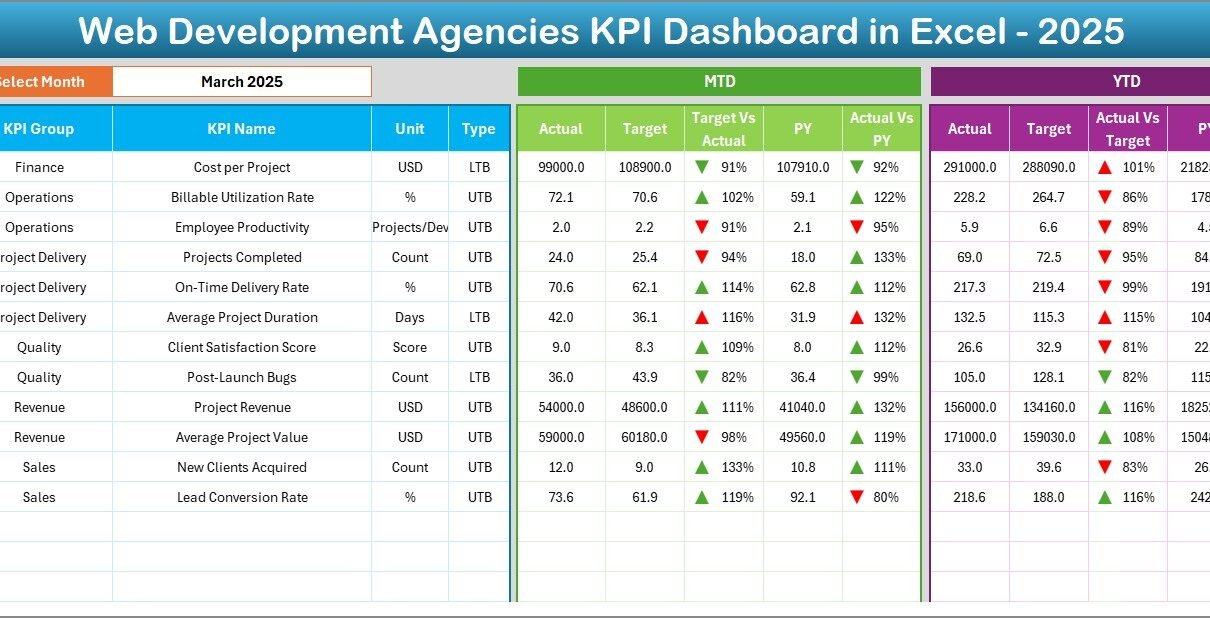
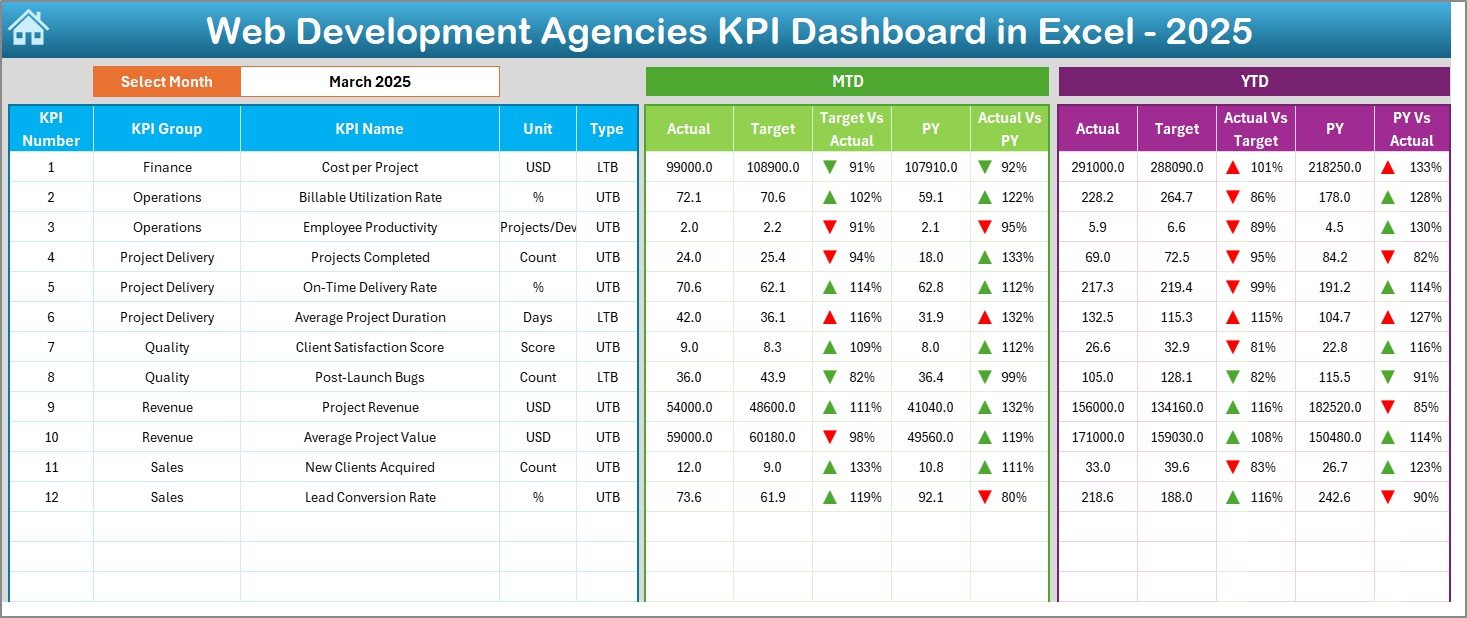
Dashboard Sheet – The Main Control Panel
This sheet acts as the heart of the system.
On Range D3, you can select the month from a drop-down list. Once you select a month, the entire dashboard updates automatically.
What Does This Dashboard Display?
For each KPI, you can view:
- MTD Actual
- MTD Target
- MTD Previous Year
- Target vs Actual comparison
- Previous Year vs Actual comparison
- Conditional formatting with up/down arrows
In addition, you can view:
- YTD Actual
- YTD Target
- YTD Previous Year
- YTD comparisons
Because of visual indicators, managers can instantly identify:
- Performance above target
- Performance below target
- Positive growth trends
- Negative performance gaps
As a result, decision-making becomes faster and data-driven.
Click to buy Web Development Agencies KPI Dashboard in Excel
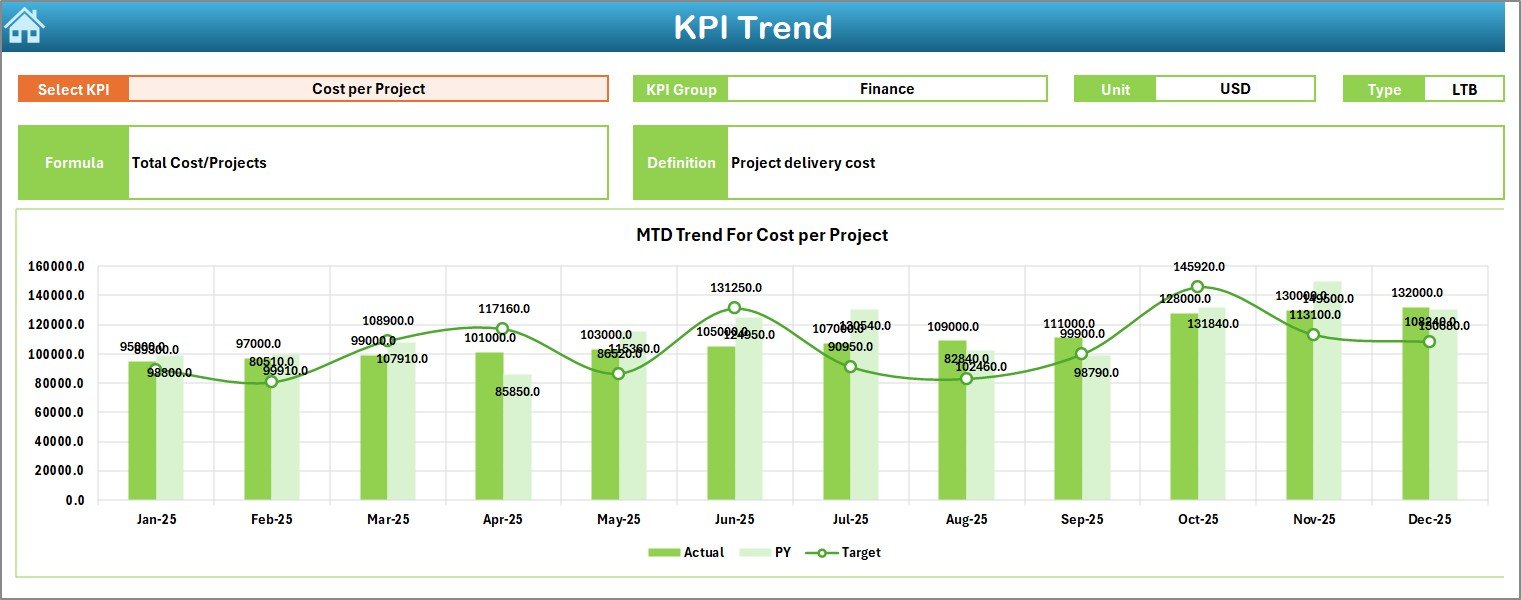
Trend Sheet – Deep Performance Analysis
While the dashboard shows current performance, the Trend sheet shows movement over time.
On Range C3, you can select a specific KPI.
Once selected, the sheet displays:
- KPI Group
- Unit of KPI
- KPI Type (Lower the Better or Upper the Better)
- Formula
- Definition
Additionally, you can see:
- MTD Trend Chart (Actual vs Target vs PY)
- YTD Trend Chart (Actual vs Target vs PY)
Therefore, managers can analyze patterns instead of relying only on one month’s performance.
For example:
- If revenue declines for three consecutive months, leaders can act quickly.
- If billable utilization improves steadily, managers can replicate that strategy.
Click to buy Web Development Agencies KPI Dashboard in Excel
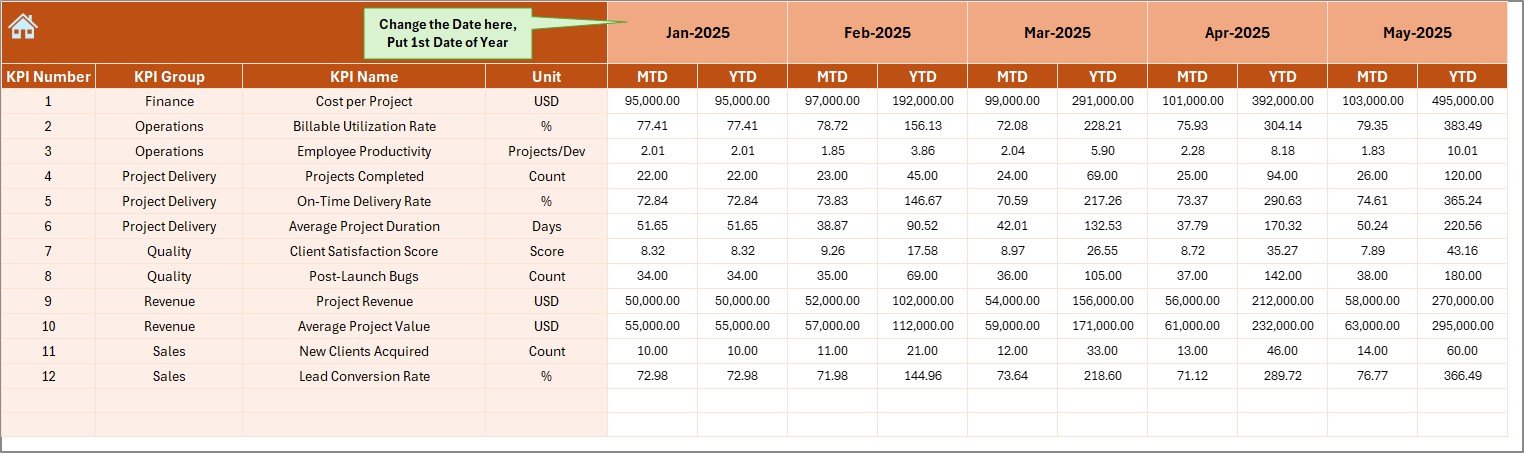
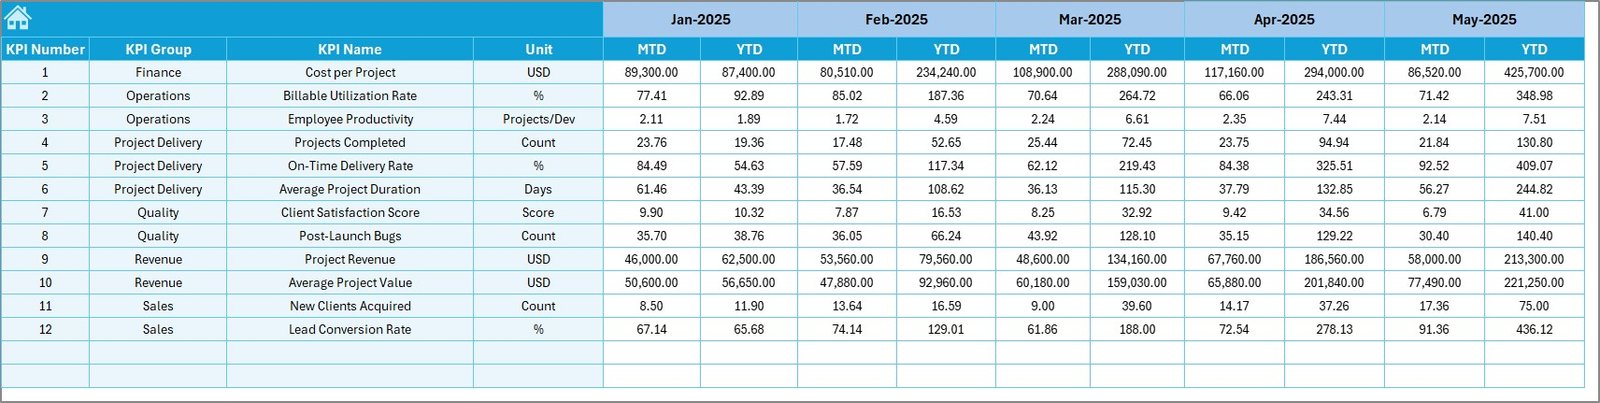
Actual Numbers Input Sheet
This sheet allows you to enter actual performance data.
You can:
- Enter MTD numbers
- Enter YTD numbers
- Select the first month of the year in Range E1
After entering data, the dashboard updates automatically.
Therefore, you do not need complex formulas every time. The structure already handles calculations.
Click to buy Web Development Agencies KPI Dashboard in Excel
Target Sheet Tab
In this sheet, you enter monthly targets for each KPI.
You can define:
- MTD targets
- YTD targets
Because targets drive performance, this sheet plays a crucial role. When teams know their goals clearly, they focus better.
Click to buy Web Development Agencies KPI Dashboard in Excel
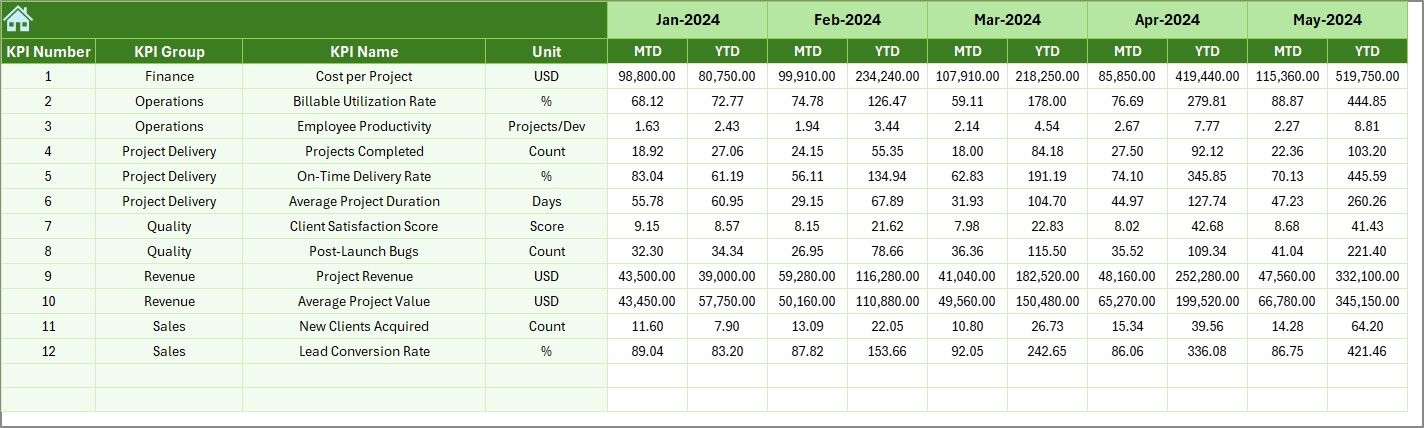
Previous Year Number Sheet
This sheet stores last year’s data.
You enter numbers the same way as the current year.
Then, the dashboard compares:
- Current performance vs Previous year
- Growth trends
- Year-over-year performance
Therefore, you can measure true progress.
Click to buy Web Development Agencies KPI Dashboard in Excel
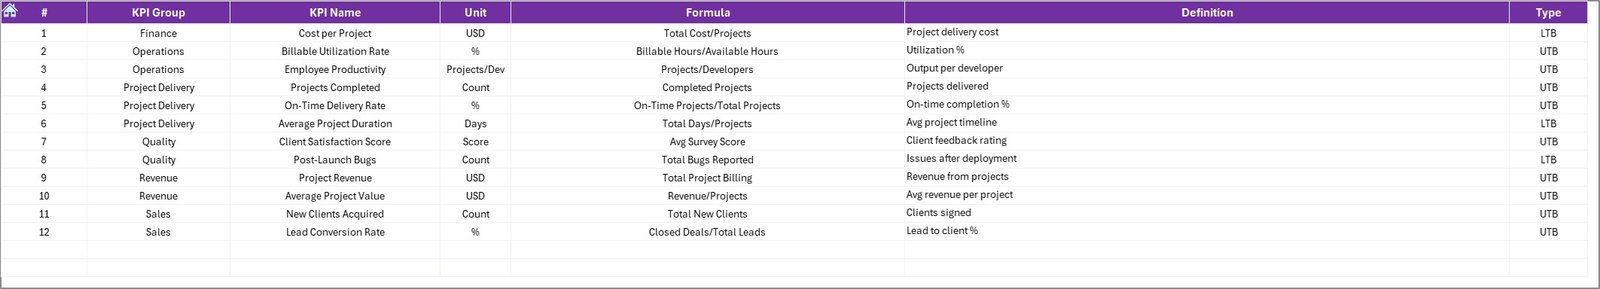
KPI Definition Sheet
This sheet defines each KPI clearly.
You enter:
- KPI Name
- KPI Group
- Unit
- Formula
- Definition
Because clarity improves accountability, this sheet ensures everyone understands what each KPI means.
Click to buy Web Development Agencies KPI Dashboard in Excel
What KPIs Should Web Development Agencies Track?
Although agencies may customize KPIs, they often track:
Financial KPIs
- Revenue Growth
- Gross Profit Margin
- Net Profit Margin
- Average Project Value
- Cost per Project
Operational KPIs
- Project Completion Rate
- On-Time Delivery Rate
- Average Development Time
- Billable Utilization Rate
- Resource Allocation Efficiency
Client KPIs
- Client Retention Rate
- Customer Satisfaction Score
- Repeat Business Rate
- Client Acquisition Cost
When agencies track these KPIs together, they gain a complete view of performance.
Advantages of Web Development Agencies KPI Dashboard in Excel
Now let us explore the key benefits.
- Centralized Performance Monitoring
Instead of managing multiple sheets, you get one unified dashboard. Therefore, reporting becomes easier and faster.
- Real-Time Decision Making
Once you enter data, the dashboard updates immediately. As a result, leaders do not wait for monthly reports.
- Improved Accountability
Because KPIs display clearly, teams understand expectations. Therefore, performance improves.
- Better Financial Control
You can monitor revenue, cost, and profit margins regularly. Consequently, you prevent losses early.
- Easy Customization
Excel allows customization. You can add new KPIs, adjust targets, or change charts easily.
- Cost-Effective Solution
Unlike expensive BI tools, Excel offers a powerful yet affordable solution.
How Does This Dashboard Improve Agency Growth?
Growth depends on visibility.
When you track:
- Billable utilization
- Client retention
- Profit margin
- Delivery performance
You identify strengths and weaknesses.
Moreover, you align strategy with data.
For example:
- If certain project types generate higher margins, you can focus on them.
- If specific teams perform better, you can replicate their process.
Therefore, the dashboard becomes a growth engine.
Best Practices for the Web Development Agencies KPI Dashboard
To maximize results, follow these best practices.
- Define Clear KPIs
Do not track random metrics. Instead, choose KPIs that align with your agency goals.
- Update Data Regularly
Enter actual numbers monthly without delay. Consistency ensures accuracy.
- Review Trends, Not Just Numbers
One month does not show the full picture. Therefore, analyze trend charts carefully.
- Align Targets with Strategy
Set realistic but challenging targets. However, ensure they match growth plans.
- Train Your Team
Explain KPI definitions clearly. When teams understand metrics, performance improves.
- Conduct Monthly Review Meetings
Use the dashboard during leadership meetings. Discuss gaps. Create action plans.
How to Implement This KPI Dashboard Successfully?
Follow these steps:
- Define agency objectives
- Identify relevant KPIs
- Enter KPI definitions
- Input previous year data
- Set monthly targets
- Enter actual performance data
- Review results monthly
When you follow these steps, implementation becomes smooth and effective.
Conclusion
Web development agencies operate in a competitive and fast-changing environment. Therefore, leaders must monitor financial, operational, and client performance consistently.
A Web Development Agencies KPI Dashboard in Excel provides clarity, structure, and control. It centralizes data. It compares actual vs target performance. It analyzes trends. It improves accountability.
Most importantly, it transforms raw data into meaningful insights.
If you want your agency to grow strategically and profitably, you need structured performance tracking. And this KPI dashboard offers exactly that.
Frequently Asked Questions with Answers
- What is a KPI dashboard in Excel?
A KPI dashboard in Excel is a performance tracking tool that displays key metrics in a visual and structured format.
- Can small web agencies use this dashboard?
Yes. Small and large agencies can use it. Moreover, Excel allows easy customization.
- How often should we update the dashboard?
You should update it monthly. However, some agencies prefer weekly updates for faster tracking.
- Does this dashboard require advanced Excel skills?
No. The structure already includes formulas and charts. Therefore, basic Excel knowledge is enough.
- Can we add new KPIs later?
Yes. You can update the KPI Definition sheet and include additional metrics anytime.
- Why should we compare with previous year data?
Because year-over-year comparison shows true growth. Therefore, it helps evaluate long-term progress.
Visit our YouTube channel to learn step-by-step video tutorials
Watch the step-by-step video tutorial:
Click to buy Web Development Agencies KPI Dashboard in Excel