Women empowerment NGOs work every single day to create change. They support education, provide skill training, improve healthcare access, and protect rights. However, while the mission feels powerful, tracking performance often feels confusing.
Many NGOs still rely on scattered Excel files, manual reports, and unstructured data. As a result, leaders struggle to measure real impact. Moreover, donors expect transparency. At the same time, teams need clear numbers to make better decisions.
So, how can women empowerment NGOs measure progress in a structured, professional, and simple way?
The answer is clear.
You need a Women Empowerment NGOs KPI Dashboard in Excel.
This ready-to-use Excel dashboard helps NGOs monitor KPIs, compare targets vs actual performance, track month-to-date (MTD) and year-to-date (YTD) progress, and analyze trends — all in one powerful system.
In this complete guide, you will learn:
-
What a Women Empowerment NGOs KPI Dashboard in Excel is
-
Why NGOs need it
-
A detailed explanation of all 7 worksheets
-
Key KPIs you can track
-
Advantages of the dashboard
-
Best practices for using it
-
Frequently Asked Questions
Let’s explore everything step by step.
Click to Purchases Women Empowerment NGOs KPI Dashboard in Excel
What Is a Women Empowerment NGOs KPI Dashboard in Excel?
A Women Empowerment NGOs KPI Dashboard in Excel is a structured performance tracking system. It allows NGOs to monitor key performance indicators (KPIs) related to education, health, skill development, financial inclusion, awareness programs, and social impact.
Instead of checking multiple reports, you can see everything in one place. Moreover, you can compare:
-
MTD Actual vs Target
-
YTD Actual vs Target
-
Previous Year (PY) vs Current Year
-
Performance trends over time
Therefore, you gain clarity. At the same time, you improve accountability.
Why Do Women Empowerment NGOs Need a KPI Dashboard?
NGOs operate in complex environments. They manage beneficiaries, volunteers, training programs, funding, and community projects. However, without structured data, leaders cannot measure progress accurately.
Here’s why a KPI dashboard becomes essential:
-
Donors demand transparency
-
Boards require measurable results
-
Teams need clear direction
-
Programs require performance tracking
-
Impact measurement improves funding opportunities
Furthermore, when you use a KPI dashboard:
-
You reduce manual reporting errors
-
You save time
-
You increase decision-making speed
-
You align activities with strategic goals
As a result, your NGO operates more professionally and efficiently.
Click to Purchases Women Empowerment NGOs KPI Dashboard in Excel
Complete Explanation of All 7 Worksheets
Now let’s understand how this Women Empowerment NGOs KPI Dashboard in Excel works.
1️⃣ Home Sheet – Your Navigation Center
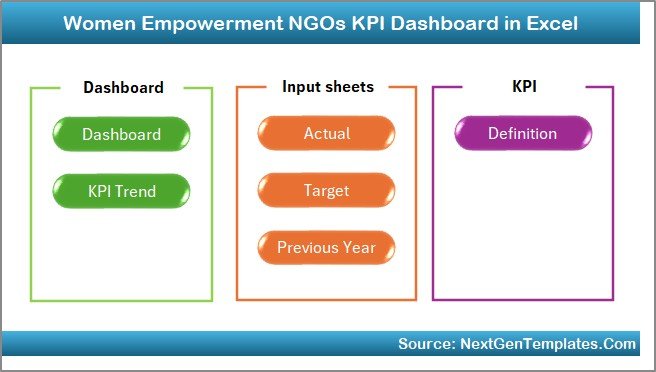
The Home sheet acts as an index page.
Here, you get 6 interactive buttons. These buttons allow you to jump directly to:
-
Dashboard
-
KPI Trend
-
Actual Input
-
Target Sheet
-
Previous Year Sheet
-
KPI Definition
Therefore, you move between sheets instantly without searching manually.
This design improves usability. Moreover, it creates a professional user experience.
Click to Purchases Women Empowerment NGOs KPI Dashboard in Excel
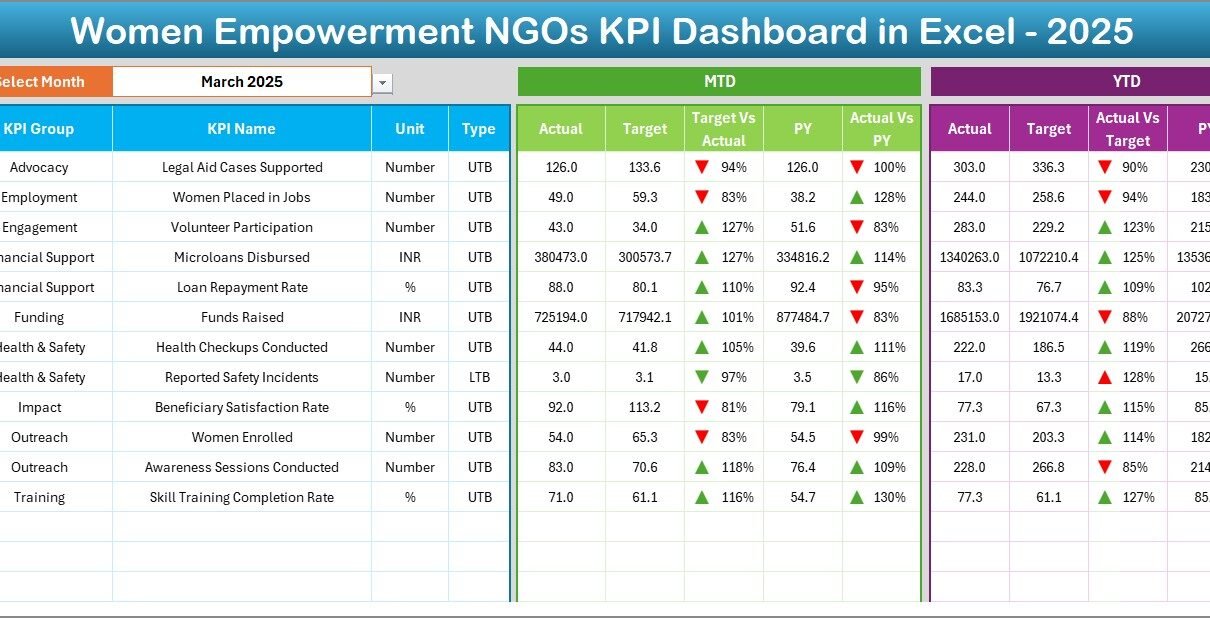
2️⃣ Dashboard Sheet – The Main Performance Overview
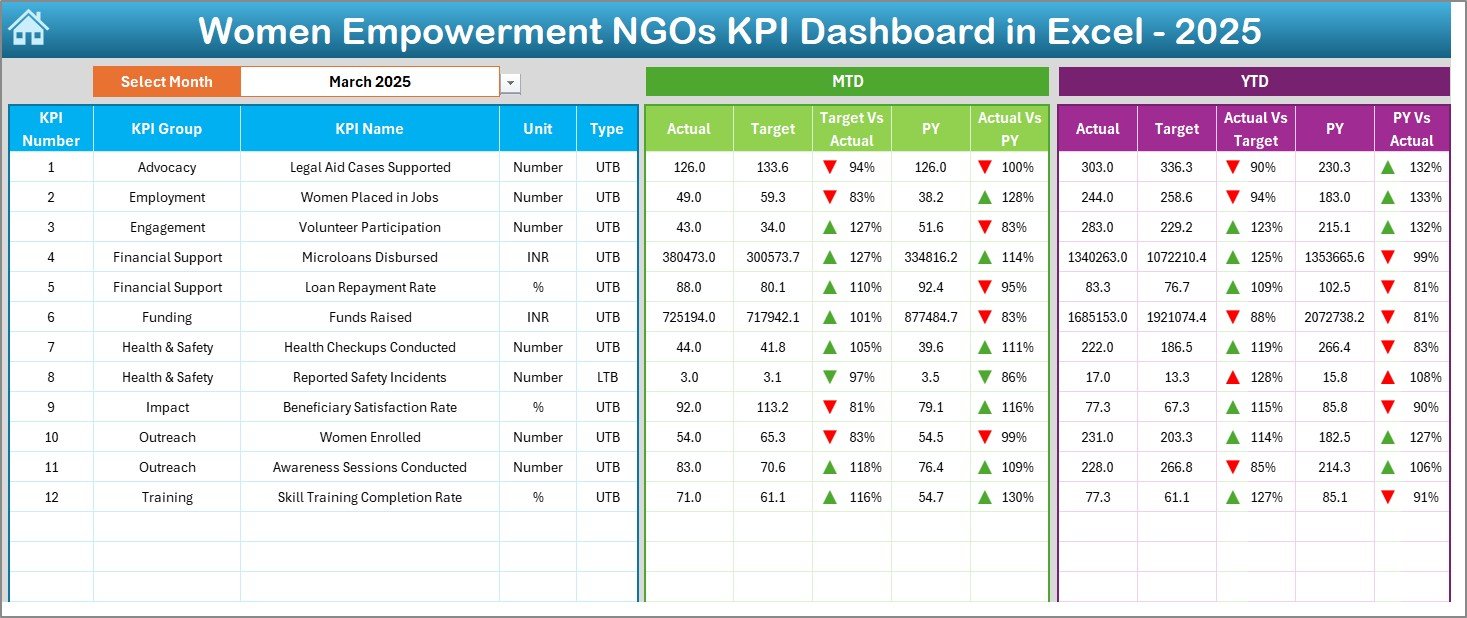
This sheet serves as the heart of the system.
Here, you can view all KPIs in one structured format.
Key Features:
-
Select Month from cell D3 (Dropdown)
-
Entire dashboard updates automatically
-
MTD Actual vs Target comparison
-
YTD Actual vs Target comparison
-
Previous Year comparison
-
Conditional formatting arrows (Up/Down indicators)
What Does It Show?
For each KPI, you see:
-
MTD Actual
-
MTD Target
-
MTD Previous Year
-
Target vs Actual variance
-
PY vs Actual variance
Additionally, you see:
-
YTD Actual
-
YTD Target
-
YTD Previous Year
-
Target vs Actual variance
-
PY vs Actual variance
Because of visual arrows, you instantly identify whether performance improves or declines.
As a result, leaders make faster decisions.
Click to Purchases Women Empowerment NGOs KPI Dashboard in Excel
3️⃣ KPI Trend Sheet – Analyze Performance Over Time
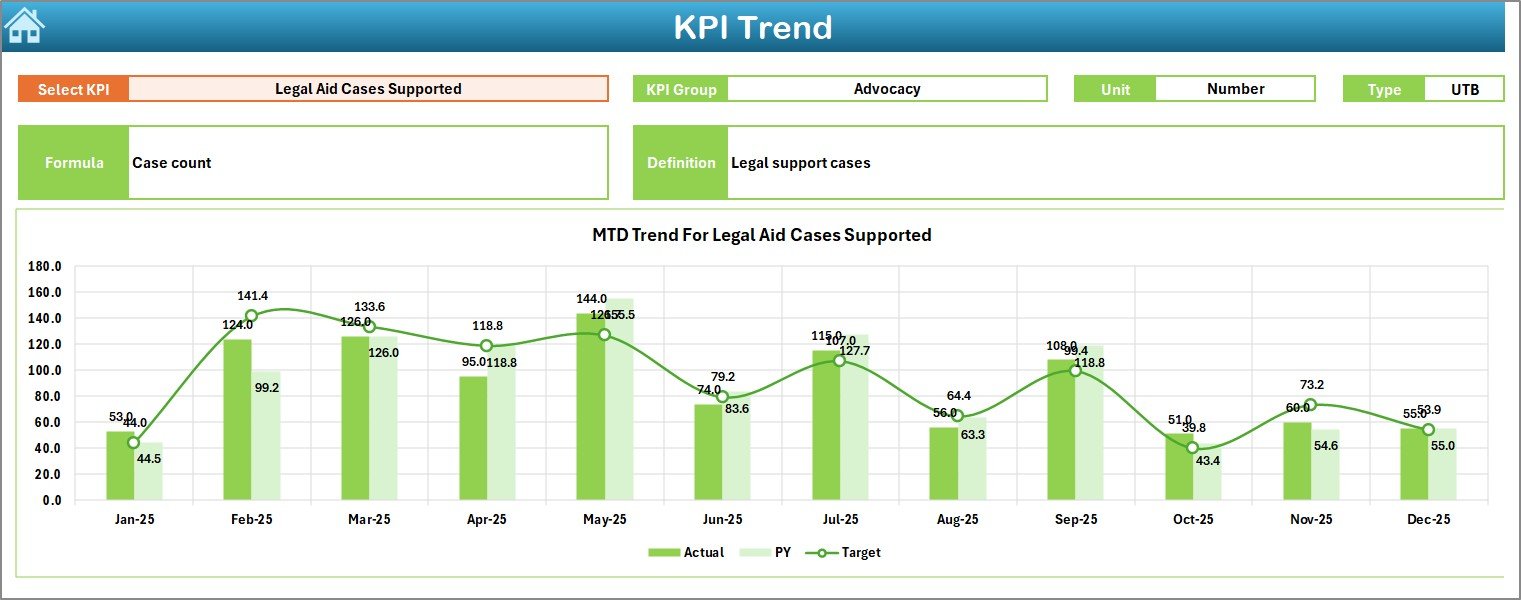
While the Dashboard gives a summary, the KPI Trend sheet gives deeper insight.
Here, you can:
-
Select KPI Name from dropdown (Cell C3)
-
View KPI Group
-
See Unit of KPI
-
Check KPI Type (Lower the Better / Upper the Better)
-
Review Formula
-
Read KPI Definition
Moreover, you see trend charts for:
-
MTD Actual vs Target vs PY
-
YTD Actual vs Target vs PY
Therefore, you do not just see numbers. You understand patterns.
For example:
-
Are skill training enrollments increasing monthly?
-
Does beneficiary satisfaction improve?
-
Do dropout rates decline?
Trend analysis helps you answer these questions clearly.
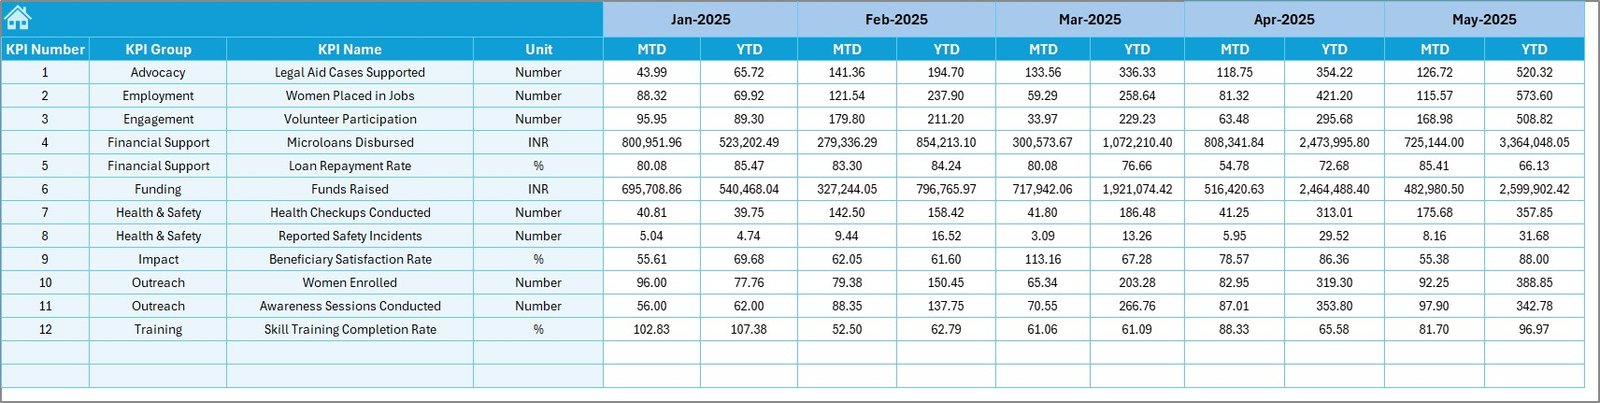
4️⃣ Actual Numbers Input Sheet – Enter Current Year Data
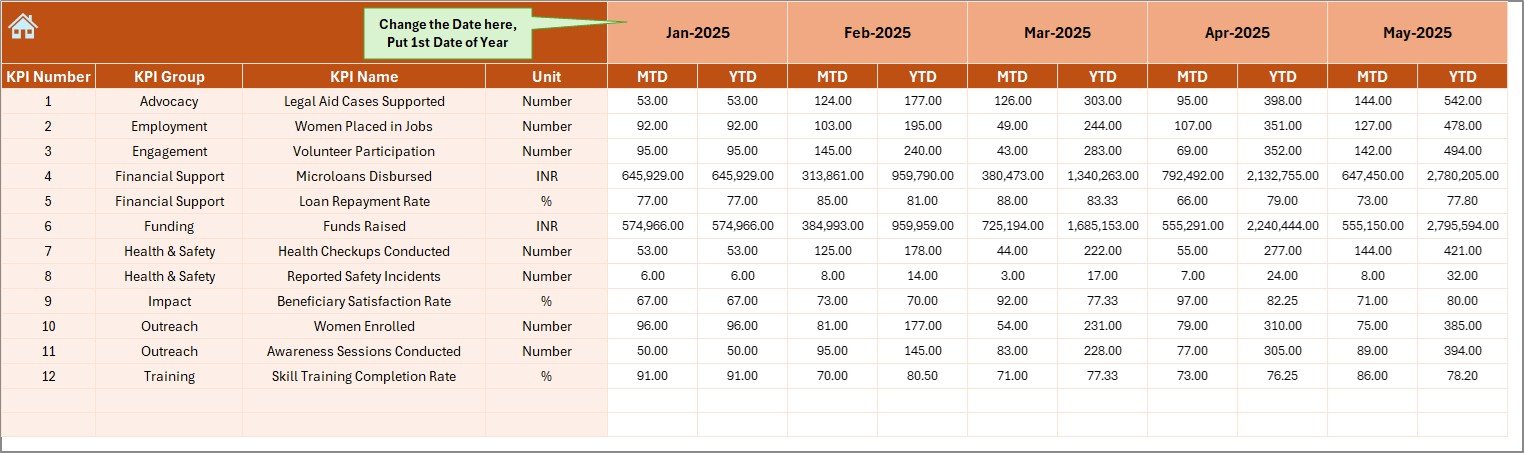
This sheet allows you to enter actual performance numbers.
How It Works:
-
Select first month in cell E1
-
Enter MTD and YTD values for each KPI
-
Update monthly data easily
Because the dashboard connects directly to this sheet, every update reflects automatically.
Therefore, reporting becomes simple and consistent.
Click to Purchases Women Empowerment NGOs KPI Dashboard in Excel
5️⃣ Target Sheet – Define Your Goals
Performance tracking becomes meaningful only when you compare it with targets.
In this sheet, you:
-
Enter monthly MTD targets
-
Enter YTD targets
-
Set goals for each KPI
By defining clear targets, you create direction.
Moreover, your team understands expected performance levels.
6️⃣ Previous Year Sheet – Historical Comparison
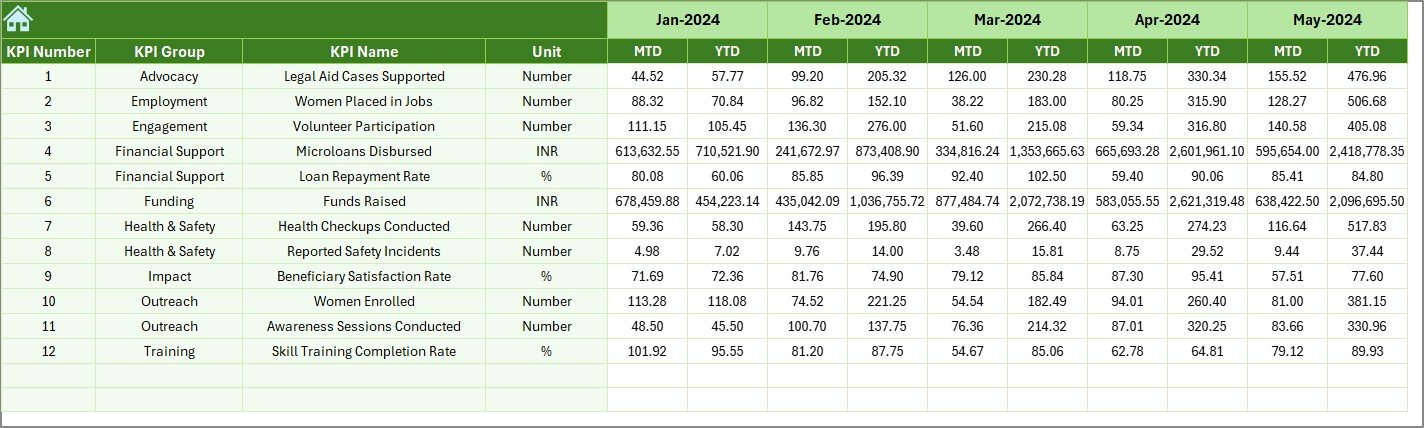
Progress becomes clear when you compare current data with previous year performance.
Here, you:
-
Enter last year’s MTD data
-
Enter last year’s YTD data
Then, the dashboard shows:
-
PY vs Actual comparison
-
Growth percentage
-
Performance movement
Therefore, you measure real impact over time.
Click to Purchases Women Empowerment NGOs KPI Dashboard in Excel
7️⃣ KPI Definition Sheet – Maintain Clarity and Consistency
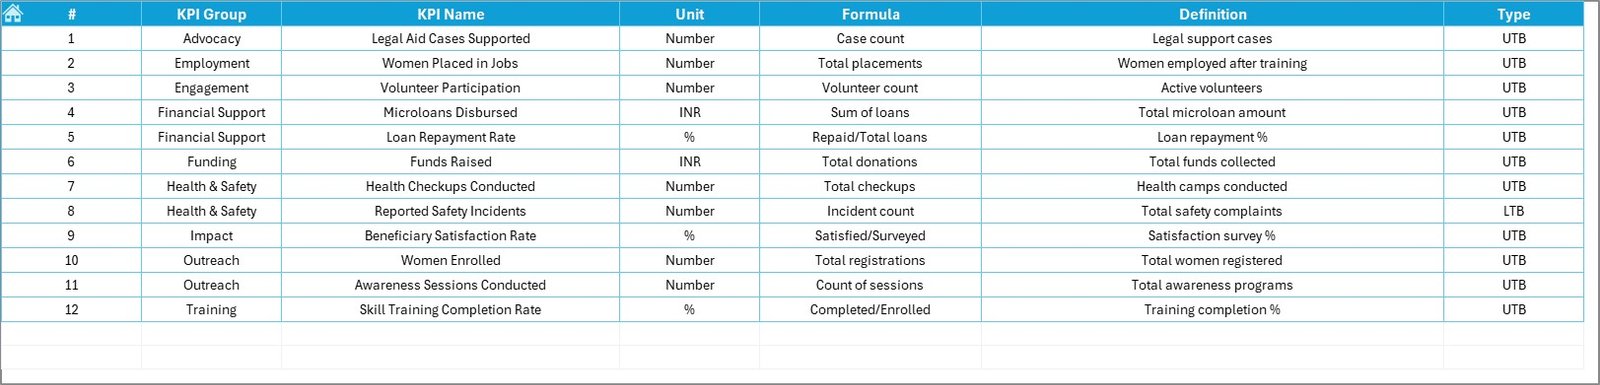
This sheet ensures everyone understands each KPI clearly.
Here, you define:
-
KPI Name
-
KPI Group
-
Unit
-
Formula
-
KPI Definition
Because of this structure, your organization avoids confusion.
For example:
-
Beneficiaries Trained (Unit: Number)
-
Training Completion Rate (Unit: %)
-
Fund Utilization Rate (Unit: %)
Clear definitions prevent reporting errors.
What KPIs Can Women Empowerment NGOs Track?
Although every NGO works differently, most track KPIs across common categories.
1️⃣ Beneficiary Impact KPIs
-
Number of Women Beneficiaries
-
Literacy Improvement Rate
-
Skill Certification Rate
-
Employment Placement Rate
-
Income Growth Percentage
2️⃣ Program Efficiency KPIs
-
Program Completion Rate
-
Dropout Rate
-
Cost per Beneficiary
-
Volunteer Participation Rate
3️⃣ Financial KPIs
-
Fund Utilization Rate
-
Administrative Expense Ratio
-
Donation Growth Rate
-
Project Cost Variance
4️⃣ Community Engagement KPIs
-
Awareness Campaign Reach
-
Community Event Participation
-
Feedback Satisfaction Score
When you track these metrics consistently, you build measurable impact.
Click to Purchases Women Empowerment NGOs KPI Dashboard in Excel
Advantages of Women Empowerment NGOs KPI Dashboard in Excel
Now let’s explore the major benefits.
1️⃣ Improves Transparency
You can present clear data to donors and stakeholders. Moreover, you build trust through structured reporting.
2️⃣ Enhances Decision-Making
Since you see real-time comparisons, you take quick corrective action.
3️⃣ Saves Time
Instead of preparing reports manually every month, you update numbers once and get automated insights.
4️⃣ Increases Accountability
Teams understand targets clearly. Therefore, they work with measurable objectives.
5️⃣ Tracks Impact Clearly
Because you compare previous year performance, you show growth and improvement convincingly.
6️⃣ Improves Funding Opportunities
Donors prefer data-driven NGOs. When you present dashboards, you increase credibility.
Click to Purchases Women Empowerment NGOs KPI Dashboard in Excel
Best Practices for the Women Empowerment NGOs KPI Dashboard
Even though the dashboard works effectively, you must follow best practices for maximum results.
1️⃣ Define KPIs Carefully
Choose KPIs that align with your mission. Avoid tracking too many metrics.
2️⃣ Update Data Monthly
Enter actual numbers regularly. Otherwise, trends lose meaning.
3️⃣ Review Trends Quarterly
While monthly tracking helps operations, quarterly analysis helps strategy.
4️⃣ Align KPIs with Funding Goals
If donors focus on employment outcomes, track placement rate clearly.
5️⃣ Train Staff on Data Entry
Ensure consistency in reporting. Moreover, assign responsibility clearly.
6️⃣ Use Visual Insights During Board Meetings
Instead of lengthy reports, present dashboard visuals. This improves engagement.
How Does This Dashboard Improve NGO Performance?
When you implement structured KPI tracking:
-
Teams focus on results
-
Leaders identify gaps early
-
Programs improve continuously
-
Impact measurement becomes stronger
-
Donor confidence increases
Moreover, you move from reactive management to proactive planning.
Conclusion
Women empowerment NGOs drive social transformation. However, impact alone does not guarantee sustainability. You must measure, analyze, and communicate results effectively.
The Women Empowerment NGOs KPI Dashboard in Excel provides:
-
Structured KPI tracking
-
Automated MTD & YTD comparison
-
Previous year analysis
-
Clear trend visualization
-
Professional reporting format
As a result, your NGO operates with clarity, transparency, and confidence.
If you truly want to measure impact, improve performance, and attract funding, this dashboard becomes your essential management tool.
Click to Purchases Women Empowerment NGOs KPI Dashboard in Excel
Frequently Asked Questions (FAQs)
1️⃣ What is the main purpose of a Women Empowerment NGOs KPI Dashboard in Excel?
It helps NGOs track performance, compare targets, analyze trends, and measure impact in a structured format.
2️⃣ Can small NGOs use this dashboard?
Yes. Even small NGOs benefit because Excel remains simple and accessible.
3️⃣ Do I need advanced Excel skills to use it?
No. You only need basic data entry skills. The dashboard calculates automatically.
4️⃣ How often should NGOs update the dashboard?
You should update it monthly. However, you can review performance weekly if needed.
5️⃣ What type of KPIs should women empowerment NGOs track?
You should track beneficiary impact, program efficiency, financial management, and community engagement KPIs.
6️⃣ Can this dashboard help during donor reporting?
Yes. In fact, it strengthens donor presentations by providing clear, visual data.
7️⃣ Why compare with previous year data?
Because historical comparison shows growth, improvement, and long-term impact.
Click to Purchases Women Empowerment NGOs KPI Dashboard in Excel
Visit our YouTube channel to learn step-by-step video tutorials