Vendor performance plays an important role in the success of every business. When vendors deliver goods on time, maintain quality, offer fair pricing, and follow compliance standards, business operations run smoothly. However, vendor issues such as delivery delays, high defect rates, or poor communication slow down projects and increase costs. Therefore, procurement teams need a strong monitoring system that helps them track vendor performance consistently.
A Vendor Management KPI Dashboard in Excel solves this challenge. It offers a clear structure, real-time updates, easy navigation, and accurate reporting. Because of its simple design, even non-technical users can manage supplier data without difficulty. In this complete guide, you will learn how this dashboard works, what sheets it includes, how you should use them, and why this system becomes essential for procurement teams.
Let’s explore everything step-by-step.
Click to Purchases Public Vendor Management KPI Dashboard in Excel
What Is a Vendor Management KPI Dashboard in Excel?
A Vendor Management KPI Dashboard in Excel is a ready-to-use reporting tool that allows procurement and supply chain teams to track vendor performance through key metrics such as:
-
On-time delivery
-
Quality score
-
Cost variance
-
Supplier responsiveness
-
Contract compliance
-
Purchase order fulfillment
-
Issue resolution time
The dashboard uses seven worksheets connected together to show Month-to-Date (MTD) and Year-to-Date (YTD) performance. You only fill the Actual, Target, Last Year, and KPI Definition sheets, and the dashboard updates automatically.
This system improves transparency, performance tracking, supplier communication, and decision-making in every stage of procurement.
Why Do Businesses Need Vendor Management KPIs?
Every business depends on vendors. Companies purchase raw materials, components, IT services, packaging, transport, and office supplies from multiple suppliers. A small delay or mistake affects the entire process. Therefore, businesses monitor vendors closely with KPIs.
Here are some common vendor problems companies face:
-
Late deliveries
-
Quality issues
-
Unclear documentation
-
Price fluctuations
-
Poor communication
-
Slow issue resolution
-
Inconsistent supply
-
Compliance failures
A Vendor Management KPI Dashboard helps teams identify these problems early and take corrective actions before they create losses. It gives full visibility across all key procurement areas.
Click to Purchases Public Vendor Management KPI Dashboard in Excel
Key Features of the Vendor Management KPI Dashboard in Excel
This dashboard includes seven worksheets, each designed for a specific purpose. You move across sheets using the Home page buttons, which makes navigation simple and fast.
Let’s understand each sheet in detail.
1. Home Sheet
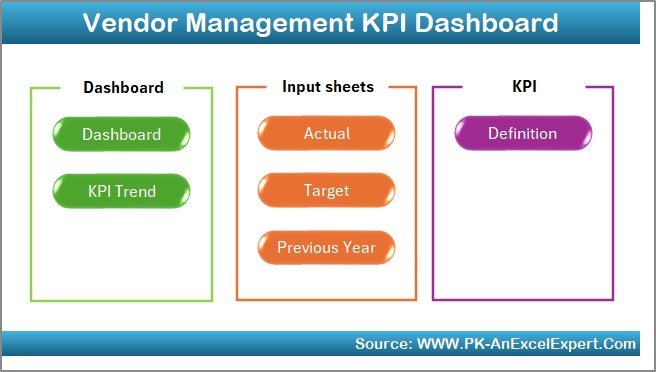
The Home sheet works like an index page. It contains six buttons that take you directly to each worksheet inside the file. Because of this navigation panel, users don’t waste time searching through sheet tabs.
This home screen creates a smooth workflow for daily, weekly, and monthly KPI analysis.
2. Dashboard Sheet
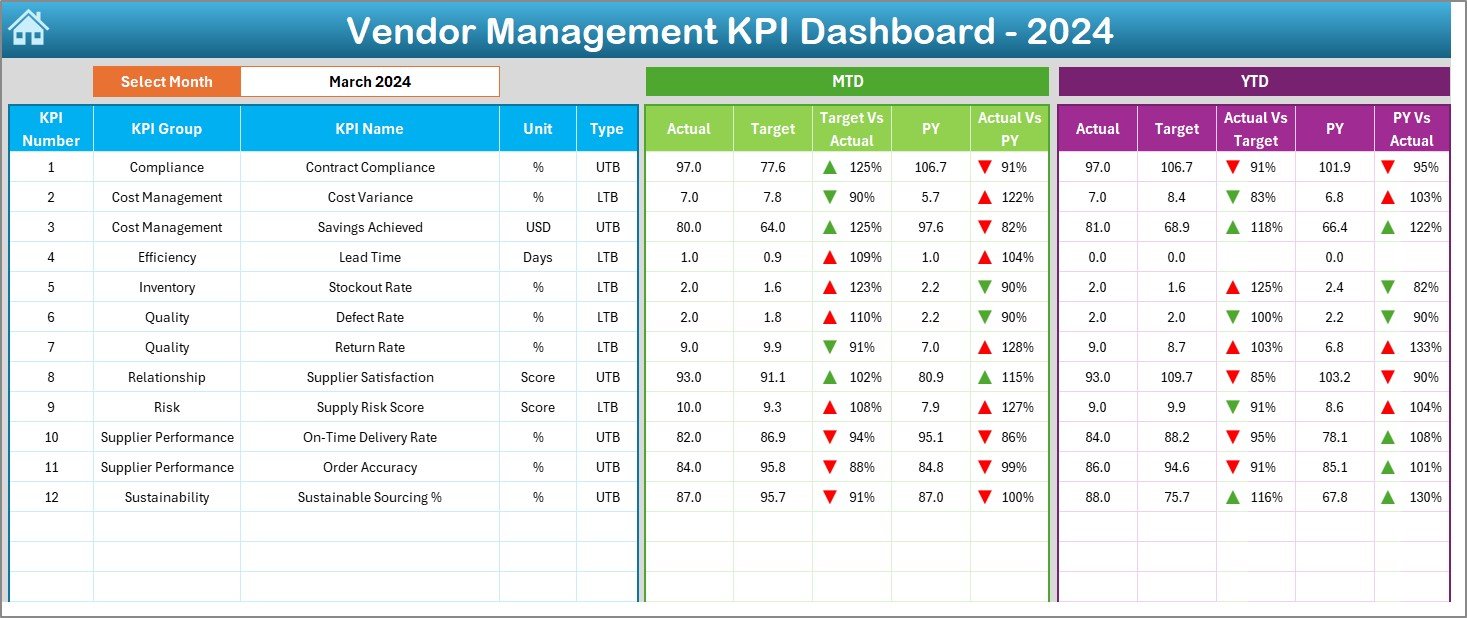
The Dashboard sheet is the heart of the file. It shows every KPI for a selected month along with MTD and YTD numbers. Everything updates instantly when you choose a month from the dropdown located on cell D3.
This dashboard displays:
✔ Month-to-Date (MTD) Metrics
You see:
-
Actual
-
Target
-
Previous Year
-
Target vs Actual (%)
-
Actual vs PY (%)
The dashboard uses conditional formatting with green ▲ and red ▼ arrows to indicate performance status. This gives immediate clarity on KPIs that meet targets and those that need corrections.
✔ Year-to-Date (YTD) Metrics
You also see:
-
YTD Actual
-
YTD Target
-
YTD Previous Year
-
Target vs Actual (%)
-
Actual vs PY (%)
This dual view helps teams compare short-term and long-term achievements.
✔ Complete KPI Summary in One Screen
The Dashboard sheet combines:
-
Supplier delivery metrics
-
Cost performance
-
Quality control
-
Timescales
-
Compliance levels
-
Supplier rating metrics
You get a complete performance picture without switching between sheets.
Click to Purchases Public Vendor Management KPI Dashboard in Excel
3. KPI Trend Sheet
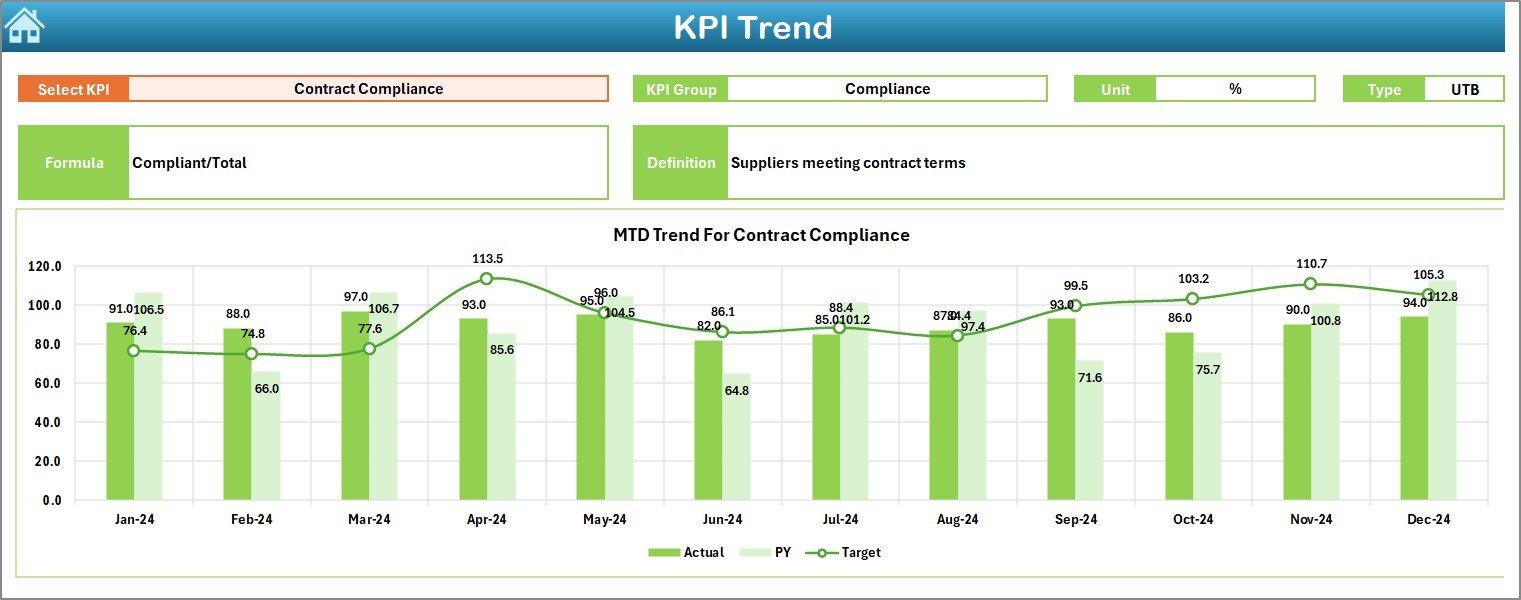
The KPI Trend sheet shows detailed KPI information along with beautiful MTD and YTD trend charts.
You select a KPI from the dropdown in cell C3.
When you choose a KPI, everything updates automatically.
This sheet displays:
-
KPI Group
-
Unit
-
Type (Lower the Better / Upper the Better)
-
KPI Formula
-
KPI Definition
This information helps every user understand how KPI values get calculated.
Trend Charts
The sheet includes two charts:
-
MTD Trend Chart
-
YTD Trend Chart
Both charts show:
-
Actual
-
Target
-
Previous Year
These visuals help identify performance trends, seasonality, improvements, and sudden drops.
4. Actual Numbers Input Sheet
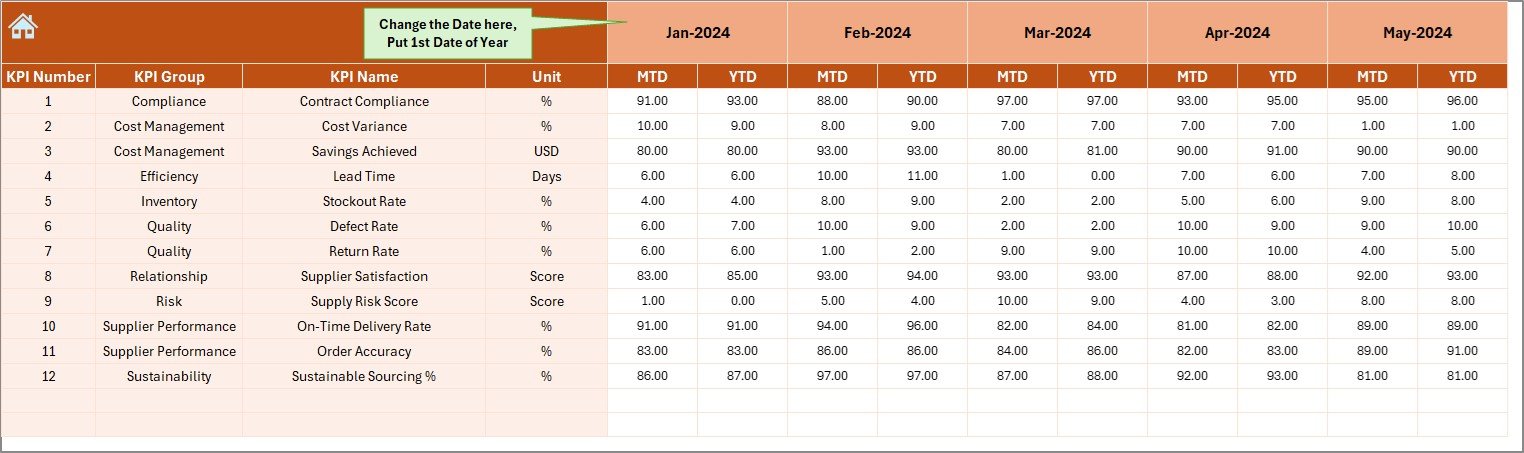
You use this sheet to input current year MTD and YTD Actual values.
-
Select the first month of the year in cell E1
-
Enter Actual values for each vendor KPI in the table
This sheet becomes the backbone of real-time performance reporting. Because the data entry format stays simple, anyone can update numbers easily.
5. Target Sheet
Here you enter monthly MTD and YTD Target values for each KPI. These targets help compare vendor performance with expected standards.
You enter:
-
KPI Name
-
Month
-
MTD Target
-
YTD Target
Clear targets help teams measure achievement and identify improvement areas.
Click to Purchases Public Vendor Management KPI Dashboard in Excel
6. Previous Year Numbers Sheet
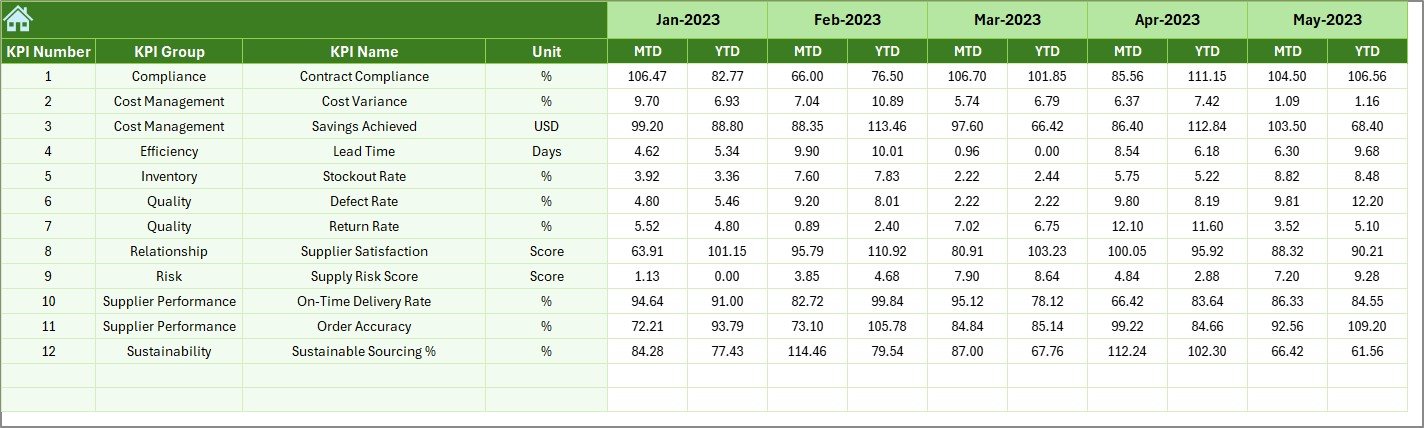
In this sheet, you enter previous year’s MTD and YTD numbers. The dashboard uses these values to display:
-
MTD vs PY (%)
-
YTD vs PY (%)
This year-to-year comparison helps understand progress and measure vendor improvement.
7. KPI Definition Sheet
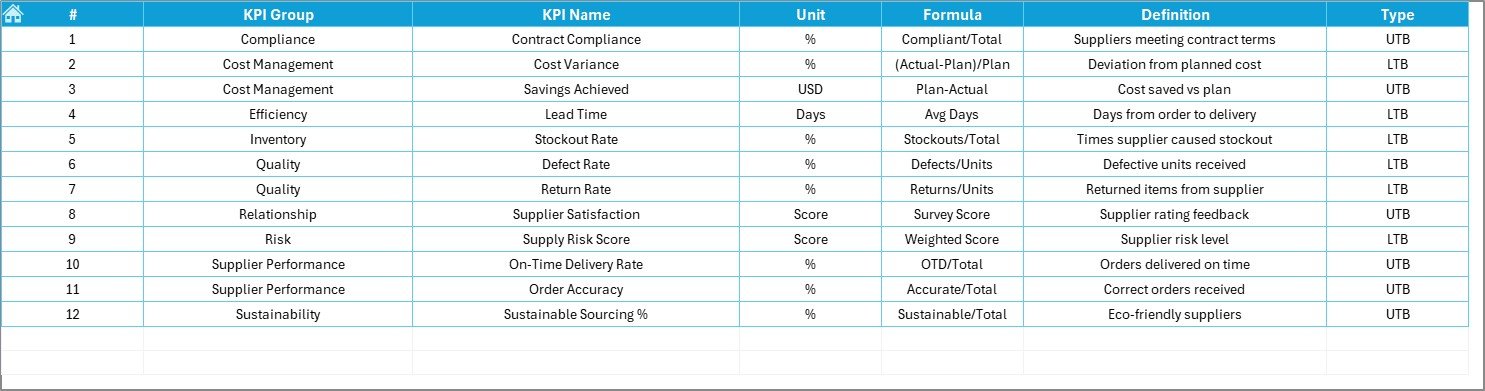
This sheet contains:
-
KPI Name
-
KPI Group
-
Unit of Measurement
-
Type of KPI (LTB or UTB)
-
Formula
-
Definition
Clear definitions help all team members follow the same KPI calculation rules. It ensures consistency across departments.
What KPIs Should You Track in Vendor Management?
Every organization uses different KPIs based on their industry. However, the most common vendor KPIs include:
1. On-Time Delivery Percentage
Shows how often the vendor delivers on time.
2. Quality Score
Tracks the percentage of defect-free items received.
3. Cost Competitiveness
Measures pricing consistency and cost variance.
4. Lead Time
Shows how long the vendor takes to deliver goods.
5. Compliance Score
Checks contract adherence and documentation accuracy.
6. Response Time
Measures how quickly the vendor answers inquiries.
7. Issue Resolution Time
Shows how fast the supplier solves problems.
This dashboard supports all these KPIs through dynamic inputs and formulas.
Click to Purchases Public Vendor Management KPI Dashboard in Excel
Advantages of Vendor Management KPI Dashboard in Excel
A Vendor Management KPI Dashboard delivers huge benefits for procurement teams. Here are the top advantages:
1. Clear and Quick Decision-Making
Teams see performance on one screen. They respond faster and avoid guesswork.
2. Improved Supplier Relationships
Clean KPI reporting helps suppliers understand expectations and improve performance.
3. Cost Reduction
By tracking cost variance and negotiation results, companies save money.
4. Reduced Quality Issues
Consistent monitoring reduces defects and improves product quality.
5. Better Compliance
KPI rules and definitions ensure that every vendor follows contract standards.
6. Enhanced Operational Efficiency
Teams spend less time on data entry and more time on strategic planning.
7. Accurate Trend Analysis
Trend charts help forecast performance and identify early warning signs.
8. Centralized Vendor Data
All vendor information stays in one organized place.
Best Practices for Using the Vendor Management KPI Dashboard
To get maximum value, follow these best practices:
1. Update Data Consistently
Enter Actual, Target, and PY numbers every month without fail.
2. Maintain Standard KPI Naming
Keep KPI names consistent across all sheets to avoid mismatches.
3. Review Trends Regularly
Use the KPI Trend sheet to understand performance patterns.
4. Use Clear KPI Definitions
Make sure all team members understand KPI formulas and definitions.
5. Validate Supplier Data
Double-check values before entry to avoid incorrect dashboard results.
6. Compare Vendors Fairly
Use the same KPIs and standards for all suppliers.
7. Share Reports Monthly
Review KPI reports with internal teams and vendor partners.
Conclusion
The Vendor Management KPI Dashboard in Excel gives procurement teams a complete performance monitoring system. It organizes Actual, Target, and Previous Year numbers in a simple structure and presents clean insights in the Dashboard sheet. With trend analysis, KPI definitions, and structured data entry, teams get a powerful tool for supplier evaluation.
This dashboard saves time, improves accuracy, supports decision-making, and strengthens vendor relationships. When used correctly, it becomes a central part of procurement excellence.
Click to Purchases Public Vendor Management KPI Dashboard in Excel
Frequently Asked Questions (FAQs)
1. What is a Vendor Management KPI Dashboard?
It is an Excel-based tool for tracking supplier KPIs such as on-time delivery, quality, cost, and responsiveness.
2. Who should use this dashboard?
Procurement teams, supply chain managers, vendor coordinators, finance teams, and business leaders.
3. Do I need Excel skills to use it?
No. Basic Excel knowledge is enough. All formulas and visuals stay ready to use.
4. How often should I update data?
Update Actual, Target, and Previous Year data every month.
5. Can I add new KPIs?
Yes. Add new KPIs in the KPI Definition sheet and update data sheets accordingly.
6. What does LTB and UTB mean?
-
LTB: Lower The Better
-
UTB: Upper The Better
7. Can I customize the dashboard layout?
Yes. You can modify colors, fonts, KPIs, and charts.
8. Does it support trend analysis?
Yes. The KPI Trend sheet shows MTD and YTD trend charts.
9. Can beginners use this?
Yes. The interface is simple and beginner-friendly.
10. Where should I start?
Begin by entering KPI definitions and previous year data. Then update Actual and Target sheets.
Click to Purchases Public Vendor Management KPI Dashboard in Excel
Visit our YouTube channel to learn step-by-step video tutorials