The logistics industry is changing fast. Businesses are looking for faster, safer, and more cost-efficient delivery methods. Because of this growing demand, drone delivery services are becoming a key part of modern logistics. However, managing drone operations is not simple. You need to monitor delivery costs, flight routes, satisfaction ratings, weather impacts, cancellations, and monthly performance. Doing this manually takes a lot of time and increases the chances of errors.
A Drone Delivery Services Dashboard in Excel solves this problem instantly. It shows all important delivery data in a single dashboard. You understand performance trends, make faster decisions, and analyze real-time insights without advanced technical skills. This ready-to-use Excel template organizes important KPIs into interactive pages, slicers, cards, and charts.
Click to Purchases Drone Delivery Services Dashboard in Excel
In this complete guide, you will learn:
-
What this dashboard is
-
Why drone delivery companies need it
-
A detailed explanation of every page
-
Insights from each chart
-
Advantages of this dashboard
-
Best practices for effective use
-
Frequently asked questions
Let’s explore each part step by step.
Click to Purchases Drone Delivery Services Dashboard in Excel
What Is a Drone Delivery Services Dashboard in Excel?
A Drone Delivery Services Dashboard in Excel is a pre-designed performance analytics tool for drone logistics companies and last-mile delivery businesses. It tracks revenue, cost, profit, satisfaction ratings, regions, weather conditions, and monthly delivery trends. Because all components link to the Data Sheet, the dashboard updates automatically when new data is added.
This Excel dashboard includes five analytical pages, a navigation panel, and structured support sheets. Each page has slicers on the right for easy filtering and deep analysis.
The dashboard gives clear visibility into:
-
Delivery performance
-
Cost breakdown
-
Customer satisfaction
-
Weather influence
-
City and regional trends
-
Profit margin fluctuations
-
Monthly behavior patterns
As a result, the entire delivery process becomes easy to analyze.
Why Drone Delivery Businesses Need This Dashboard
Drone delivery companies operate in a difficult environment. They deal with flight restrictions, unpredictable weather, safety rules, and customer expectations. Without real-time insights, teams cannot improve efficiency. Let’s understand the biggest challenges companies face:
-
Unclear delivery cost structure
-
Unknown reasons for low profit margins
-
Inconsistent customer satisfaction
-
High cancellation rates due to weather
-
Limited understanding of region-wise demand
-
Difficulty comparing month-to-month performance
When these issues stay hidden, operations become inefficient. A Drone Delivery Services Dashboard shows all these insights instantly. It supports smart decision-making, improves customer service, and boosts profitability.
Click to Purchases Drone Delivery Services Dashboard in Excel
Key Features of the Drone Delivery Services Dashboard
This dashboard includes five core pages along with a well-structured Data Sheet and Support Sheet. A Page Navigator on the left side helps you move across pages easily.
Now, let’s explore each page in detail.
1. Overview Page
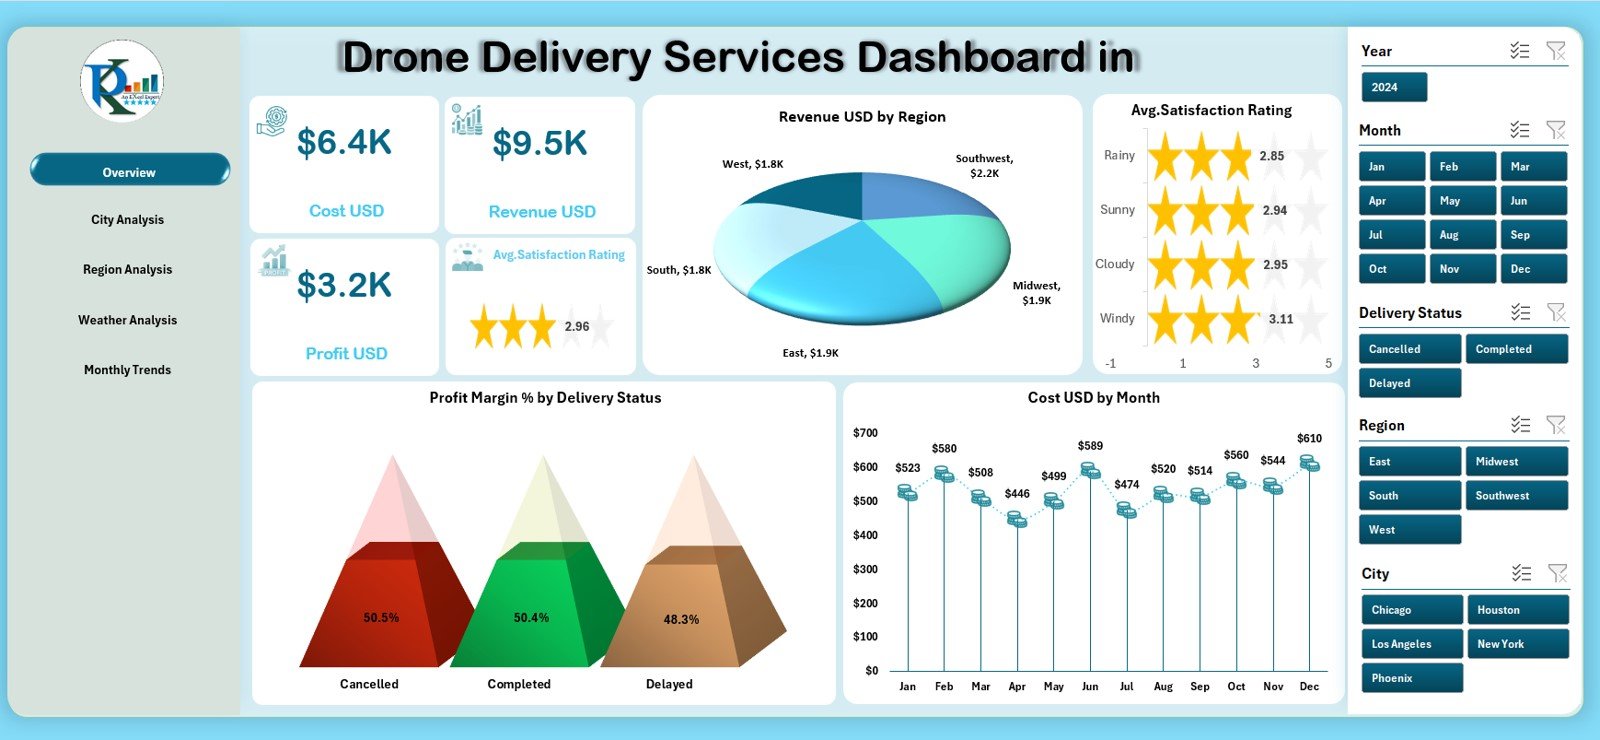
The Overview Page acts as the home screen of the dashboard. It highlights the most important key performance indicators in clean visual formats.
This page includes:
✔ Four KPI Cards
These cards summarize major performance metrics:
-
Total Revenue (USD)
-
Average Satisfaction Rating
-
Profit Margin %
-
Delivery Status Performance
These cards provide a quick snapshot of business health.
✔ Four Key Charts
The Overview Page displays four interactive charts:
-
Revenue (USD) by Region
Helps identify which region generates the highest revenue. -
Average Satisfaction Rating
Shows how happy customers are with drone deliveries. -
Profit Margin % by Delivery Status
Helps compare successful vs. canceled vs. delayed delivery profit rates. -
Cost (USD) by Month
Displays monthly operational expenses for drones.
✔ Right-side Slicers
Users filter data by:
-
Month
-
Region
-
Delivery Status
-
Category
This page gives a complete picture of financial and operational performance.
Click to Purchases Drone Delivery Services Dashboard in Excel
2. City Analysis Page
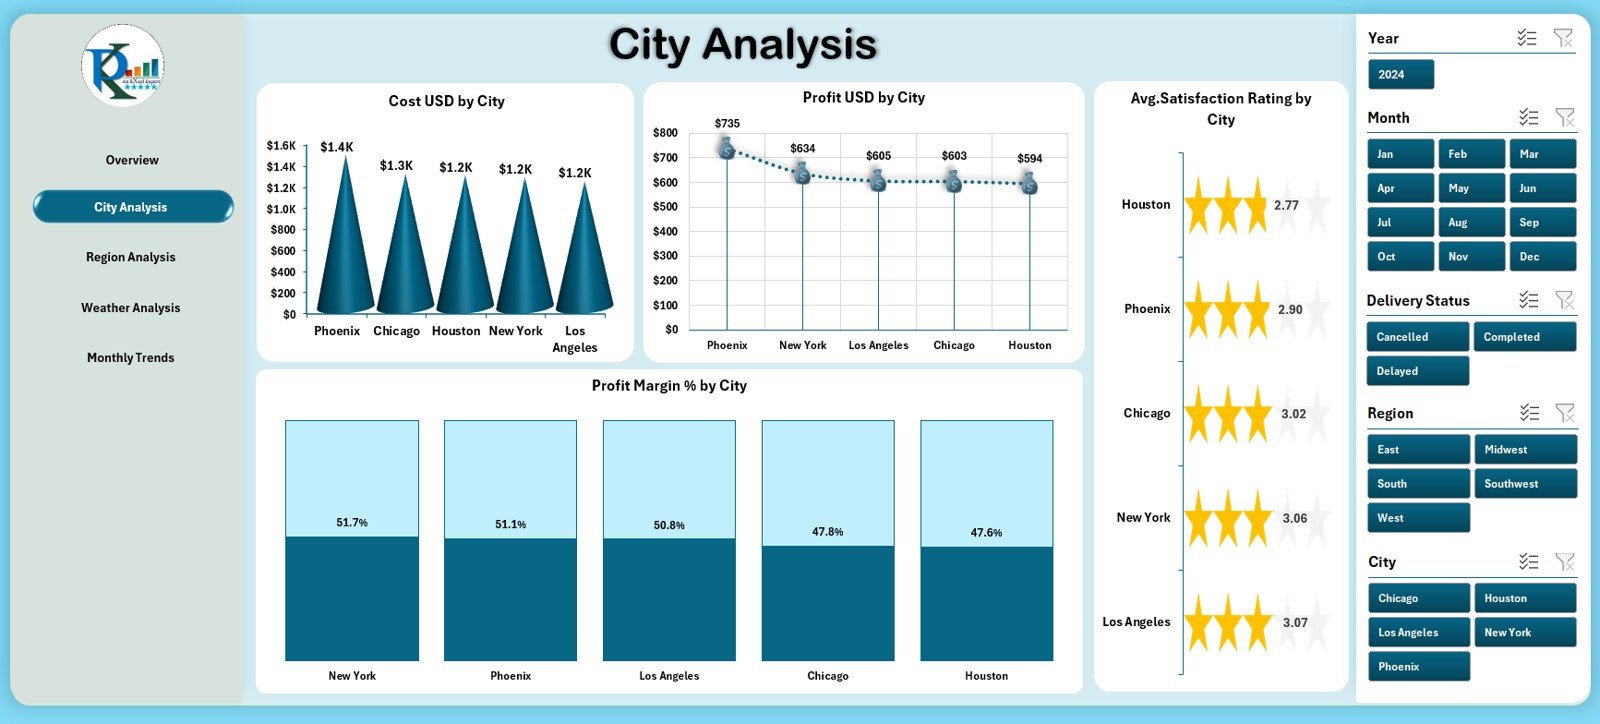
The City Analysis Page focuses on city-wise trends. Companies with multiple drone delivery locations need this view to identify city strengths and weaknesses.
This page includes four analytical charts:
✔ 1. Cost (USD) by City
Shows which cities incur higher running costs.
✔ 2. Profit (USD) by City
Highlights which locations generate maximum profit.
✔ 3. Average Satisfaction Rating by City
Shows how customer ratings vary from city to city.
✔ 4. Profit Margin % by City
Helps compare profitability across cities.
These charts help operational teams improve efficiency and optimize delivery routes.
3. Region Analysis Page
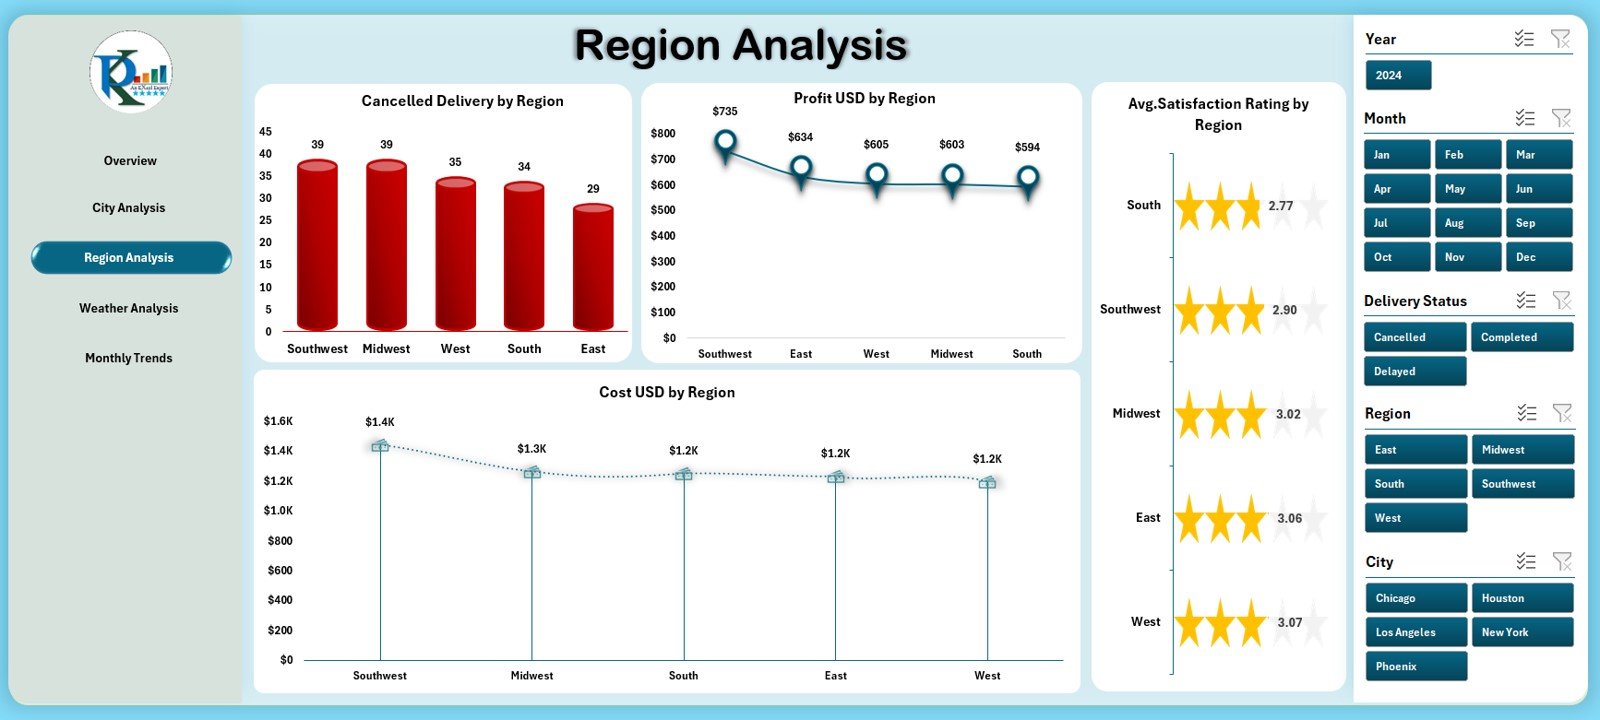
Each region has unique challenges. Weather, customer demand, terrain, and cost structure vary by region. The Region Analysis Page helps identify regional performance differences.
This page includes four charts:
✔ 1. Cancelled Deliveries by Region
Shows cancellation trends in specific regions.
✔ 2. Profit (USD) by Region
Compares revenue vs. cost performance region-wise.
✔ 3. Cost (USD) by Region
Reveals high-expense zones.
✔ 4. Average Satisfaction Rating by Region
Indicates customer happiness by location.
With these insights, companies can prioritize resource allocation, crew training, or regional marketing.
Click to Purchases Drone Delivery Services Dashboard in Excel
4. Weather Analysis Page
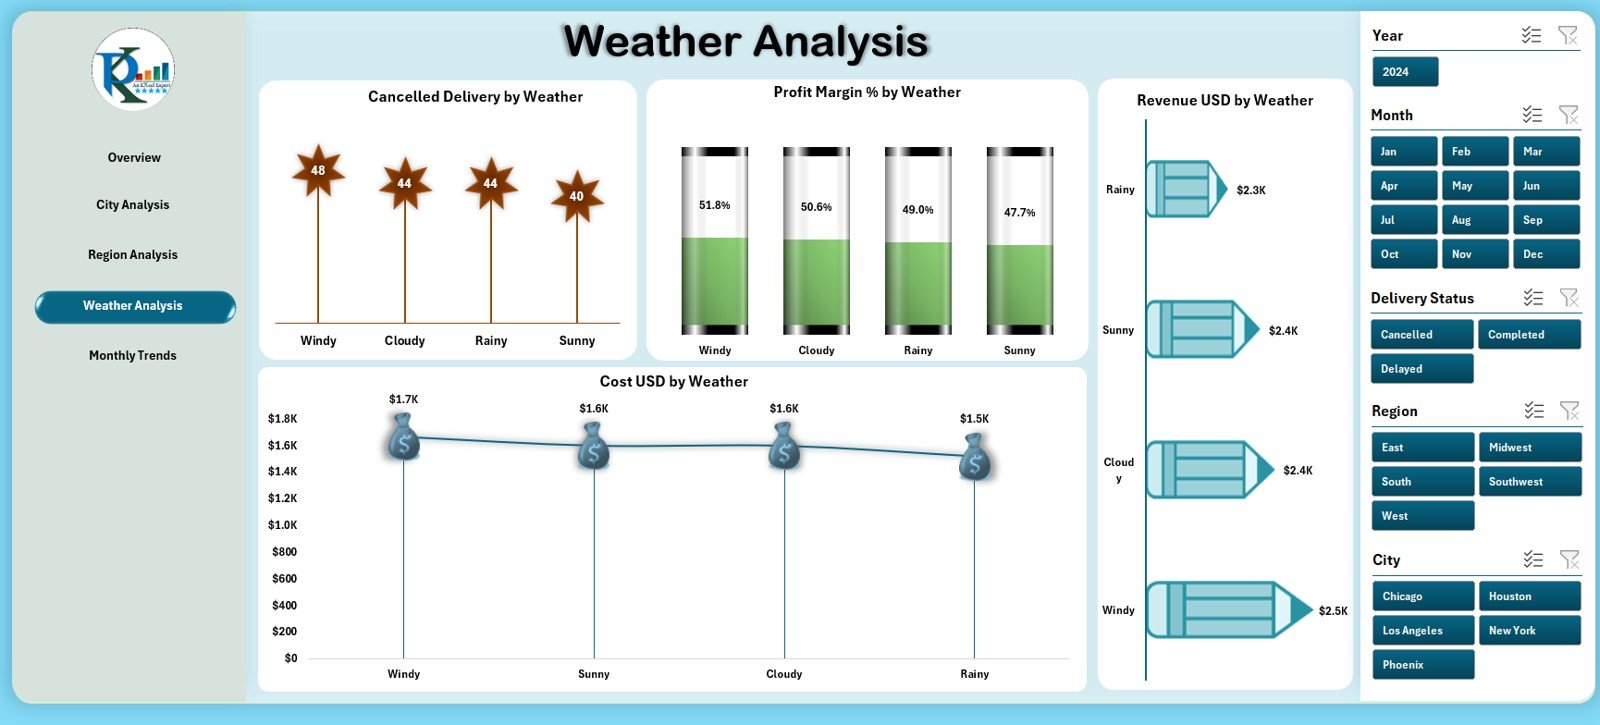
Drone deliveries depend heavily on weather. Poor weather increases cancellations, delays, and risk.
This page includes four detailed charts:
✔ 1. Cancelled Deliveries by Weather
Shows weather conditions responsible for most cancellations.
✔ 2. Profit Margin % by Weather
Reveals which weather conditions affect profitability.
✔ 3. Revenue by Weather
Shows how weather influences revenue generation.
✔ 4. Cost (USD) by Weather
Analyzes weather-based cost changes.
This page helps logistics managers prepare for weather-related challenges.
5. Monthly Trends Page
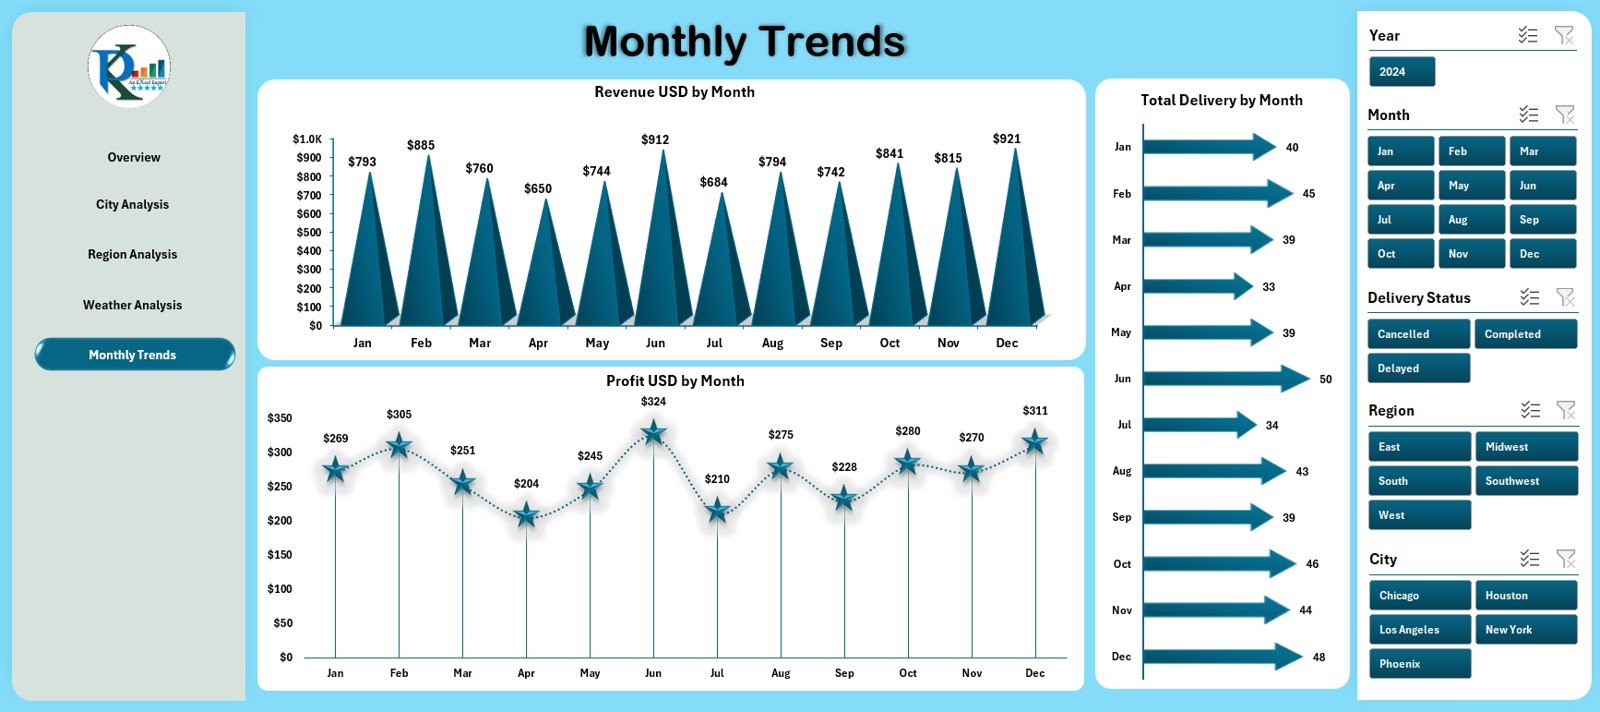
The Monthly Trends Page displays monthly data for overall operational performance. This page helps identify seasonal patterns and monthly changes.
This page includes three charts:
✔ 1. Revenue (USD) by Month
Shows how revenue changes month to month.
✔ 2. Profit (USD) by Month
Tracks profit variation across months.
✔ 3. Total Deliveries by Month
Shows the number of deliveries completed each month.
These insights help management predict demand, plan budgets, and forecast future growth.
Support Sheet
The Support Sheet contains important lists used for slicers, dropdowns, or classifications. It maintains clean data structure and ensures the dashboard works flawlessly.
Click to Purchases Drone Delivery Services Dashboard in Excel
Data Sheet
The Data Sheet is the engine of the dashboard. You enter:
-
Delivery details
-
Revenue
-
Cost
-
Profit
-
Weather
-
Region
-
City
-
Satisfaction rating
-
Delivery status
-
Month
When you enter new data, the dashboard updates automatically.
Click to Purchases Drone Delivery Services Dashboard in Excel
Advantages of the Drone Delivery Services Dashboard in Excel
This dashboard offers many benefits for drone delivery companies:
1. Real-Time Decision Making
Teams make faster decisions because all insights appear instantly.
2. Better Operational Clarity
Charts show exactly where costs increase and where profit decreases.
3. Improved Customer Experience
Satisfaction rating insights help companies improve service quality.
4. Reduced Delivery Costs
By analyzing region and city data, teams improve route efficiency.
5. Increased Profitability
Profit margin insights lead to better resource management.
6. Weather-Based Planning
Weather charts help plan safe delivery schedules.
7. Transparent Performance Tracking
Dashboards keep teams aligned across operations, marketing, and management.
Click to Purchases Drone Delivery Services Dashboard in Excel
Best Practices for Using This Dashboard
To get maximum value, follow these practices:
1. Update the Data Sheet Frequently
More frequent updates lead to better reporting accuracy.
2. Maintain Consistent Naming
Use standard names for cities, regions, weather types, and delivery status.
3. Review Weather Trends Weekly
Weather causes major delays; monitor it closely.
4. Use Region and City Filters
Filters help compare performance across different markets.
5. Track Profit Margin Carefully
Small margin changes impact overall profitability.
6. Share Monthly Reports with Teams
Consistent reporting improves alignment.
7. Maintain Data Quality
Clean and accurate data keeps visuals meaningful.
Conclusion
The Drone Delivery Services Dashboard in Excel is a powerful performance analysis tool for modern logistics companies. It organizes the entire delivery dataset into structured pages—Overview, City Analysis, Region Analysis, Weather Analysis, and Monthly Trends. With this dashboard, businesses track costs, profit, satisfaction, weather impact, and operational behavior with ease.
This template reduces manual work, improves data accuracy, and supports better decision-making. When used regularly, it helps drone delivery companies grow faster, deliver efficiently, and operate with complete visibility.
Click to Purchases Drone Delivery Services Dashboard in Excel
Frequently Asked Questions (FAQs)
1. What is a Drone Delivery Services Dashboard in Excel?
It is an Excel-based dashboard that tracks revenue, cost, delivery performance, satisfaction rating, and weather impact.
2. Who should use this dashboard?
Drone logistics companies, last-mile delivery startups, fleet managers, and operations teams.
3. Does the dashboard show monthly trends?
Yes. The Monthly Trends page shows revenue, profit, and total deliveries.
4. Can I analyze performance by city?
Yes. The City Analysis page shows cost, profit, satisfaction, and margin % by city.
5. Does weather affect drone deliveries?
Yes. The Weather Analysis page shows cancellations, revenue, profit margin, and cost by weather type.
6. Is this dashboard beginner-friendly?
Yes. It uses simple Excel formulas and clean visuals.
7. Can I add new cities, regions, or weather types?
Yes. You can update the Data Sheet and Support Sheet easily.
8. Does the dashboard support profit analysis?
Yes. Multiple charts show profit by city, region, month, and weather.
9. How often should I update data?
Update it daily or weekly for best results.
10. Can I customize the charts?
Yes. You can modify any chart, color, or layout in Excel.
Click to Purchases Drone Delivery Services Dashboard in Excel
Visit our YouTube channel to learn step-by-step video tutorials