Manufacturing teams face continuous pressure to improve performance, reduce waste, and increase production speed. Plastics manufacturing adds even more challenges because quality, machine efficiency, material consumption, and scrap levels change every day. As a result, managers often work with incomplete data and slow manual reports.
However, when you create a Plastics Manufacturing KPI Dashboard in Excel, you get a clear and dynamic view of your plant’s performance. You also gain the power to measure key metrics, track trends, compare targets, and take action on time. Because this dashboard works inside Excel, your team can use it without any learning curve.
In this detailed article, you will learn what the Plastics Manufacturing KPI Dashboard in Excel is, why every plastics unit needs it, how it works, what sheets it includes, and how teams use it to improve decision-making. You will also explore the advantages, best practices, and FAQs to fully understand this powerful tool.
Click to buy Plastics Manufacturing KPI Dashboard in Excel
What Is a Plastics Manufacturing KPI Dashboard in Excel?
A Plastics Manufacturing KPI Dashboard in Excel is a ready-to-use performance tracking tool that helps manufacturing teams monitor daily, monthly, and yearly KPIs. Because it works in Excel, it becomes easy to visualize production data, measure trends, compare planned vs actual numbers, and improve operational efficiency.
This dashboard tracks both MTD (Month-To-Date) and YTD (Year-To-Date) performance. It also shows comparisons with targets and previous year data. When you select a month from the drop-down, the complete dashboard updates instantly.
With this structured and automated dashboard, production managers, plant heads, quality teams, and leadership teams get a full 360-degree view of plant performance.
Why Do Plastics Manufacturers Need a KPI Dashboard?
Plastics manufacturing involves many processes such as injection molding, blow molding, extrusion, thermoforming, and compounding. Because each step includes several KPIs, manual tracking becomes slow and inaccurate.
A well-designed KPI dashboard solves this problem because:
- It centralizes data in one place.
- It updates automatically when you enter new numbers.
- It shows trends with simple charts.
- It highlights performance gaps using conditional formatting.
- It helps managers review metrics quickly and take timely action.
As a result, the entire manufacturing line runs more smoothly and efficiently.
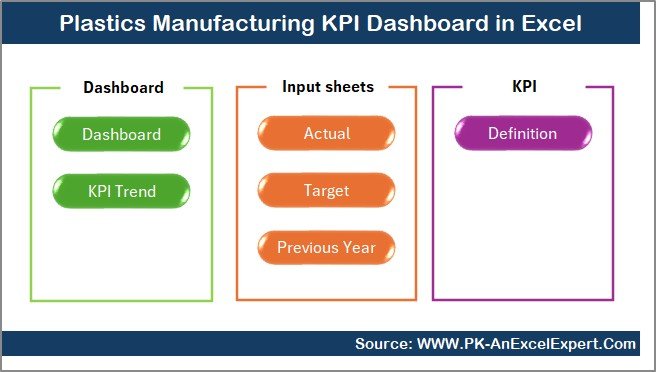
Key Worksheets of the Plastics Manufacturing KPI Dashboard in Excel
This dashboard includes 7 important worksheets, and each sheet plays a specific role in the overall analysis. Because every sheet connects through formulas, your dashboard remains fully dynamic.
Summary Page – The Navigation Hub
The Summary Page works as the index page of the dashboard. It includes six navigation buttons that allow users to jump directly to different sheet tabs. Because of this simple interface, even new users navigate the dashboard easily.
With one click, managers move to Dashboard View, Trend Analysis, Target Sheet, Actual Input Sheet, Previous Year Sheet, or KPI Definition Sheet.
Click to buy Plastics Manufacturing KPI Dashboard in Excel
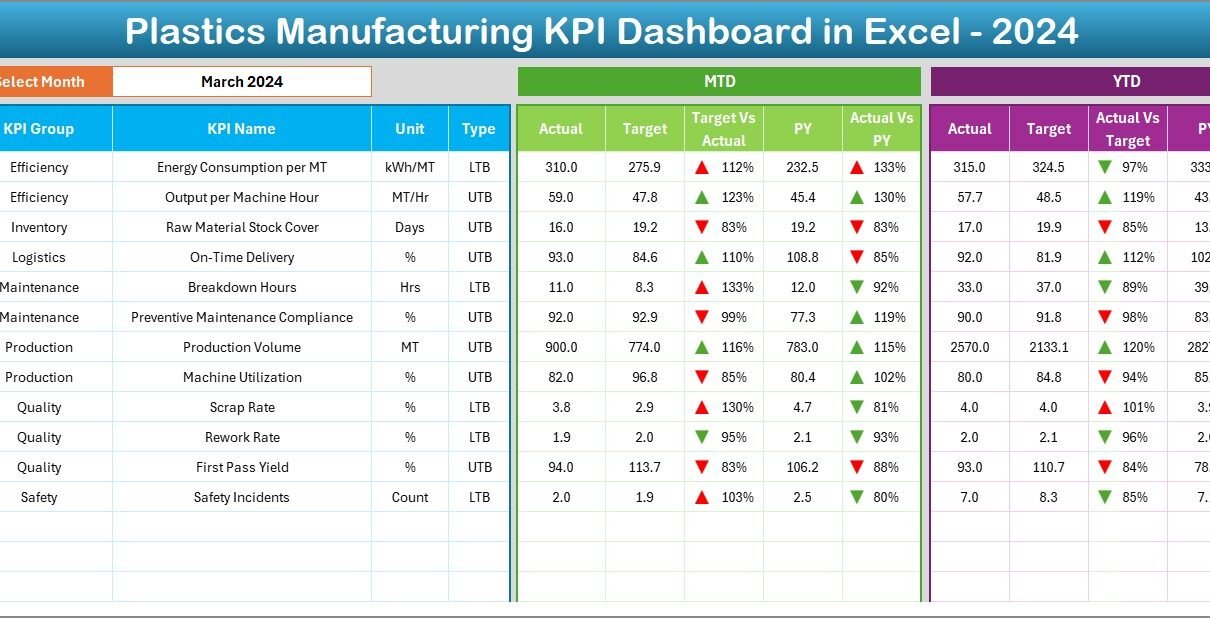
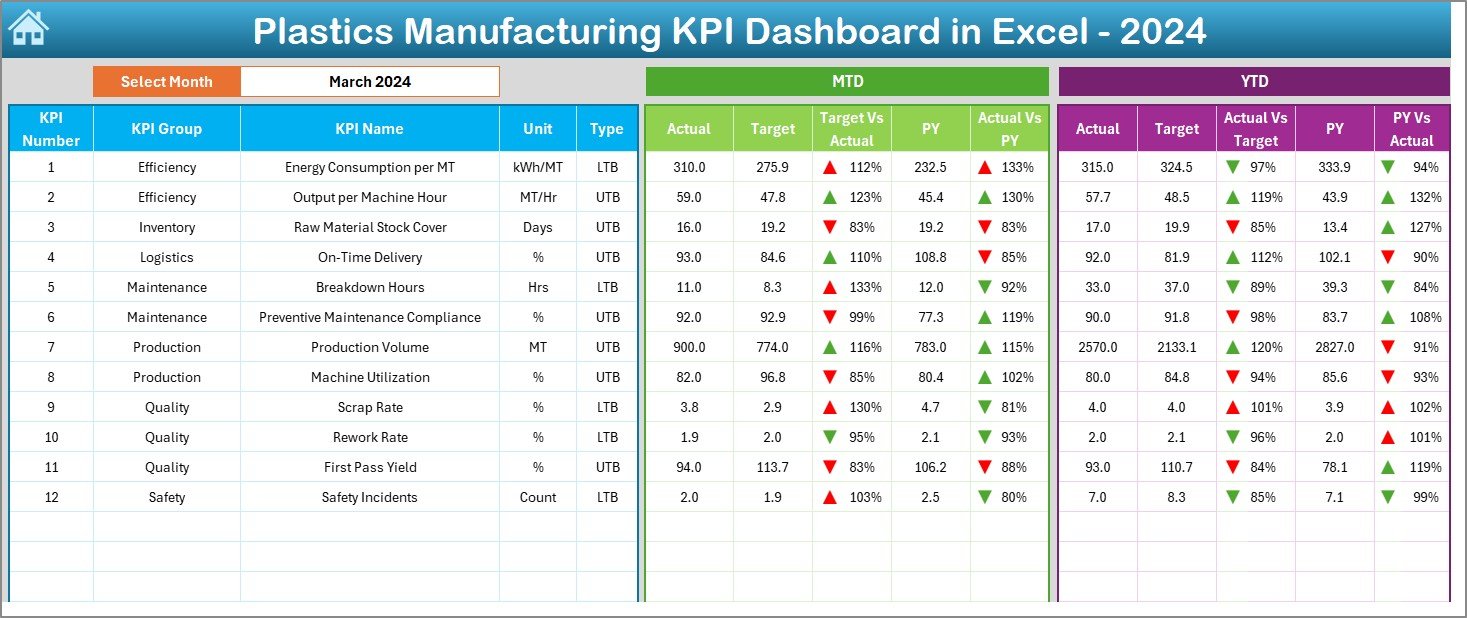
Dashboard Sheet – The Main KPI View
The Dashboard Sheet represents the heart of the entire file. You see all KPI numbers here in one structured and visual format.
Key Features of the Dashboard Sheet
- Month selector available in cell D3
- Automatic change of all numbers based on selected month
- MTD Actual, MTD Target, and MTD Previous Year
- YTD Actual, YTD Target, and YTD Previous Year
- Target vs Actual comparison
- Previous Year vs Actual comparison
- Conditional formatting using up and down arrows
Because of these visual indicators, users identify performance gaps instantly.
Why This Sheet Matters
Production teams often struggle with scattered data. This sheet shows everything in one place. It provides clear insights into performance and helps teams prepare quick reports for management.
Click to buy Plastics Manufacturing KPI Dashboard in Excel
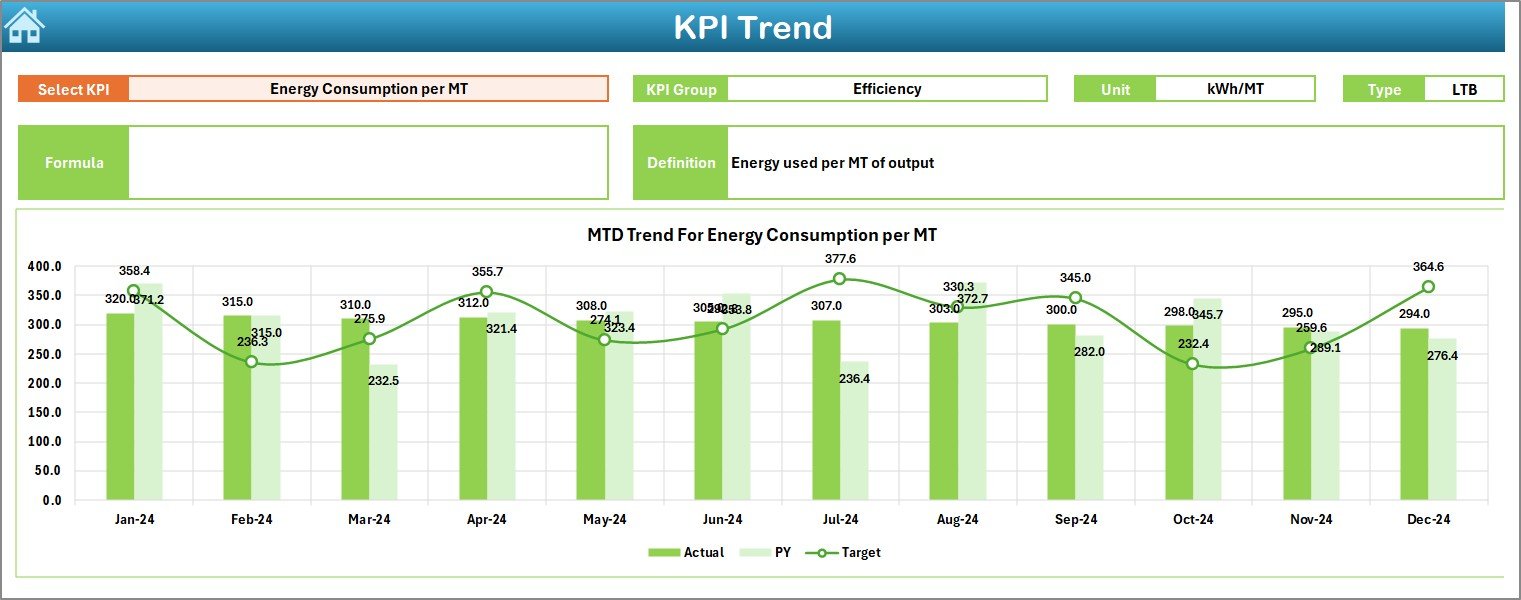
Trend Sheet – KPI Trend Analysis
The Trend Sheet allows users to explore the monthly behavior of each KPI. You select the KPI name from the drop-down in cell C3, and the entire page updates.
Details Displayed on the Trend Sheet
KPI Group
Unit of measurement
KPI Type (Lower the Better or Upper the Better)
KPI Formula
KPI Definition
You also see two trend graphs:
MTD Trend Chart
YTD Trend Chart
Both charts compare Actual, Target, and Previous Year data. Because trends show performance movement over time, decision-makers understand patterns clearly.
Click to buy Plastics Manufacturing KPI Dashboard in Excel
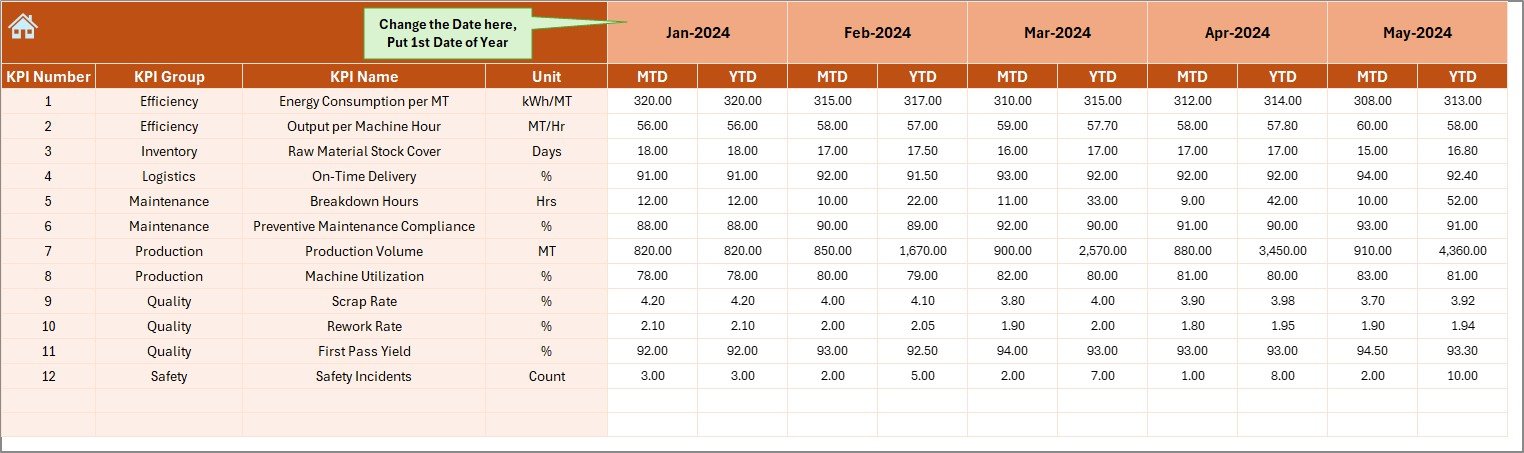
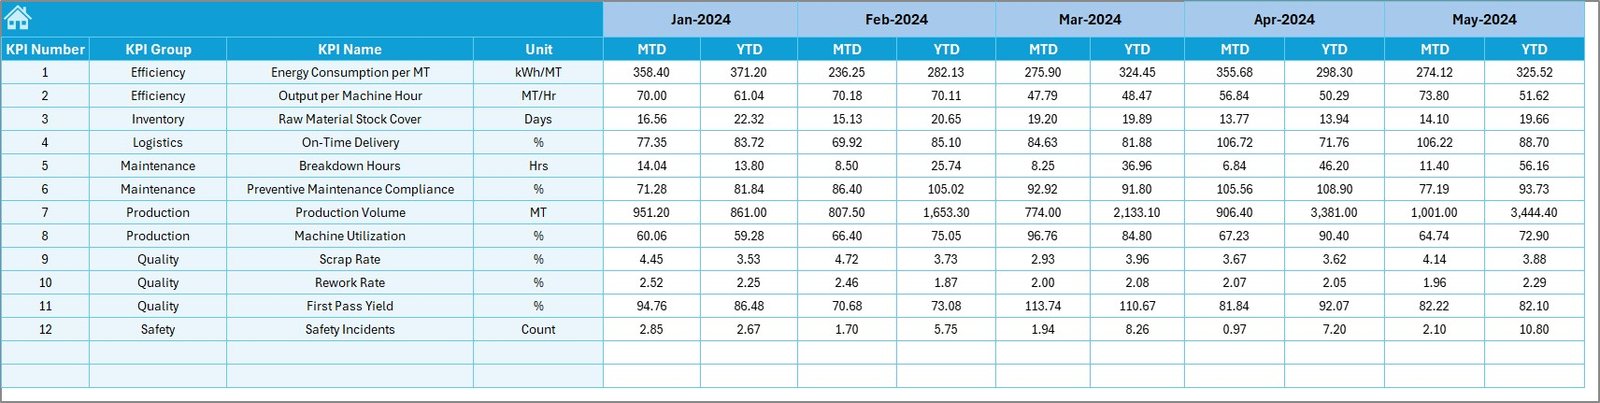
Actual Numbers Input Sheet – Monthly Actuals Entry
This sheet collects actual MTD and YTD numbers for the selected month. You only need to change the starting month in cell E1, and the entire structure adjusts for the year.
Because the sheet uses a clean layout, data entry becomes simple, fast, and error-free.
Click to buy Plastics Manufacturing KPI Dashboard in Excel
Target Sheet – Entering Monthly KPI Targets
You record the target values for each KPI in this sheet. It captures:
MTD Target
YTD Target
Because this sheet connects with the Dashboard and Trend Sheet, the performance comparison becomes real-time and accurate.
Click to buy Plastics Manufacturing KPI Dashboard in Excel
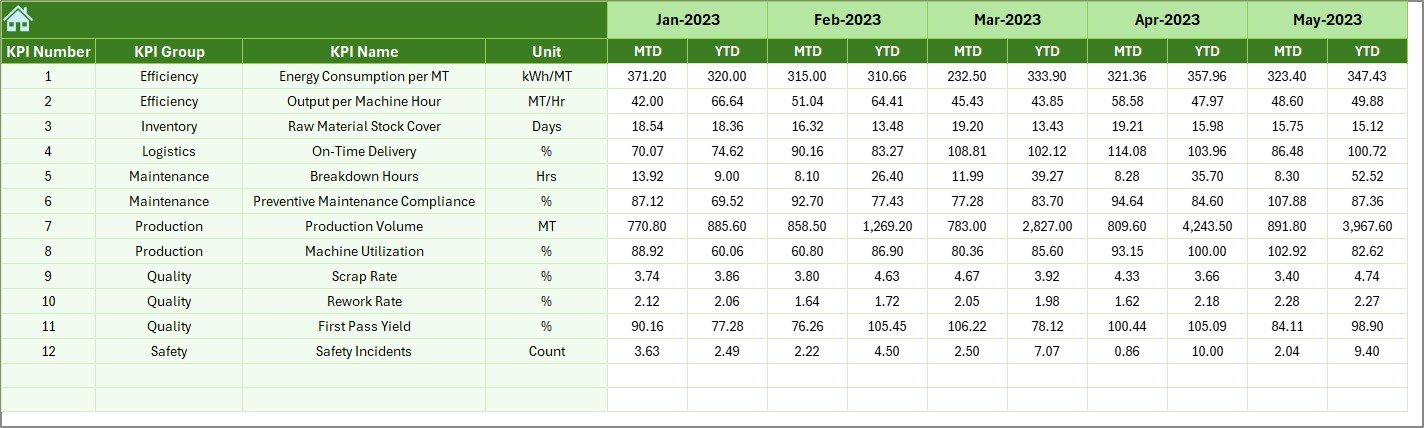
Previous Year Numbers Sheet – Store Last Year’s KPI Data
This sheet stores the previous year’s MTD and YTD numbers. When you compare Actual vs Previous Year, you understand whether performance improved or declined.
This sheet supports strong year-over-year analysis.
Click to buy Plastics Manufacturing KPI Dashboard in Excel
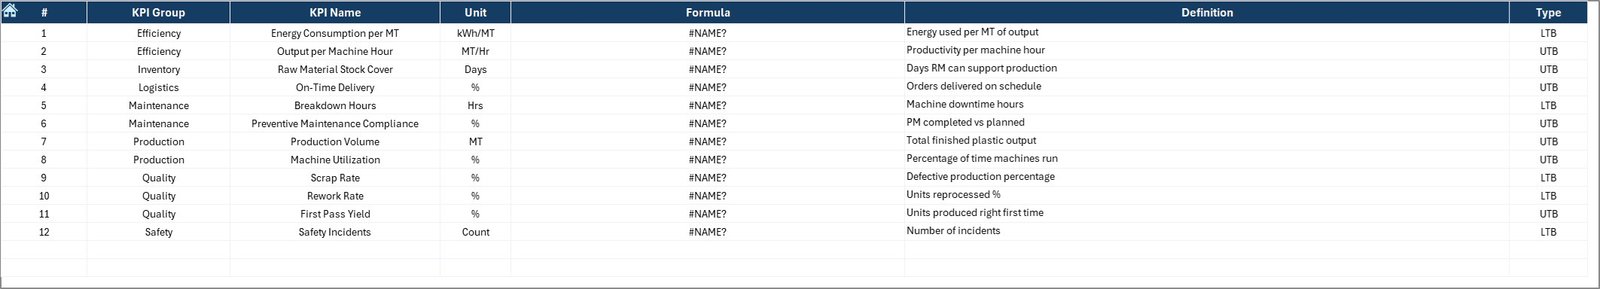
KPI Definition Sheet – Standardized KPI Library
This sheet contains the full KPI dictionary of the dashboard. You enter:
KPI Name
KPI Group
Unit
KPI Formula
KPI Definition
Because everyone refers to the same definitions, your team avoids confusion and ensures data consistency.
Click to buy Plastics Manufacturing KPI Dashboard in Excel
What KPIs Does a Plastics Manufacturing Dashboard Track?
While every plant has unique needs, some common KPIs include:
Production KPIs
- Production Output
- Machine Utilization %
- Cycle Time Efficiency
- Downtime Hours
Quality KPIs
- Defect Rate %
- Rejection Rate %
- First Pass Yield %
Material KPIs
- Scrap %
- Material Consumption
- Overuse / Underuse %
Cost KPIs
- Production Cost per Unit
- Maintenance Cost
- Energy Consumption
When you track these KPIs, you gain a deeper understanding of plant performance.
How Does the Plastics Manufacturing KPI Dashboard Improve Performance?
A KPI dashboard helps teams:
- Compare actual values against targets.
- Identify underperforming machines.
- Reduce material wastage.
- Improve production planning.
- Track operator performance.
- Reduce downtime.
- Improve decision accuracy.
Because the dashboard runs inside Excel, managers update it quickly without complex tools.
Advantages of Using a Plastics Manufacturing KPI Dashboard in Excel
A Plastics Manufacturing KPI Dashboard offers several benefits that transform operations.
- Improves Visibility
You get a complete visual snapshot of plant performance at any time.
- Speeds Up Reporting
You no longer prepare long manual reports; the dashboard updates automatically.
- Reduces Human Errors
Automated formulas eliminate calculation mistakes.
- Enhances Decision-Making
You take action faster because the dashboard highlights issues clearly.
- Standardizes KPI Definitions
Everyone uses the same KPI formulas and units.
- Tracks Trends Easily
Trend charts help you understand performance movement over months.
- Saves Time and Effort
The dashboard structure reduces repetitive work and helps teams focus on improvement.
Best Practices for Building a Plastics Manufacturing KPI Dashboard in Excel
To get maximum value from your dashboard, follow these best practices:
- Choose the Right KPIs
Select KPIs that connect with production goals such as quality, efficiency, or cost.
- Create a Clear Sheet Structure
Use separate sheets for actuals, targets, previous year, dashboard, and definitions.
- Use Consistent Formats
Apply the same number formats, units, and naming methods across all sheets.
- Use Conditional Formatting
Use arrows, colors, and icons to highlight performance gaps.
- Update Data Regularly
Enter actuals and targets every month so the dashboard stays relevant.
- Keep the Interface Simple
Avoid clutter; use clean charts and minimal visuals.
- Test All Formulas Carefully
Ensure that month selection updates all numbers correctly.
- Train Your Team
Teach your operators and team leaders how to read KPIs and use the dashboard.
How to Use the Plastics Manufacturing KPI Dashboard Step-by-Step
Step 1: Enter Actual MTD and YTD Numbers
Go to the Actual Input Sheet and record values for the selected month.
Step 2: Update the Target Numbers
Enter target values for each KPI.
Step 3: Enter Previous Year Data
Fill last year’s actual data for comparison.
Step 4: Select the Month on the Dashboard
Choose the required month from the drop-down.
Step 5: Review the KPI Cards
Check MTD and YTD performance.
Step 6: Review Trend Charts
Study KPI movements and identify improvement areas.
Step 7: Take Action Based on Insights
Use the dashboard findings to plan corrective measures.
Conclusion
A Plastics Manufacturing KPI Dashboard in Excel gives manufacturing teams a powerful, structured, and easy-to-use performance tracking system. Because it presents clear KPI numbers, trends, and comparisons, managers make faster and smarter decisions.
This dashboard also standardizes KPI definitions, improves visibility, and helps teams reduce waste, downtime, and cost. Whether you run a small plant or a large manufacturing unit, this dashboard builds a strong foundation for data-driven decision-making.
Frequently Asked Questions (FAQs)
- What is a Plastics Manufacturing KPI Dashboard in Excel?
It is a performance analysis tool that tracks monthly and yearly KPIs such as production, quality, scrap, downtime, and cost.
- Who uses this dashboard?
Production managers, plant heads, quality teams, and senior management use this dashboard to monitor performance.
- Does the dashboard update automatically?
Yes, when you enter actuals, targets, and previous year data, all charts and KPI cards update automatically.
- Can I add more KPIs?
Yes, you can add KPIs by updating the KPI Definition Sheet and extending the data tables.
- Do I need Power BI or advanced tools to use it?
No, the dashboard works 100% inside Excel.
- Can beginners use this dashboard?
Yes, the interface is simple, and navigation buttons make it easy for new users.
- Does the dashboard show trends?
Yes, the Trend Sheet displays MTD and YTD trend charts for every KPI.
- Can I customize the sheet layout?
Yes, you can modify colors, formats, and KPI groups as needed.
Visit our YouTube channel to learn step-by-step video tutorials
Watch the step-by-step video tutorial:
Click to buy Plastics Manufacturing KPI Dashboard in Excel