Loan recovery plays a critical role in the financial health of banks, NBFCs, microfinance institutions, and lending companies. However, managing recovery performance without a structured monitoring system often leads to delayed actions, poor visibility, and rising non-performing assets. That is exactly where a Loan Recovery Services KPI Dashboard in Excel proves extremely valuable.
A Loan Recovery Services KPI Dashboard in Excel converts raw recovery data into meaningful performance indicators. Moreover, it allows recovery teams, managers, and leadership to track targets, actual collections, and trends from a single, interactive Excel-based dashboard. Since the solution works entirely in Excel, it remains simple, flexible, and easy to adopt across organizations.
In this detailed article, you will learn everything about the Loan Recovery Services KPI Dashboard in Excel. You will understand how it works, why it matters, what each worksheet contains, and how best practices help you maximize recovery efficiency. Additionally, this guide explains how financial institutions can use this dashboard to strengthen recovery strategies and reduce credit risk.
Click to Purchases Loan Recovery Services KPI Dashboard in Excel
What Is a Loan Recovery Services KPI Dashboard in Excel?
A Loan Recovery Services KPI Dashboard in Excel is a ready-to-use performance monitoring tool designed to track, analyze, and compare loan recovery KPIs using structured Excel data.
Instead of reviewing multiple recovery reports, spreadsheets, and manual summaries, this dashboard consolidates all important recovery indicators into one interactive view. As a result, users immediately understand recovery progress, gaps, and trends.
The dashboard uses Excel formulas, drop-downs, and conditional formatting to deliver dynamic insights without relying on complex BI tools.
Why Is a Loan Recovery KPI Dashboard Important?
Loan recovery teams manage large volumes of accounts, targets, and timelines. Without a centralized dashboard, tracking performance accurately becomes difficult.
Here is why this dashboard matters:
-
It centralizes all recovery KPIs in one file
-
It improves visibility for MTD and YTD recovery performance
-
It highlights target achievement and shortfalls clearly
-
It supports faster and informed decision-making
-
It reduces dependency on manual reporting
As a result, recovery teams gain better control over outcomes.
How Does the Loan Recovery Services KPI Dashboard in Excel Work?
The dashboard follows a practical and user-friendly workflow:
-
Users enter actual recovery numbers monthly
-
Targets and previous year data remain stored separately
-
Excel calculations update MTD and YTD metrics automatically
-
Visual indicators highlight performance trends instantly
Therefore, teams spend less time compiling data and more time analyzing recovery performance.
Click to Purchases Loan Recovery Services KPI Dashboard in Excel
What Are the Key Features of the Loan Recovery Services KPI Dashboard?
The dashboard includes seven well-structured worksheets, each serving a specific purpose.
Home Sheet: How Does Navigation Become Easy?
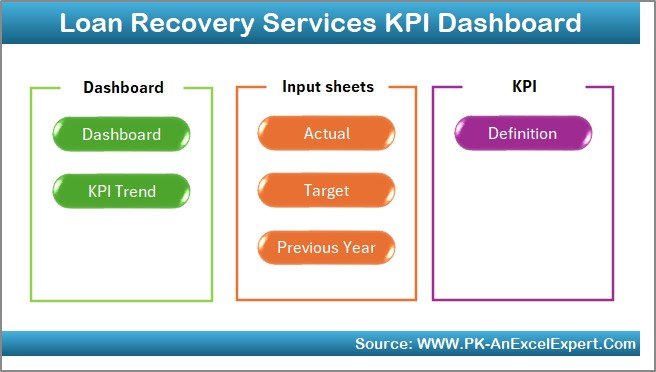
The Home Sheet acts as an index page for the entire dashboard.
Why Is the Home Sheet Useful?
-
It contains six navigation buttons
-
Each button takes users directly to a specific worksheet
-
It improves user experience and ease of navigation
As a result, users move across sheets quickly without confusion.
Dashboard Sheet: What Does the Main Recovery Overview Show?
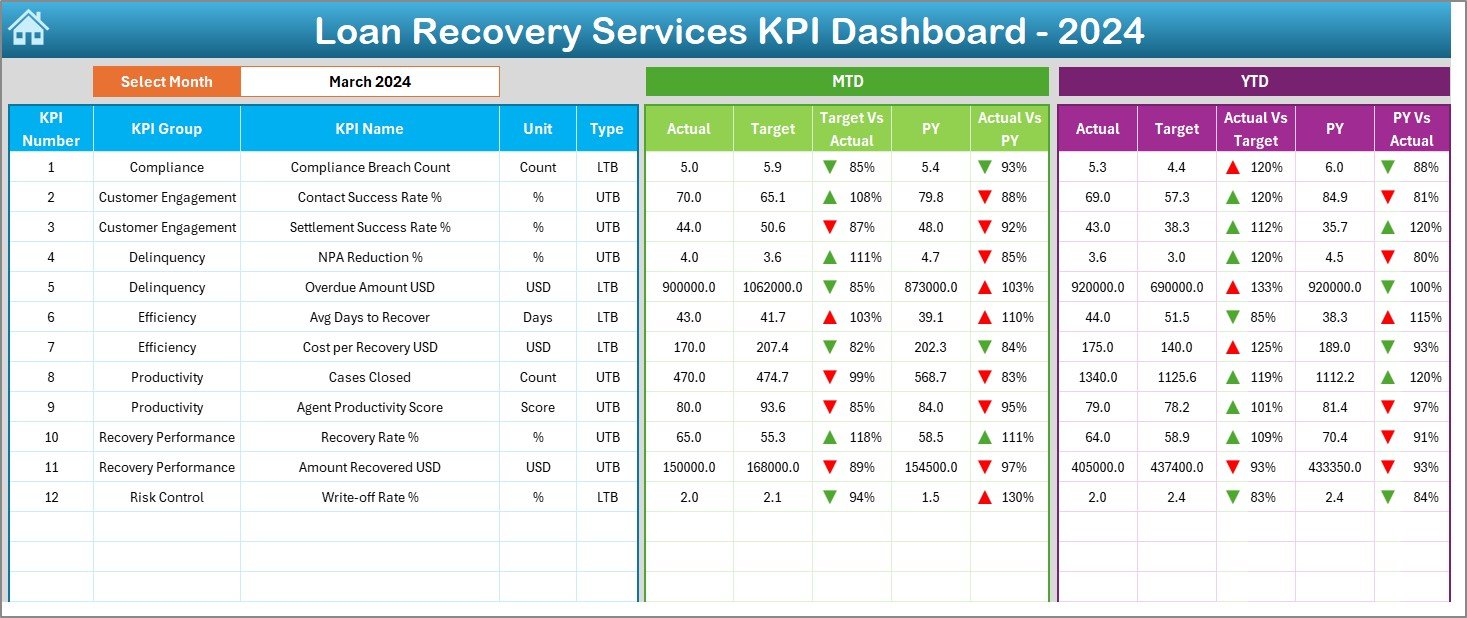
The Dashboard Sheet serves as the central performance view.
Month Selection Feature
-
A month drop-down appears in cell D3
-
Users select the required month
-
All dashboard numbers update automatically
Therefore, monthly recovery analysis stays simple and dynamic.
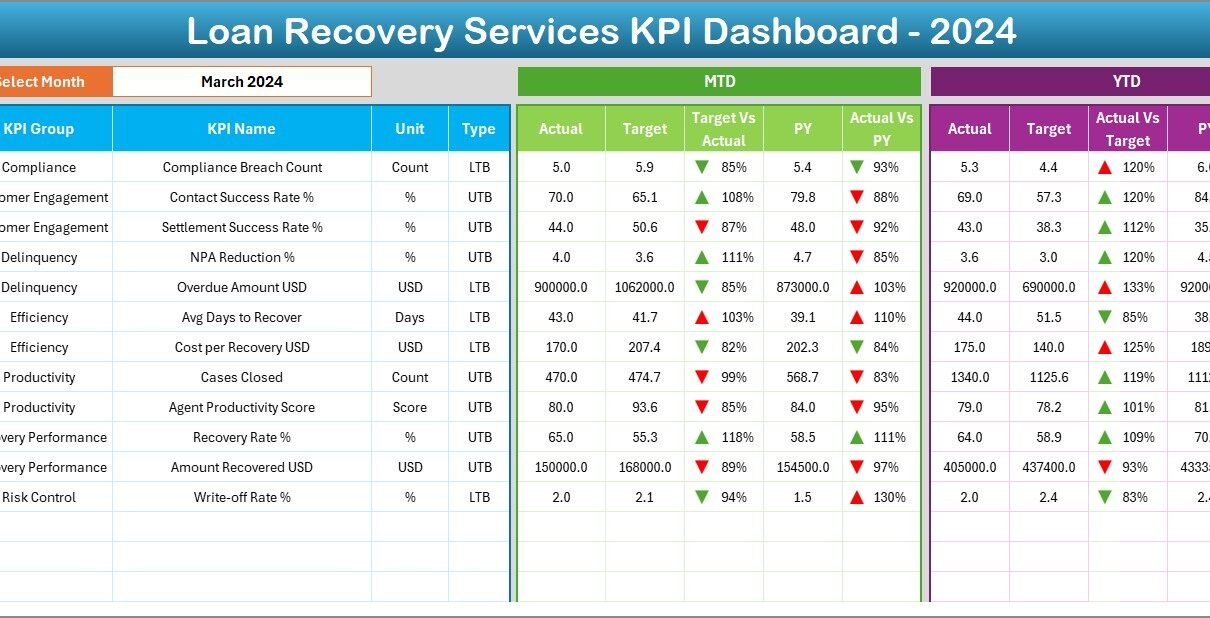
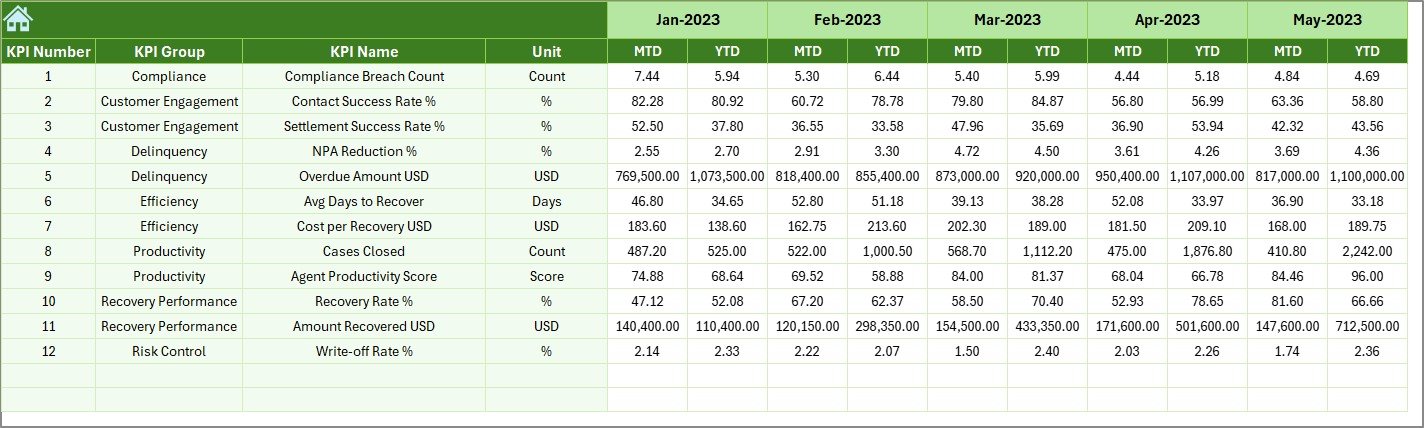
What KPIs Appear on the Dashboard Sheet?
The dashboard displays both MTD and YTD performance metrics.
Month-to-Date (MTD) Metrics
-
MTD Actual recovery value
-
MTD Target recovery value
-
MTD Previous Year recovery value
-
Target vs Actual (MTD) percentage
-
PY vs Actual (MTD) comparison
Conditional formatting with up and down arrows highlights performance direction clearly.
Year-to-Date (YTD) Metrics
-
YTD Actual recovery value
-
YTD Target recovery value
-
YTD Previous Year recovery value
-
Target vs Actual (YTD) percentage
-
PY vs Actual (YTD) comparison
Because of these visuals, users immediately understand short-term and long-term recovery results.
Click to Purchases Loan Recovery Services KPI Dashboard in Excel
KPI Trend Sheet: How Can You Analyze Recovery Trends?
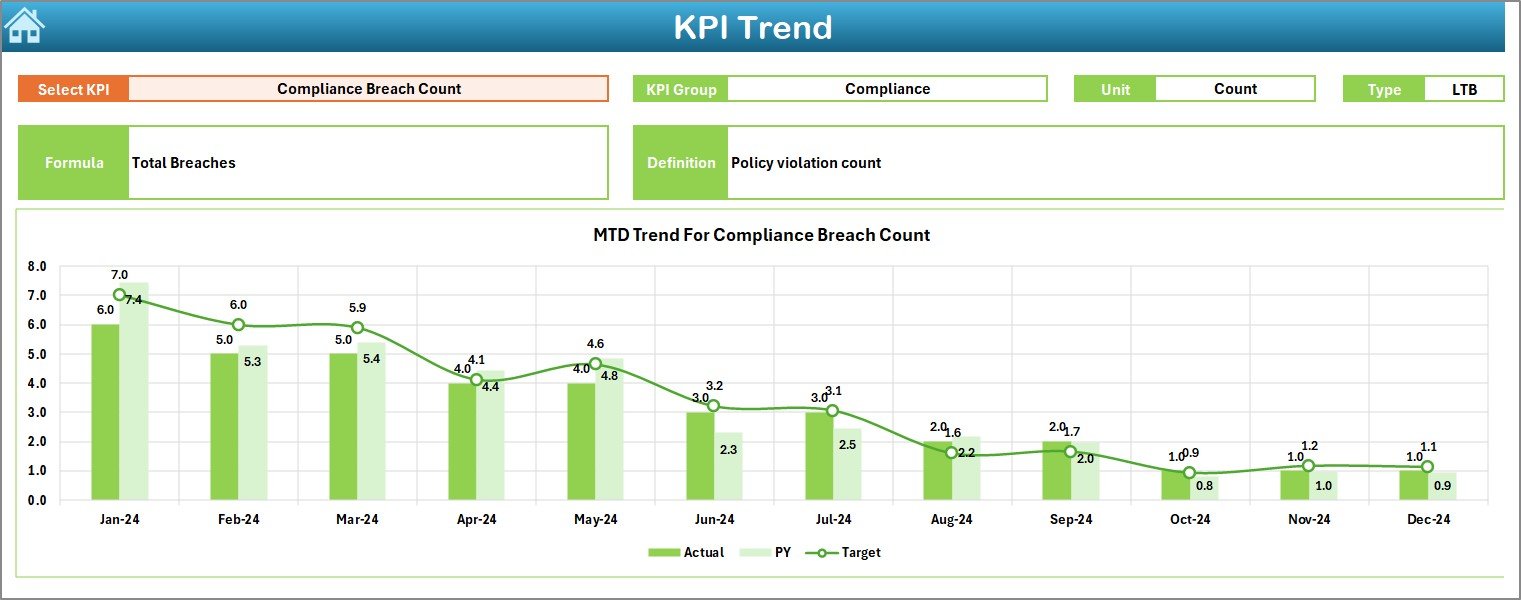
The KPI Trend Sheet supports deeper KPI-level analysis.
KPI Selection
-
Users select a KPI Name from the drop-down at cell C3
-
All KPI-related details update automatically
KPI Information Displayed
-
KPI Group
-
Unit of KPI
-
KPI Type (Lower the Better or Upper the Better)
-
KPI Formula
-
KPI Definition
This information ensures clarity and transparency for every KPI.
Trend Charts on the KPI Trend Sheet
-
MTD Trend Chart for Actual, Target, and Previous Year
-
YTD Trend Chart for Actual, Target, and Previous Year
As a result, recovery managers easily identify improvement patterns and issues.
Click to Purchases Loan Recovery Services KPI Dashboard in Excel
Actual Numbers Input Sheet: Where Do You Enter Actual Recovery Data?
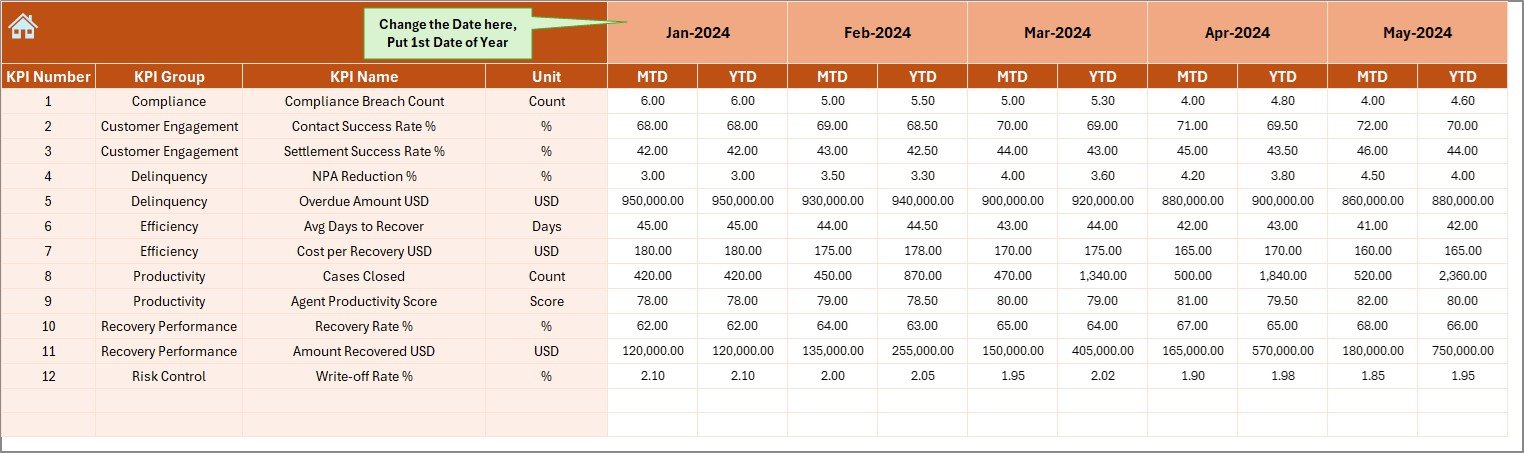
The Actual Numbers Input Sheet stores real recovery performance values.
How Do You Use This Sheet?
-
Enter MTD and YTD actual numbers
-
Select the first month of the year in cell E1
-
Change months dynamically as required
This approach keeps data entry simple and clean.
Target Sheet: How Do You Define Recovery Goals?
The Target Sheet records planned recovery benchmarks.
What Data Goes Here?
-
MTD Target values for each KPI
-
YTD Target values for each KPI
Since targets remain separate from actuals, comparisons stay accurate.
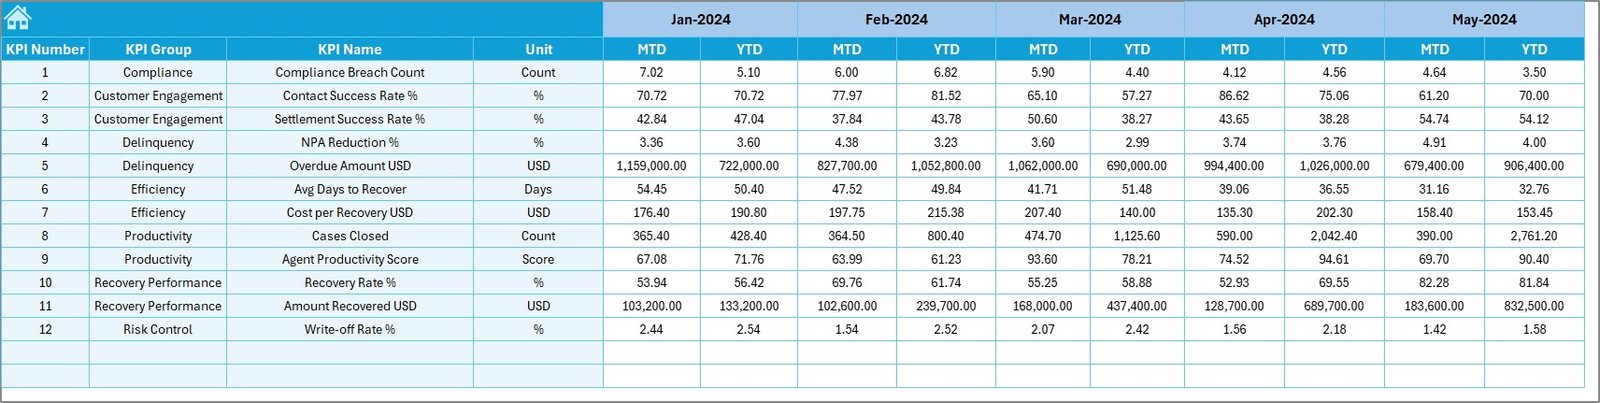
Previous Year Number Sheet: Why Is Historical Data Important?
The Previous Year Number Sheet stores last year’s recovery values.
Benefits of This Sheet
-
Enables year-over-year performance comparison
-
Highlights improvement or decline clearly
-
Supports trend-based decision-making
Therefore, recovery teams understand long-term performance better.
KPI Definition Sheet: How Do You Standardize Recovery Metrics?
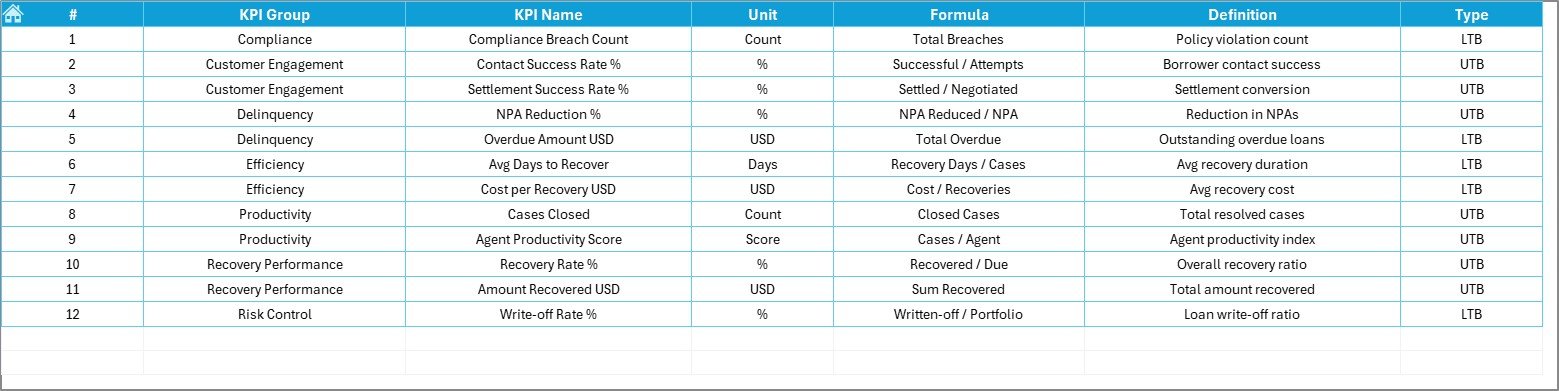
The KPI Definition Sheet defines KPI logic and structure.
Required Details in This Sheet
-
KPI Name
-
KPI Group
-
Unit
-
Formula
-
KPI Definition
As a result, KPI tracking remains consistent across users and periods.
Click to Purchases Loan Recovery Services KPI Dashboard in Excel
Advantages of Loan Recovery Services KPI Dashboard in Excel
Using this dashboard delivers strong operational and strategic benefits.
-
✅ Centralized recovery performance monitoring
-
✅ Clear MTD and YTD visibility
-
✅ Easy comparison with targets and previous year
-
✅ Visual performance indicators with arrows
-
✅ Faster recovery decision-making
-
✅ No dependency on complex BI tools
Because of these advantages, recovery teams improve efficiency and accountability.
Best Practices for the Loan Recovery Services KPI Dashboard in Excel
Following best practices ensures reliable insights.
-
Define KPIs clearly before implementation
-
Use consistent KPI units across periods
-
Update actual numbers on a fixed schedule
-
Review targets regularly for relevance
-
Always analyze MTD and YTD together
-
Keep historical data accurate
When teams follow these practices, dashboard results remain trustworthy.
Common Mistakes to Avoid When Using the Dashboard
Avoiding common errors improves dashboard accuracy.
-
Avoid changing Excel formulas accidentally
-
Do not mix actual and target data in one sheet
-
Avoid skipping previous year data entry
-
Do not overload the dashboard with too many KPIs
-
Avoid inconsistent month selection logic
By avoiding these mistakes, users maintain data integrity.
Who Should Use the Loan Recovery Services KPI Dashboard?
This dashboard fits multiple financial roles.
-
Loan Recovery Teams
-
Credit Risk Managers
-
Collection Department Heads
-
Finance and Analytics Teams
-
Senior Management
Since the dashboard stays Excel-based, all users adopt it easily.
Conclusion
A Loan Recovery Services KPI Dashboard in Excel transforms scattered recovery data into a structured performance monitoring system. It improves transparency, supports proactive recovery actions, and strengthens financial discipline.
By tracking MTD and YTD recovery performance against targets and previous year data, organizations gain clear insights into recovery efficiency. As a result, they reduce credit risk and improve cash flow.
For any organization managing loans and recoveries, this dashboard becomes a practical and powerful performance management tool.
Click to Purchases Loan Recovery Services KPI Dashboard in Excel
Frequently Asked Questions (FAQs)
What is the main purpose of a Loan Recovery KPI Dashboard?
It helps track recovery performance against targets and historical results in one Excel dashboard.
Can I update recovery data every month easily?
Yes. You only need to update the Actual Numbers, Target, and Previous Year sheets.
Does the dashboard support MTD and YTD analysis?
Yes. The dashboard provides both MTD and YTD performance metrics clearly.
Can I add more KPIs to the dashboard?
Yes. You can add KPIs by updating the KPI Definition and input sheets.
Does this dashboard require advanced Excel skills?
No. Basic Excel knowledge is sufficient to use and maintain it.
Is this dashboard suitable for banks and NBFCs?
Yes. It works well for banks, NBFCs, microfinance institutions, and lenders.
Click to Purchases Loan Recovery Services KPI Dashboard in Excel
Visit our YouTube channel to learn step-by-step video tutorials