Smart cities continue to grow in complexity every year. Because governments and urban authorities manage infrastructure projects, digital transformation initiatives, sustainability programs, and public service improvements at the same time, project visibility and control become critical. However, when project data remains scattered across spreadsheets and reports, decision-making slows down and risks increase.
That is exactly why a Smart Cities Project Management Dashboard in Power BI becomes an essential solution.
In this detailed and SEO-friendly article, you will learn what a Smart Cities Project Management Dashboard in Power BI is, why smart city projects need it, how it works, its page structure, key features, advantages, best practices, and frequently asked questions. By the end of this guide, you will clearly understand how this Power BI dashboard helps city planners, project managers, and government leaders manage smart city projects with confidence and clarity.
Click to Purchases Smart Cities Project Management Dashboard in Power BI
What Is a Smart Cities Project Management Dashboard in Power BI?
A Smart Cities Project Management Dashboard in Power BI is an interactive and visual analytics solution designed to monitor, analyze, and control smart city projects in one centralized platform.
Instead of tracking projects through manual spreadsheets, emails, and static reports, this dashboard consolidates budget, cost, progress, delays, and performance metrics into dynamic Power BI pages. As a result, stakeholders can quickly identify risks, control budgets, and improve project execution.
Moreover, because Power BI connects easily with multiple data sources, this dashboard supports real-time or scheduled updates. Therefore, decision-makers always work with accurate and up-to-date information.
Why Do Smart City Projects Need a Project Management Dashboard?
Smart city initiatives involve multiple departments, cities, project types, and timelines. Because of this complexity, traditional reporting methods fail to provide clarity.
Here is why smart city projects need a dedicated Power BI dashboard:
-
Multiple projects run simultaneously across departments and cities
-
Budgets remain large and highly sensitive
-
Delays impact public services and citizen trust
-
Leaders need real-time insights instead of monthly reports
-
Data must support transparency and accountability
Therefore, a Smart Cities Project Management Dashboard in Power BI acts as a single source of truth for all project-related decisions.
How Does a Smart Cities Project Management Dashboard in Power BI Work?
This dashboard works by transforming raw project data into visual insights. First, project data gets collected from systems such as Excel, ERP tools, project management software, or databases. Then, Power BI cleans, models, and visualizes the data.
After that, users interact with slicers, charts, and filters to analyze:
-
Actual cost vs planned budget
-
Project progress and delays
-
Department-wise and city-wise performance
-
Monthly cost and variance trends
As a result, teams spend less time preparing reports and more time improving outcomes.
What Pages Are Included in the Smart Cities Project Management Dashboard in Power BI?
This dashboard contains five structured and purpose-driven pages. Each page focuses on a specific analytical angle, which ensures clarity and ease of use.
1. What Is Shown on the Overview Page?
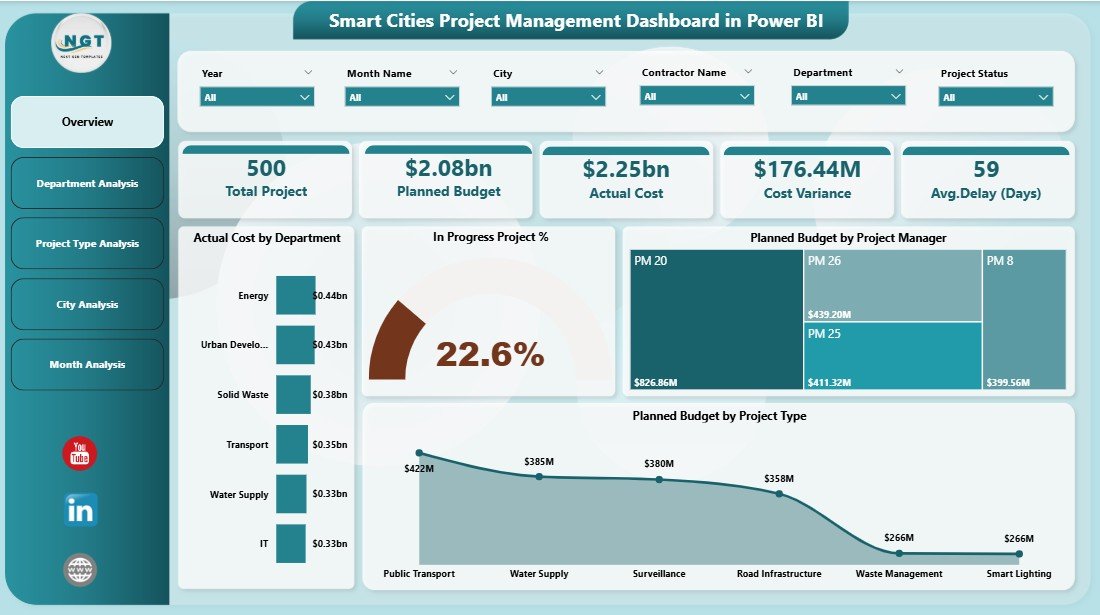
The Overview Page serves as the entry point of the dashboard. Because decision-makers need a quick snapshot, this page summarizes key project metrics at a glance.
Key Features of the Overview Page
Slicers (Filters):
-
Department
-
City
-
Project Manager
-
Project Type
KPI Cards:
-
Actual Cost
-
Planned Budget
-
In-Progress Project Percentage
-
Cost Variance
Charts on the Overview Page:
-
Actual Cost by Department
-
In-Progress Project %
-
Planned Budget by Project Manager
-
Planned Budget by Project Type
Because this page delivers instant insights, leaders can immediately identify areas that require attention.
Click to Purchases Smart Cities Project Management Dashboard in Power BI
2. How Does the Department Analysis Page Help?
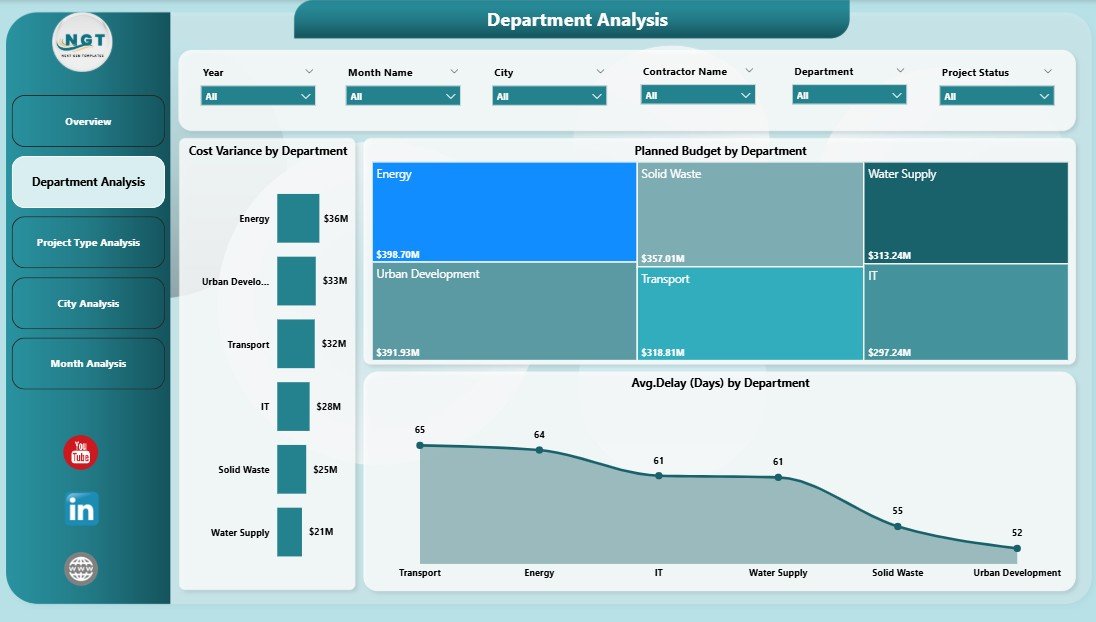
The Department Analysis Page focuses on departmental performance. Since smart city projects span multiple departments, understanding department-level efficiency becomes critical.
Key Charts on the Department Analysis Page
-
Cost Variance by Department
-
Planned Budget by Department
-
Average Delay by Department
With these visuals, managers can easily identify which departments control costs well and which ones need corrective actions.
3. Why Is Project Type Analysis Important?
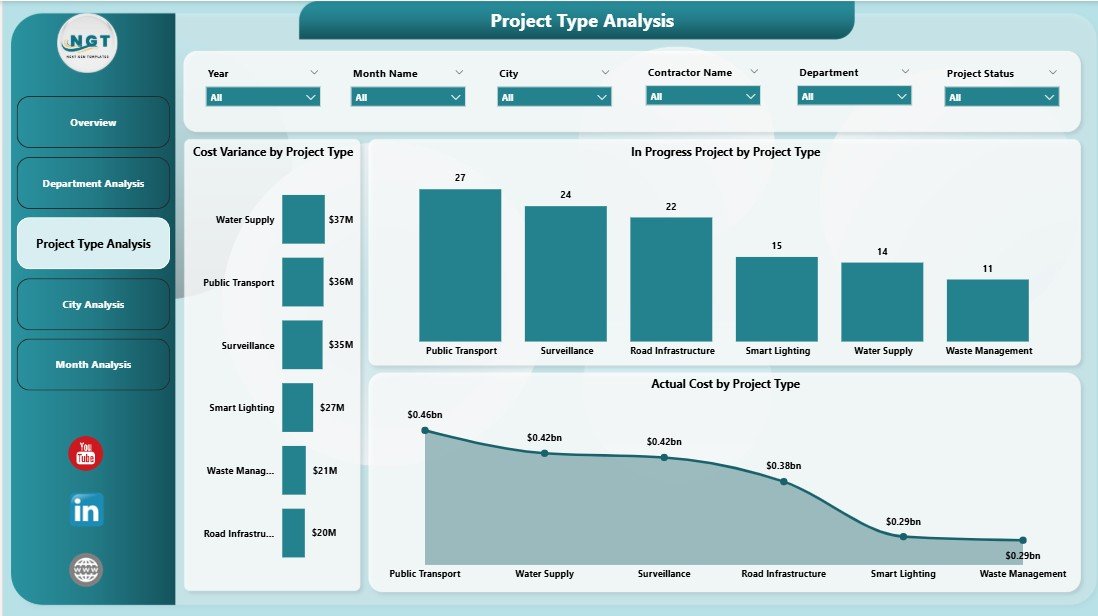
Smart city initiatives include infrastructure projects, IT projects, sustainability programs, transportation upgrades, and more. Because each project type behaves differently, analyzing them separately improves planning accuracy.
Key Charts on the Project Type Analysis Page
-
Cost Variance by Project Type
-
In-Progress Projects by Project Type
-
Actual Cost by Project Type
This page helps stakeholders understand which project categories face higher risks or cost overruns.
4. How Does the City Analysis Page Improve Urban Planning?
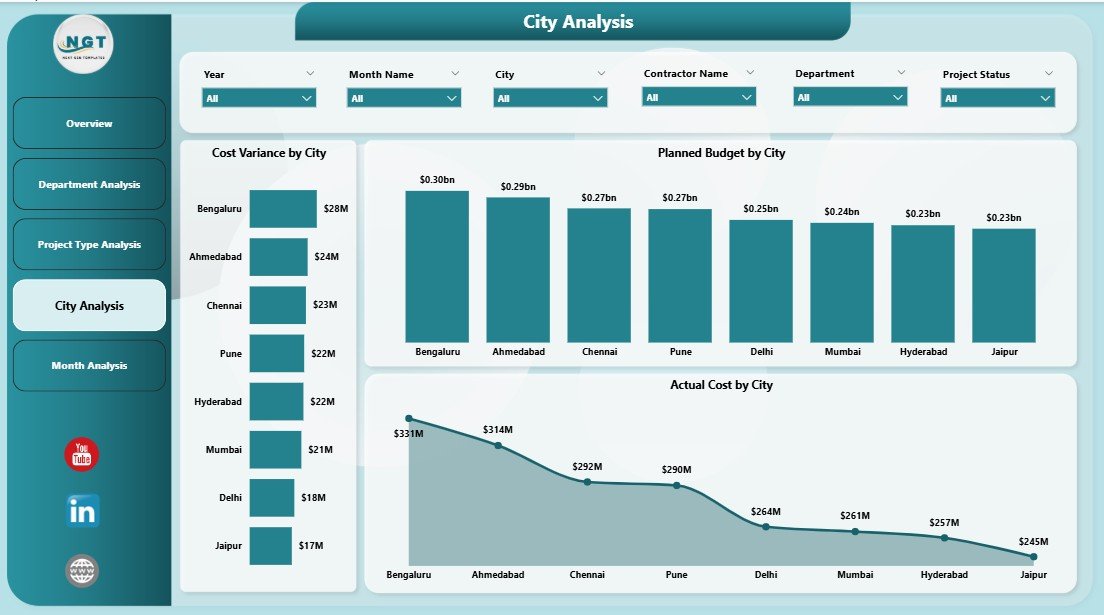
Smart city programs often span multiple cities or zones. Therefore, city-level analysis supports better regional planning and budget allocation.
Key Charts on the City Analysis Page
-
Cost Variance by City
-
Planned Budget by City
-
Actual Cost by City
Because this page highlights city-wise performance, leaders can compare cities and prioritize investments effectively.
Click to Purchases Smart Cities Project Management Dashboard in Power BI
5. Why Are Monthly Trends Critical for Smart City Projects?
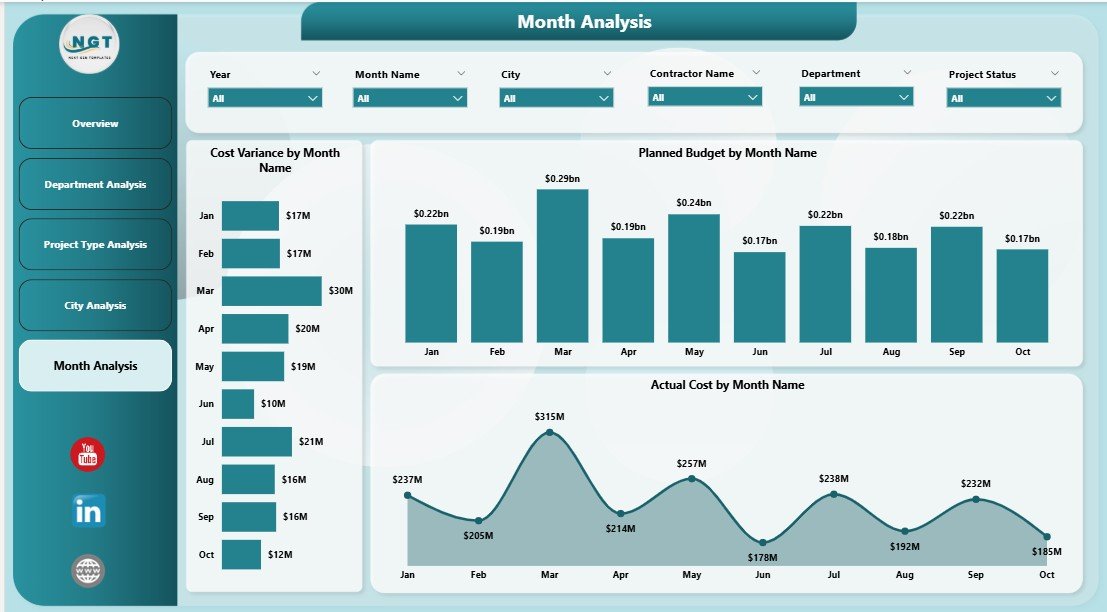
Project performance changes over time. Because trends reveal patterns, the Monthly Trends Page becomes essential for forecasting and planning.
Key Charts on the Monthly Trends Page
-
Cost Variance by Month
-
Planned Budget by Month
-
Actual Cost by Month
With these insights, project teams can anticipate future risks and adjust strategies early.
What Are the Key Features of a Smart Cities Project Management Dashboard in Power BI?
This dashboard includes several powerful features that enhance usability and insight generation.
Core Features
-
Interactive slicers for dynamic filtering
-
Real-time or scheduled data refresh
-
Drill-down and cross-filtering capabilities
-
Clean and professional visual design
-
Department-wise, city-wise, and project-wise analysis
Because of these features, the dashboard supports both strategic and operational decision-making.
Advantages of a Smart Cities Project Management Dashboard in Power BI
✅ Centralized Project Visibility
-
All smart city projects appear in one dashboard
-
No need to switch between multiple reports
✅ Improved Budget Control
-
Clear comparison of planned vs actual cost
-
Early detection of cost overruns
✅ Faster Decision-Making
-
Visual insights replace manual calculations
-
Leaders act quickly on emerging risks
✅ Enhanced Transparency
-
Clear accountability across departments and cities
-
Better communication with stakeholders
✅ Scalable and Flexible
-
Easy to add new projects or cities
-
Works for small and large smart city programs
How Does This Dashboard Support Smart City Governance?
Smart city governance demands data-driven decisions, transparency, and efficiency. This Power BI dashboard supports governance by:
-
Providing real-time performance monitoring
-
Supporting evidence-based budget approvals
-
Improving inter-departmental coordination
-
Enhancing public accountability
As a result, cities deliver projects faster and more efficiently.
Click to Purchases Smart Cities Project Management Dashboard in Power BI
Best Practices for the Smart Cities Project Management Dashboard in Power BI
Following best practices ensures long-term success and accuracy.
✔ Maintain Clean and Consistent Data
-
Standardize department and city names
-
Validate budget and cost fields regularly
✔ Use Clear KPIs
-
Define cost variance and delay metrics clearly
-
Align KPIs with smart city goals
✔ Refresh Data Regularly
-
Schedule automatic refresh cycles
-
Ensure stakeholders always see current data
✔ Limit Visual Clutter
-
Focus on meaningful charts
-
Avoid unnecessary visuals
✔ Train Users Properly
-
Educate teams on slicers and filters
-
Encourage self-service analysis
Who Can Benefit from a Smart Cities Project Management Dashboard in Power BI?
This dashboard benefits a wide range of stakeholders:
-
Smart city project managers
-
Municipal authorities
-
Urban planners
-
Government decision-makers
-
Infrastructure and IT teams
-
Finance and budgeting departments
Because it serves multiple roles, the dashboard becomes a shared analytical platform.
How Is Power BI Better Than Traditional Project Reports?
Traditional reports remain static and time-consuming. In contrast, Power BI dashboards offer:
-
Interactive exploration
-
Real-time updates
-
Visual storytelling
-
Reduced reporting effort
Therefore, organizations move from reactive reporting to proactive management.
What Challenges Does This Dashboard Help Solve?
This dashboard helps solve common smart city project challenges such as:
-
Budget overruns
-
Lack of visibility
-
Delayed reporting
-
Poor coordination
-
Inefficient resource allocation
With structured insights, teams address these issues effectively.
Conclusion: Why Should Smart Cities Use a Project Management Dashboard in Power BI?
A Smart Cities Project Management Dashboard in Power BI transforms how cities manage complex projects. Because it centralizes data, improves transparency, and enables real-time insights, it becomes an indispensable tool for modern urban governance.
Instead of relying on fragmented reports, smart city leaders gain a clear, interactive, and actionable view of project performance. As a result, cities deliver projects on time, control budgets effectively, and build sustainable urban environments.
Frequently Asked Questions (FAQs)
1. What data sources can connect to this Power BI dashboard?
This dashboard can connect to Excel files, databases, ERP systems, project management tools, and cloud data sources.
2. Can this dashboard handle multiple cities and departments?
Yes, the dashboard supports multiple cities, departments, and project types through dynamic slicers.
3. Is Power BI suitable for government and public sector projects?
Yes, Power BI supports security, scalability, and transparency, which makes it ideal for public sector use.
4. How often should data be refreshed?
Most organizations refresh data daily or weekly. However, Power BI also supports real-time updates if required.
5. Can non-technical users use this dashboard?
Yes, because the dashboard uses intuitive visuals and filters, non-technical users can easily explore insights.
6. Does this dashboard support future expansion?
Absolutely. You can add new KPIs, cities, or projects without rebuilding the entire dashboard.
Visit our YouTube channel to learn step-by-step video tutorials