Manufacturing operations run on precision, speed, and continuous improvement. However, many manufacturing teams still struggle with scattered data, delayed reporting, and unclear performance insights. As a result, leaders often make decisions based on assumptions instead of facts. That is exactly why a Manufacturing Operations KPI Dashboard in Excel becomes a powerful and practical solution.
In this detailed and SEO-friendly article, you will learn what a Manufacturing Operations KPI Dashboard in Excel is, why it matters, how it works, its complete worksheet-wise structure, advantages, best practices, and frequently asked questions. Moreover, this guide uses simple language, clear explanations, and real-world logic so you can apply everything immediately.
What Is a Manufacturing Operations KPI Dashboard in Excel?
Click to Purchases Manufacturing Operations KPI Dashboard in Excel
A Manufacturing Operations KPI Dashboard in Excel is a ready-to-use performance tracking system designed to monitor, analyze, and improve manufacturing KPIs in one centralized Excel file.
Instead of checking multiple spreadsheets, emails, and reports, this dashboard consolidates actual, target, and previous year data into a single interactive view. Consequently, manufacturing managers gain instant clarity on operational performance.
Because the dashboard runs in Microsoft Excel, teams do not need expensive software or technical expertise. They simply enter data, select a month, and review insights instantly.
Why Do Manufacturing Teams Need a KPI Dashboard in Excel?
Manufacturing operations generate massive amounts of data every day. However, without structure, this data loses its value. Therefore, a KPI dashboard becomes essential.
Here is why manufacturing teams actively use KPI dashboards:
-
They want real-time visibility into performance
-
They need quick comparisons between actual, target, and previous year
-
They want to identify issues early before they grow
-
They aim to improve productivity and efficiency
-
They need data-driven decision-making
Most importantly, Excel dashboards remain flexible, affordable, and easy to customize.
What KPIs Can You Track in a Manufacturing Operations KPI Dashboard?
A Manufacturing Operations KPI Dashboard in Excel supports a wide range of KPIs. For example:
-
Production Efficiency
-
Overall Equipment Effectiveness (OEE)
-
Defect Rate
-
Downtime
-
Cycle Time
-
Yield Percentage
-
Scrap Rate
-
On-Time Production
-
Capacity Utilization
-
Energy Consumption per Unit
Because the dashboard remains customizable, you can easily add or remove KPIs based on business needs.
How Does a Manufacturing Operations KPI Dashboard in Excel Work?
The dashboard works on a simple yet powerful logic.
First, you enter data in structured input sheets.
Next, Excel formulas calculate MTD and YTD values.
Then, charts, tables, and conditional formatting display insights visually.
Finally, slicers and drop-downs allow dynamic analysis.
As a result, users spend less time preparing reports and more time analyzing performance.
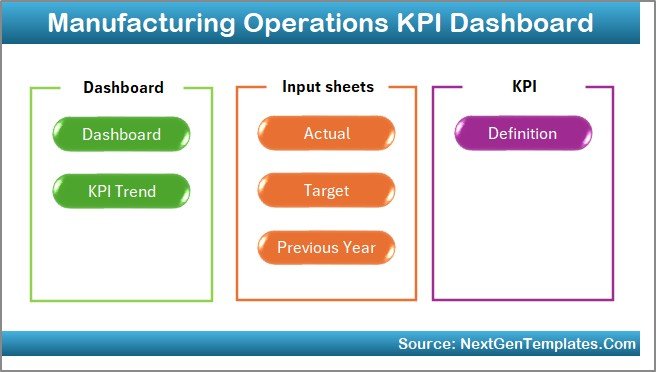
Complete Worksheet-Wise Structure of the Manufacturing Operations KPI Dashboard in Excel
This ready-to-use dashboard contains 7 well-organized worksheets, each serving a specific purpose. Let us explore each one in detail.
1. Home Sheet: How Does the Navigation Work?
The Home sheet acts as an index page for the entire dashboard.
Key Features of the Home Sheet
-
Clean and simple layout
-
6 navigation buttons
-
One-click access to all important sheets
-
User-friendly design for non-technical users
Because of this structure, users can move across sheets quickly without confusion.
2. Dashboard Sheet: How Do You Analyze Overall Performance?
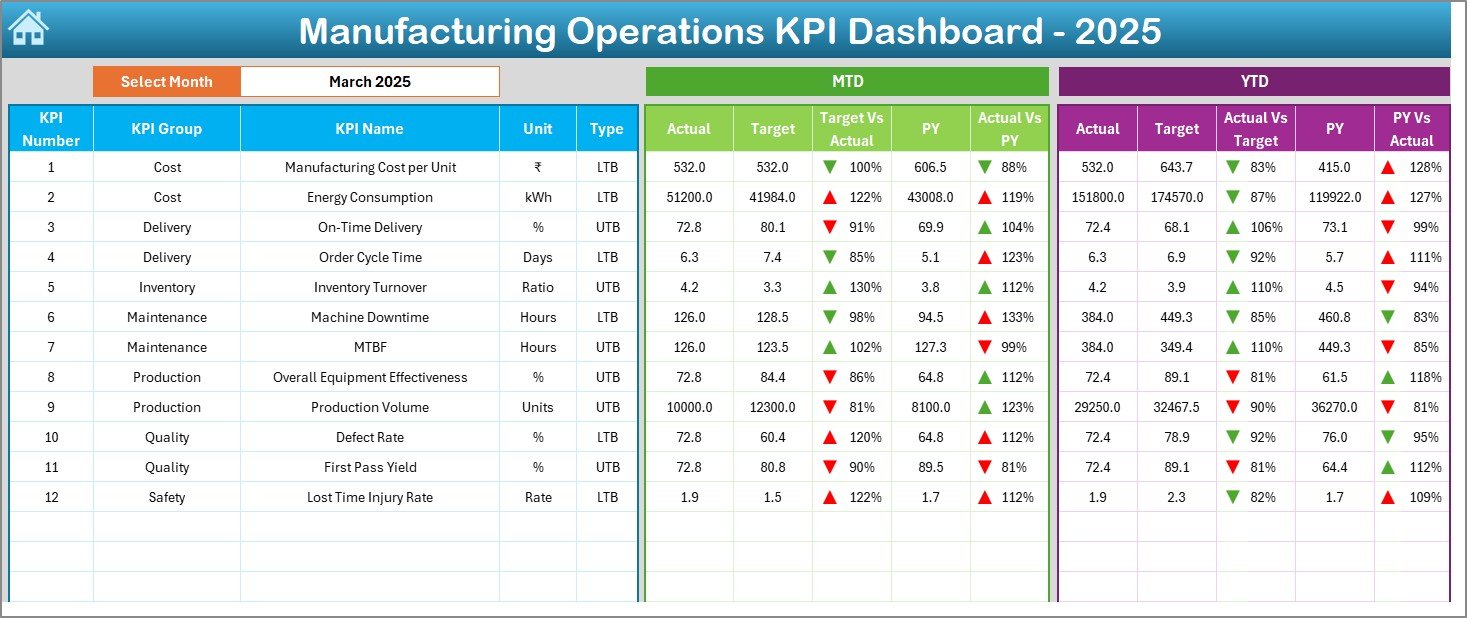
The Dashboard sheet is the heart of the Manufacturing Operations KPI Dashboard in Excel.
What Makes This Sheet Powerful?
-
Month selection drop-down available in cell D3
-
Automatic refresh of all KPIs based on selected month
-
Clear comparison between Actual, Target, and Previous Year
-
Visual indicators using conditional formatting arrows
KPIs Displayed on the Dashboard
For Month-to-Date (MTD):
-
Actual
-
Target
-
Previous Year
-
Target vs Actual (Up/Down Arrow)
-
Previous Year vs Actual (Up/Down Arrow)
For Year-to-Date (YTD):
-
Actual
-
Target
-
Previous Year
-
Target vs Actual (Up/Down Arrow)
-
Previous Year vs Actual (Up/Down Arrow)
As a result, managers immediately understand performance trends and gaps.
Click to Purchases Manufacturing Operations KPI Dashboard in Excel
3. KPI Trend Sheet: How Do You Track KPI Trends Over Time?
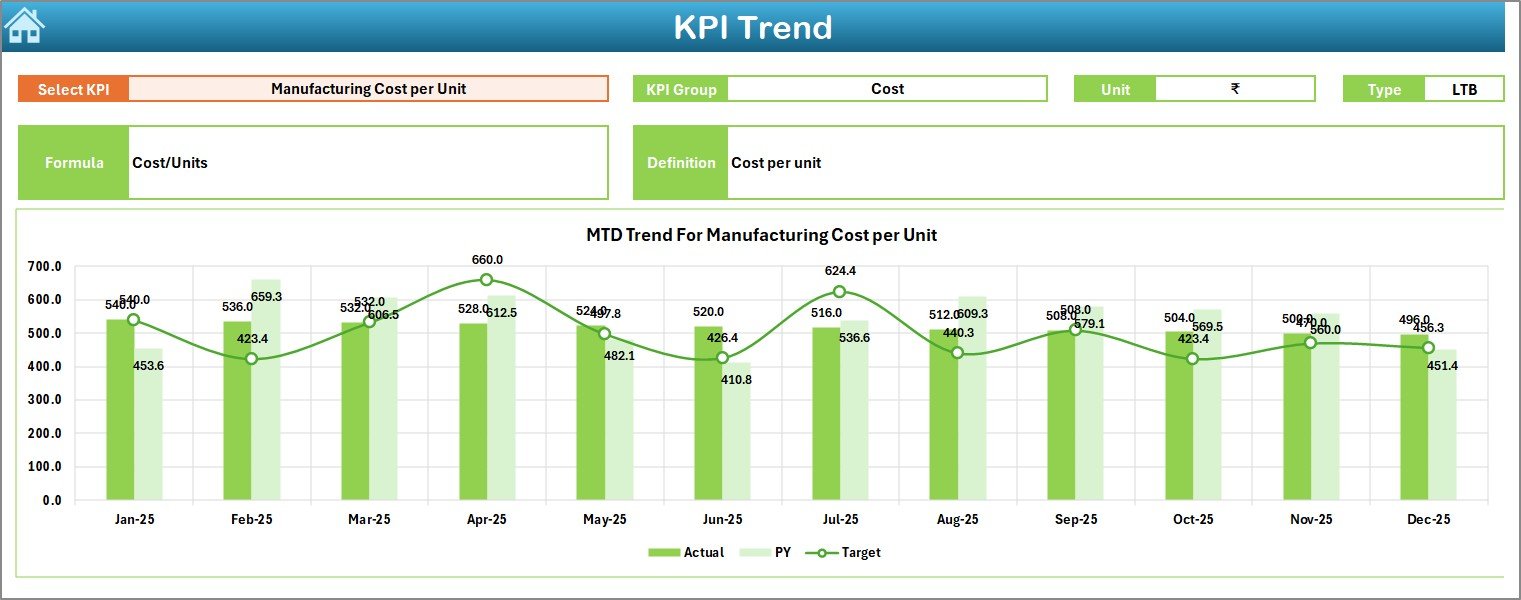
The KPI Trend sheet focuses on deep analysis of individual KPIs.
How Does This Sheet Work?
-
KPI selection drop-down in cell C3
-
Automatic display of:
-
KPI Group
-
Unit of Measurement
-
KPI Type (LTB or UTB)
-
Formula
-
Definition
-
Charts Included in This Sheet
-
MTD Trend Chart (Actual, Target, Previous Year)
-
YTD Trend Chart (Actual, Target, Previous Year)
Because of these trends, users easily identify improvement patterns or performance declines.
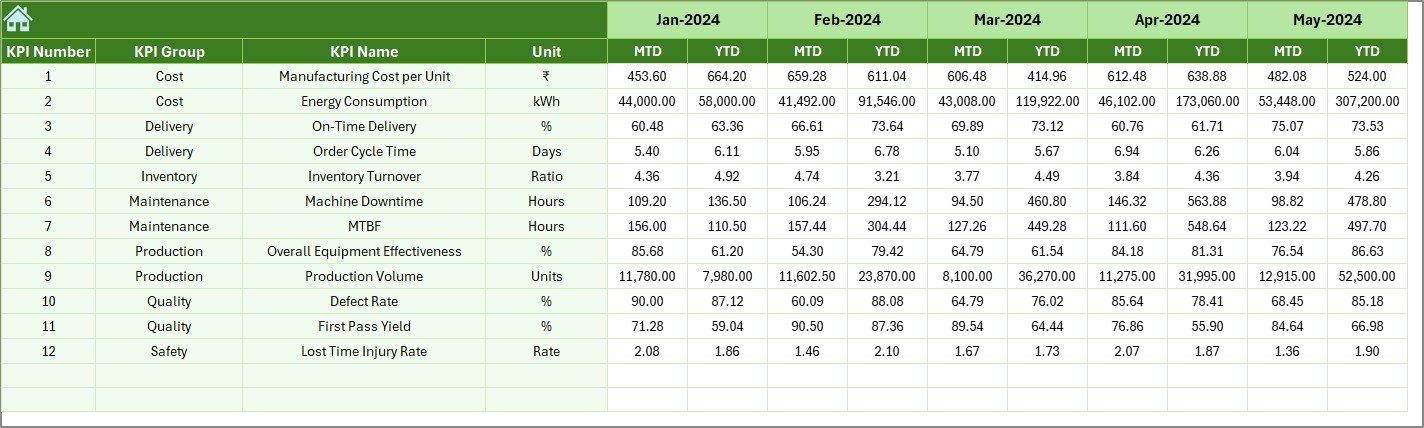
4. Actual Numbers Input Sheet: Where Do You Enter Actual Data?
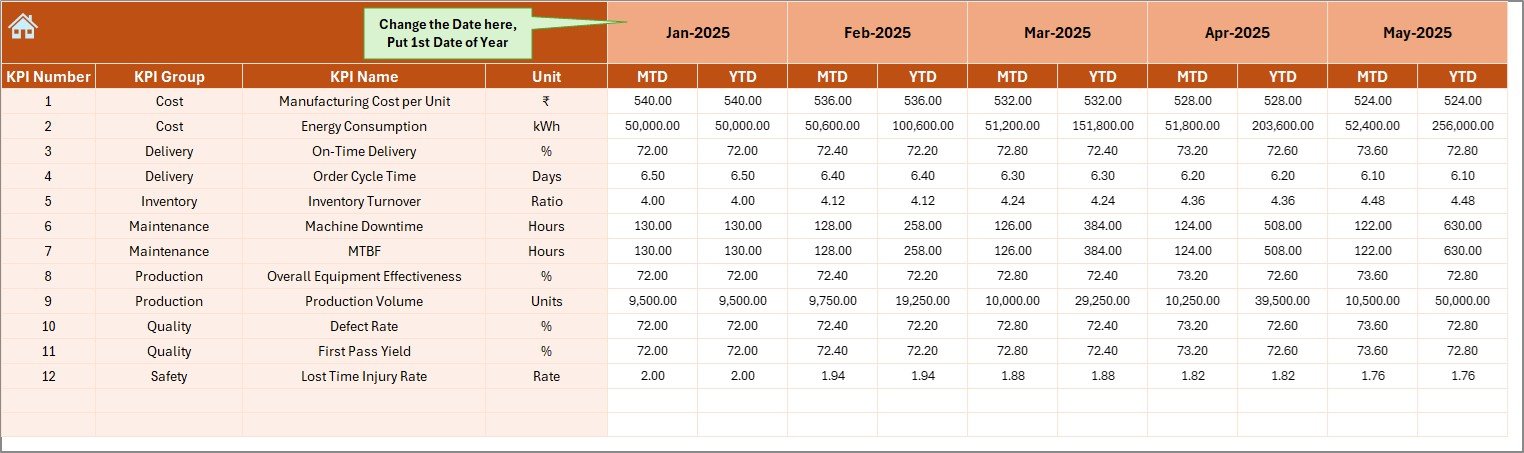
The Actual Numbers Input sheet captures real performance values.
How to Use This Sheet?
-
Enter MTD and YTD actual numbers for each KPI
-
Select the starting month of the year in cell E1
-
Change the month dynamically without restructuring data
Since data entry remains simple, errors reduce significantly.
5. Target Sheet: How Do You Define Performance Goals?
The Target Sheet tab stores monthly and yearly targets.
Key Benefits of This Sheet
-
Separate target entry for each KPI
-
MTD and YTD targets available
-
Easy alignment between goals and performance
Because targets remain visible, teams stay focused and accountable.
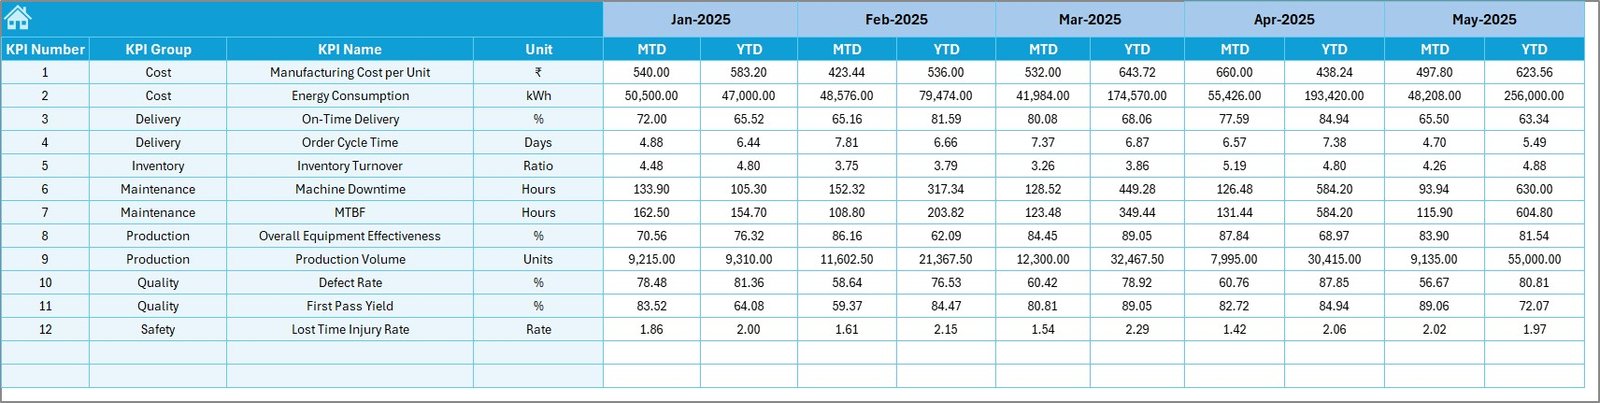
6. Previous Year Number Sheet: Why Is Historical Comparison Important?
The Previous Year Number sheet helps in benchmarking.
Why This Sheet Matters?
-
Enables year-over-year comparison
-
Highlights long-term trends
-
Supports strategic planning
You simply enter previous year values in the same format as current year data.
Click to Purchases Manufacturing Operations KPI Dashboard in Excel
7. KPI Definition Sheet: How Do You Maintain KPI Clarity?
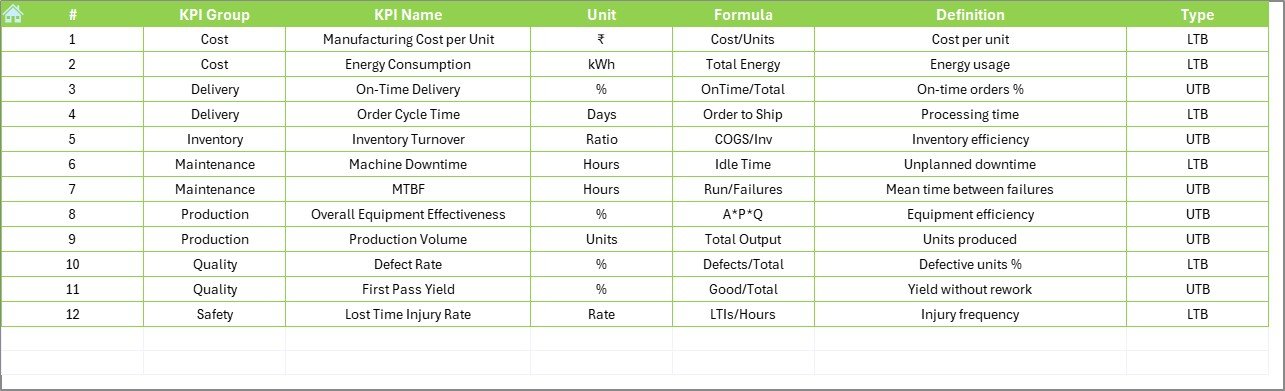
The KPI Definition sheet acts as a reference guide.
Information Stored in This Sheet
-
KPI Name
-
KPI Group
-
Unit
-
Formula
-
KPI Definition
Because of this sheet, everyone understands what each KPI means and how it is calculated.
Advantages of Manufacturing Operations KPI Dashboard in Excel
Using a Manufacturing Operations KPI Dashboard in Excel offers multiple advantages.
Key Advantages
-
📊 Centralized performance tracking
-
⏱️ Faster decision-making
-
📉 Early identification of issues
-
📈 Clear performance trends
-
💰 Cost-effective solution
-
🧩 Fully customizable structure
-
👥 Easy adoption across teams
Most importantly, Excel dashboards improve transparency and accountability.
How Does This Dashboard Support Better Decision-Making?
This dashboard transforms raw data into actionable insights.
-
Managers identify underperforming KPIs instantly
-
Teams adjust targets based on trends
-
Leaders compare current performance with past data
-
Operations teams focus on continuous improvement
As a result, decisions become faster, smarter, and more reliable.
Best Practices for the Manufacturing Operations KPI Dashboard in Excel
To get maximum value, you should follow best practices.
Best Practices You Should Follow
-
✅ Update data regularly
-
✅ Validate inputs to avoid errors
-
✅ Limit KPIs to what truly matters
-
✅ Use consistent units and definitions
-
✅ Review trends monthly and quarterly
-
✅ Train users on dashboard navigation
-
✅ Archive old data for reference
By following these practices, you maintain dashboard accuracy and relevance.
Common Challenges and How to Overcome Them
Although Excel dashboards offer flexibility, some challenges appear.
Common Challenges
-
Manual data entry errors
-
Too many KPIs causing clutter
-
Inconsistent definitions
-
Poor data discipline
How to Overcome Them
-
Use data validation
-
Keep KPIs focused
-
Maintain a KPI definition sheet
-
Assign ownership for data updates
With discipline, these challenges disappear quickly.
Click to Purchases Manufacturing Operations KPI Dashboard in Excel
Who Can Benefit from a Manufacturing Operations KPI Dashboard in Excel?
This dashboard suits a wide audience.
Ideal Users
-
Manufacturing Managers
-
Plant Heads
-
Operations Analysts
-
Quality Teams
-
Production Supervisors
-
Continuous Improvement Teams
Because Excel remains universal, everyone can use it easily.
Conclusion: Why Should You Use a Manufacturing Operations KPI Dashboard in Excel?
A Manufacturing Operations KPI Dashboard in Excel provides clarity, control, and confidence. Instead of relying on guesswork, manufacturing teams track real data, identify trends, and act quickly.
This ready-to-use dashboard structure—with 7 well-designed worksheets, MTD and YTD analysis, trend charts, and clear KPI definitions—makes performance management simple and effective.
If you want better visibility, faster decisions, and continuous improvement, this dashboard becomes an essential tool.
Frequently Asked Questions (FAQs)
What Is the Purpose of a Manufacturing Operations KPI Dashboard in Excel?
The dashboard helps track, analyze, and improve manufacturing performance using structured KPIs in Excel.
Can Beginners Use This Dashboard?
Yes. The dashboard uses simple layouts, drop-downs, and buttons, making it beginner-friendly.
Does This Dashboard Support MTD and YTD Analysis?
Yes. It displays MTD and YTD values for Actual, Target, and Previous Year.
Can I Customize KPIs in This Dashboard?
Absolutely. You can add, remove, or modify KPIs based on business needs.
Is This Dashboard Suitable for Small and Large Manufacturing Units?
Yes. The flexible design works for both small plants and large operations.
Do I Need Advanced Excel Skills to Use It?
No. Basic Excel knowledge is enough to use and maintain the dashboard.
How Often Should I Update the Dashboard?
You should update it monthly or weekly, depending on reporting needs.
Visit our YouTube channel to learn step-by-step video tutorials