In today’s business environment, organizations must track Environmental, Social, and Governance (ESG) performance with the same seriousness as financial results. Investors, regulators, customers, and internal leaders expect clear, measurable, and transparent ESG reporting. However, raw ESG data alone does not create impact. You must convert it into meaningful insights.
That is exactly where an ESG KPI Dashboard in Power BI becomes a powerful solution.
In this detailed and practical guide, you will learn what an ESG KPI Dashboard in Power BI is, why organizations need it, how it works, its page-wise structure, advantages, best practices, and frequently asked questions. Moreover, this article uses simple language, clear explanations, and real-world logic so you can apply everything immediately.
Click to Purchases ESG KPI Dashboard in Power BI
What Is an ESG KPI Dashboard in Power BI?
An ESG KPI Dashboard in Power BI is an interactive and visual reporting tool designed to monitor and analyze ESG performance metrics in one centralized place.
Instead of managing ESG data in multiple Excel files, emails, or static reports, this dashboard connects ESG data to Power BI and transforms it into slicers, KPI cards, tables, and trend charts.
As a result, decision-makers can:
-
Track ESG targets vs actuals
-
Compare current year and previous year performance
-
Monitor MTD and YTD ESG results
-
Identify risks and improvement areas quickly
Why Do Organizations Need an ESG KPI Dashboard in Power BI?
ESG reporting involves complex data across departments. Environmental teams track emissions, HR teams monitor diversity, and governance teams follow compliance metrics. Therefore, without a dashboard, ESG reporting becomes slow and error-prone.
An ESG KPI Dashboard in Power BI solves this problem by creating one source of truth.
Key Reasons Organizations Need It
-
ESG regulations and disclosures increase every year
-
Investors demand transparent ESG metrics
-
Manual ESG reporting consumes too much time
-
Leadership needs real-time ESG visibility
-
Targets vs performance tracking is critical
Because of these reasons, ESG dashboards are no longer optional. Instead, they are essential.
What Makes an ESG KPI Dashboard in Power BI Powerful?
Power BI offers interactive visuals, dynamic filters, and strong calculation capabilities. Therefore, when you combine ESG KPIs with Power BI, you gain both clarity and control.
Key Strengths of Power BI for ESG Reporting
-
Interactive slicers for Month and KPI Group
-
Real-time data refresh from Excel
-
Clear MTD and YTD tracking
-
Drill-through for KPI details
-
Visual indicators for performance status
As a result, ESG data becomes easy to understand and easy to act on.
What Are the Key Features of the ESG KPI Dashboard in Power BI?
The ESG KPI Dashboard in Power BI is a ready-to-use dashboard that uses Excel as a data source. You only need to update the Excel file, and the dashboard refreshes automatically.
This dashboard contains three well-structured pages, each designed for a specific analytical purpose.
How Does the Summary Page Work in the ESG KPI Dashboard?
What Is the Purpose of the Summary Page?
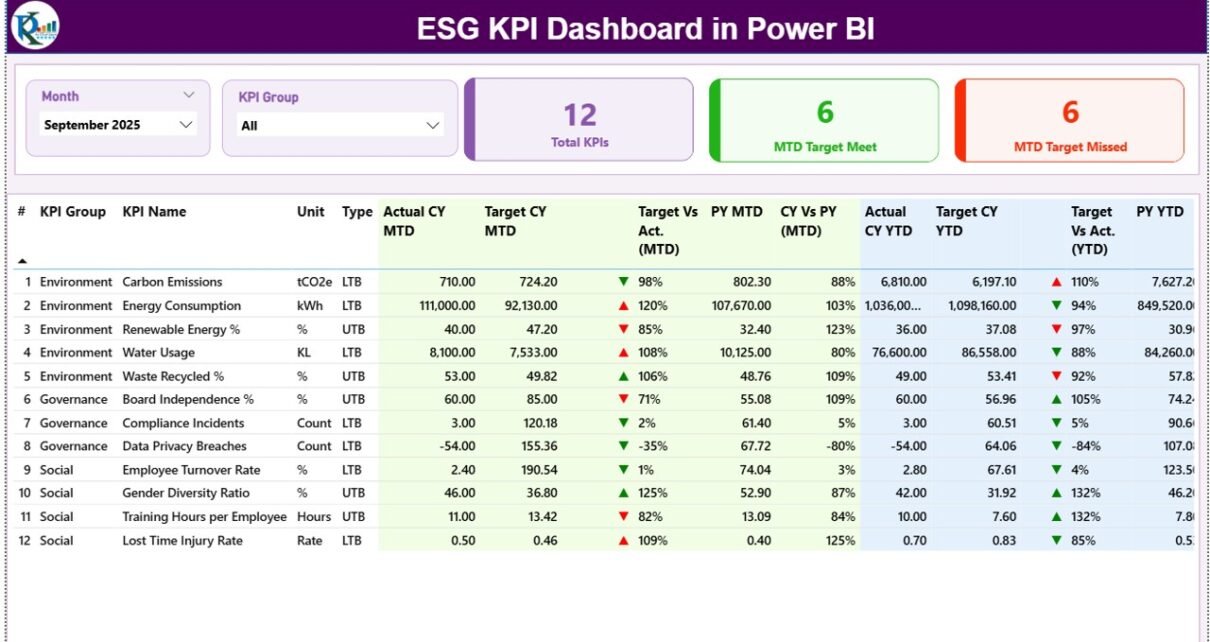
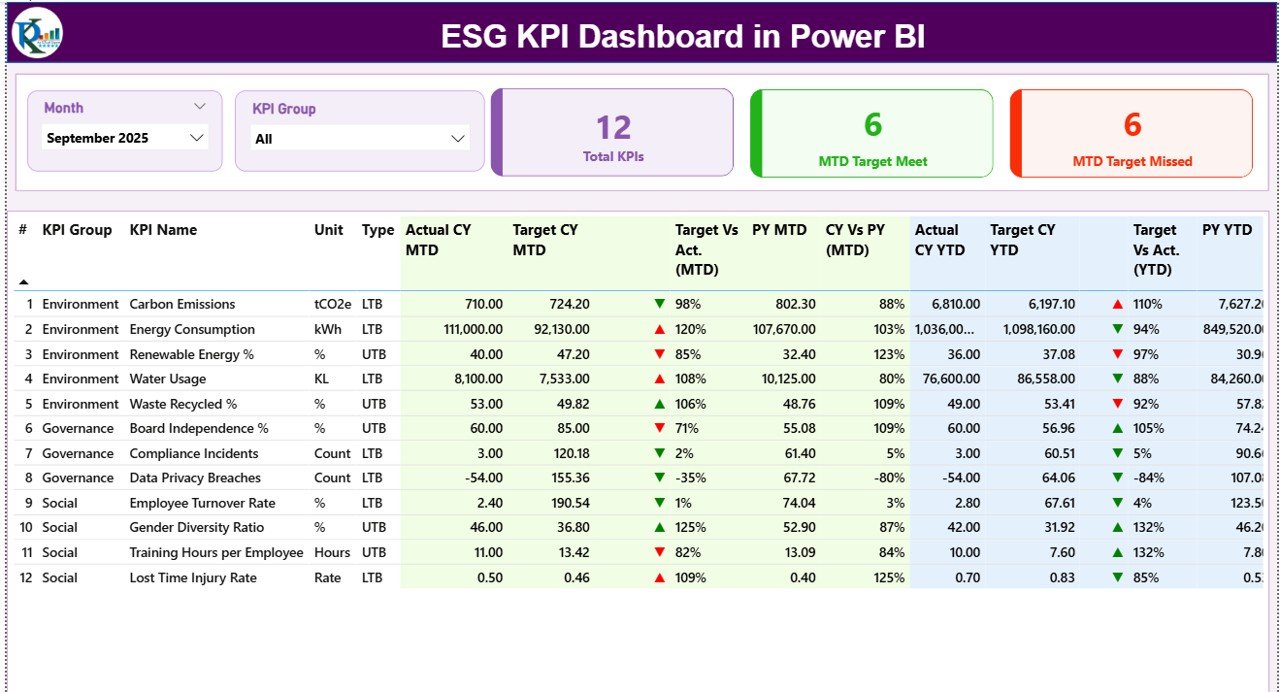
The Summary Page is the main landing page of the ESG KPI Dashboard in Power BI. It gives users a complete snapshot of ESG performance at a glance.
What Slicers Are Available on the Summary Page?
At the top of the page, you will find:
-
Month slicer – filters data by selected month
-
KPI Group slicer – filters ESG category such as Environmental, Social, or Governance
Because of these slicers, users can instantly change the view without touching the data.
What KPI Cards Are Shown on the Summary Page?
Click to Purchases ESG KPI Dashboard in Power BI
The Summary Page displays three KPI cards:
-
Total KPIs Count
-
MTD Target Meet Count
-
MTD Target Missed Count
These cards quickly show whether ESG performance stays on track or needs attention.
What Details Does the ESG KPI Table Show?
Below the KPI cards, the dashboard displays a detailed ESG KPI table with the following columns:
-
KPI Number – sequence number of the KPI
-
KPI Group – ESG category
-
KPI Name – name of the ESG metric
-
Unit – unit of measurement
-
Type – LTB (Lower the Better) or UTB (Upper the Better)
How Does MTD Performance Get Displayed?
The dashboard clearly shows Month-to-Date (MTD) performance using:
-
Actual CY MTD – current year actual MTD value
-
Target CY MTD – current year target MTD value
-
MTD Icon – ▲ or ▼ with green/red color
-
Target vs Actual (MTD) – Actual ÷ Target
-
PY MTD – previous year MTD value
-
CY vs PY (MTD) – CY MTD ÷ PY MTD
As a result, users can immediately see performance gaps.
How Does YTD Performance Get Displayed?
Similarly, Year-to-Date (YTD) performance includes:
-
Actual CY YTD
-
Target CY YTD
-
YTD Icon (▲ / ▼)
-
Target vs Actual (YTD)
-
PY YTD
-
CY vs PY (YTD)
Therefore, long-term ESG trends remain visible and measurable.
How Does the KPI Trend Page Help ESG Analysis?
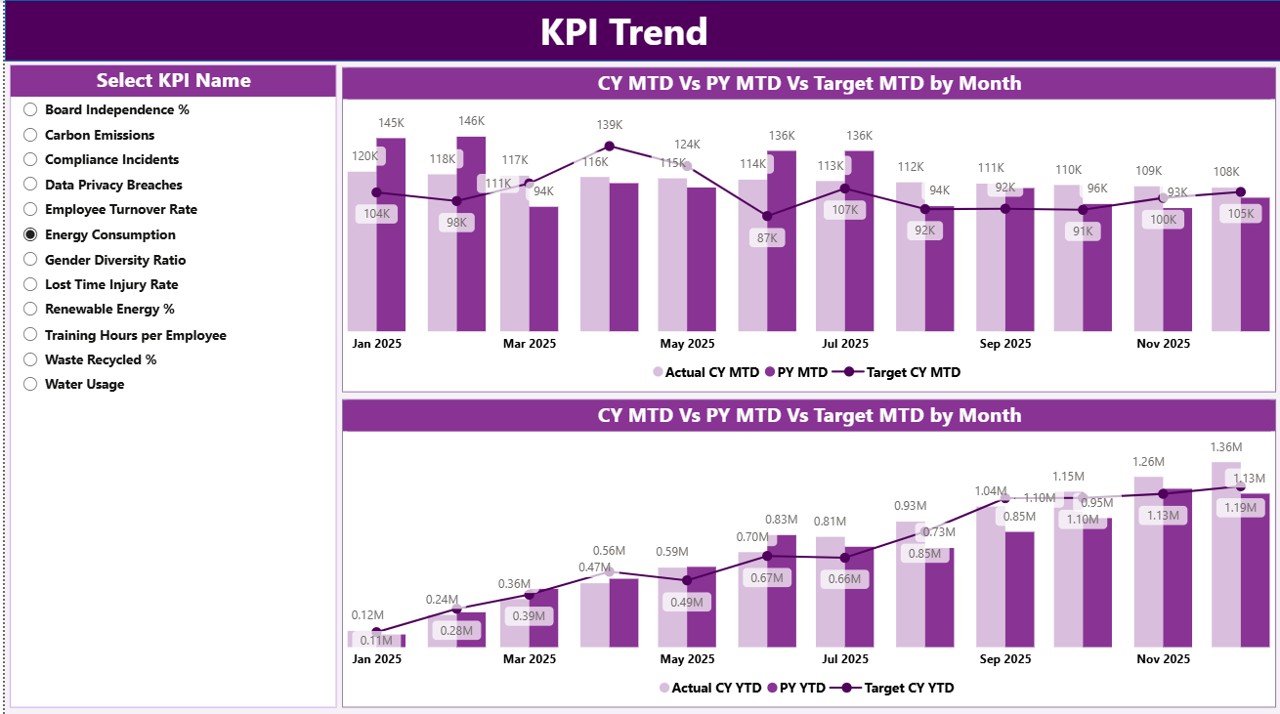
What Is the Purpose of the KPI Trend Page?
The KPI Trend Page focuses on performance trends over time. While the Summary Page shows snapshots, this page explains movement and direction.
What Charts Are Used on the KPI Trend Page?
This page displays two combo charts:
-
MTD Trend Chart
-
Actual CY
-
Previous Year
-
Target
-
-
YTD Trend Chart
-
Actual CY
-
Previous Year
-
Target
-
Because of these combo charts, users can visually compare ESG performance over time.
How Do Users Select KPIs?
A KPI Name slicer on the left allows users to choose a specific KPI. Once selected, both charts update instantly.
As a result, root-cause analysis becomes faster and easier.
Click to Purchases ESG KPI Dashboard in Power BI
What Is the KPI Definition Page and Why Is It Important?
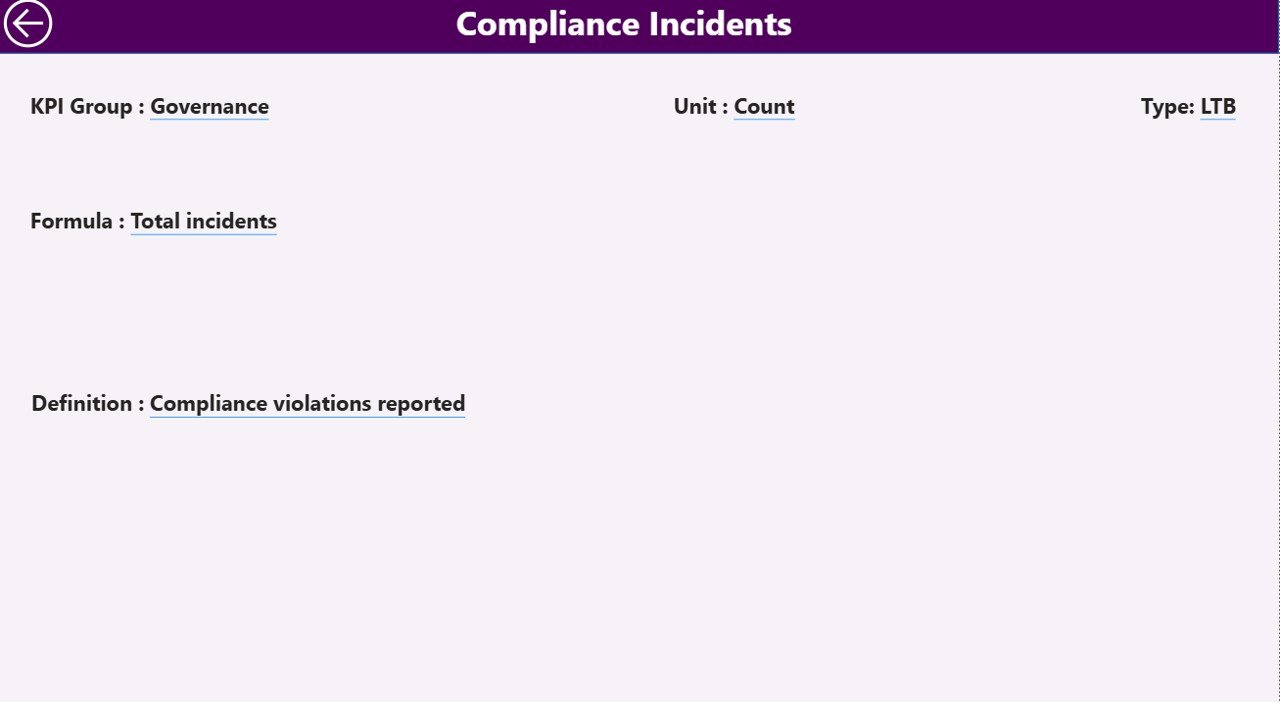
What Is the KPI Definition Page?
The KPI Definition Page is a hidden drill-through page. It provides detailed context for each KPI.
What Information Does the KPI Definition Page Show?
This page displays:
-
KPI Formula
-
KPI Definition
-
KPI Type (LTB or UTB)
Therefore, users always understand what a KPI means and how it is calculated.
How Do Users Navigate Back?
A Back button at the top-left corner allows users to return to the Summary Page easily.
How Does the Excel Data Source Work for the ESG KPI Dashboard?
The ESG KPI Dashboard in Power BI uses Excel as the data source, which makes it simple and flexible.
What Is the Input_Actual Sheet Used For?
In the Input_Actual sheet, users enter:
-
KPI Name
-
Month (first date of the month)
-
Actual MTD value
-
Actual YTD value
This sheet captures real ESG performance.
What Is the Input_Target Sheet Used For?
In the Input_Target sheet, users enter:
-
KPI Name
-
Month (first date of the month)
-
Target MTD value
-
Target YTD value
This sheet defines ESG goals.
What Is the KPI Definition Sheet Used For?
In the KPI Definition sheet, users enter:
-
KPI Number
-
KPI Group
-
KPI Name
-
Unit
-
Formula
-
Definition
-
Type (LTB or UTB)
This sheet acts as the ESG KPI master.
Advantages of ESG KPI Dashboard in Power BI
Why Should Organizations Use This Dashboard?
An ESG KPI Dashboard in Power BI delivers multiple benefits.
Key Advantages
-
📊 Centralized ESG reporting
-
⏱ Faster ESG decision-making
-
📈 Clear target vs actual tracking
-
🔍 Improved ESG transparency
-
🔄 Easy Excel-based data updates
-
🎯 Better compliance readiness
As a result, organizations stay proactive instead of reactive.
Who Can Benefit from an ESG KPI Dashboard in Power BI?
Click to Purchases ESG KPI Dashboard in Power BI
This dashboard supports many stakeholders.
Key Users
-
Sustainability teams
-
ESG managers
-
Compliance officers
-
Senior leadership
-
Investors and analysts
-
Consultants and auditors
Because of its flexibility, the dashboard adapts to different roles.
Best Practices for the ESG KPI Dashboard in Power BI
To maximize value, follow these best practices.
1. Standardize KPI Definitions
Always maintain clear and consistent KPI definitions.
2. Keep Units Consistent
Use the same units across months and years.
3. Update Data Monthly
Regular updates ensure accurate ESG insights.
4. Validate Targets Carefully
Incorrect targets create misleading insights.
5. Use LTB and UTB Correctly
Correct KPI types improve indicator accuracy.
6. Review Trends, Not Just Snapshots
Trend analysis reveals long-term ESG progress.
How Does This Dashboard Support ESG Decision-Making?
This dashboard converts ESG data into actionable insights.
-
Leaders identify weak ESG areas
-
Teams track progress against commitments
-
Organizations prepare for audits
-
Management aligns ESG strategy with goals
Therefore, ESG decisions become data-driven and confident.
Conclusion: Why ESG KPI Dashboard in Power BI Is Essential
An ESG KPI Dashboard in Power BI transforms complex ESG data into clear, interactive, and meaningful insights. It eliminates manual reporting, improves transparency, and supports smarter ESG decisions.
Because ESG performance now defines business credibility, this dashboard acts as a strategic ESG control center. With simple Excel inputs and powerful Power BI visuals, organizations gain clarity, confidence, and compliance readiness.
Frequently Asked Questions About ESG KPI Dashboard in Power BI
What is an ESG KPI Dashboard in Power BI?
It is an interactive dashboard that tracks ESG performance using KPIs, trends, and comparisons.
Does this dashboard use Excel as a data source?
Yes, it uses Excel with Input_Actual, Input_Target, and KPI Definition sheets.
Can I track both MTD and YTD ESG performance?
Yes, the dashboard shows MTD and YTD metrics with comparisons.
Does the dashboard support previous year comparison?
Yes, it compares current year and previous year for both MTD and YTD.
Can I customize ESG KPIs?
Yes, you can add, remove, or modify KPIs in Excel.
Is this dashboard suitable for ESG audits?
Yes, it supports transparent and structured ESG reporting.
Does the dashboard support drill-through?
Yes, you can drill through to the KPI Definition page.
Visit our YouTube channel to learn step-by-step video tutorials