Managing an equipment leasing business involves constant tracking of assets, revenue, utilization, costs, and profitability. However, many leasing companies still rely on scattered Excel sheets, manual reports, and delayed summaries. As a result, decision-making becomes slow and reactive.
That is exactly why an Equipment Leasing KPI Dashboard in Excel becomes a powerful and practical solution. It converts raw leasing data into structured KPIs, visual trends, and actionable insights—all in one interactive Excel file.
In this in-depth guide, you will learn what an Equipment Leasing KPI Dashboard in Excel is, how it works, its worksheet-wise structure, advantages, best practices, and frequently asked questions. Moreover, this article explains how a ready-to-use Excel dashboard simplifies performance tracking, improves profitability, and strengthens operational control.
Click to buy Equipment Leasing KPI Dashboard in Excel
What Is an Equipment Leasing KPI Dashboard in Excel?
An Equipment Leasing KPI Dashboard in Excel is a centralized performance-tracking tool designed to monitor key metrics related to leasing operations. Instead of checking multiple reports, managers can view all critical KPIs on one interactive dashboard.
Because Excel supports formulas, drop-downs, conditional formatting, and charts, this dashboard remains flexible and easy to use. Furthermore, decision-makers can compare MTD (Month-to-Date), YTD (Year-to-Date), Target, and Previous Year (PY) performance in seconds.
As a result, leasing companies gain clarity on utilization rates, lease revenue, asset performance, and operational efficiency.
Why Do Equipment Leasing Companies Need a KPI Dashboard?
Equipment leasing businesses operate in a data-intensive environment. Every asset, lease contract, and payment cycle generates valuable information. However, without a structured dashboard, this data remains underutilized.
An Equipment Leasing KPI Dashboard in Excel helps because:
- It centralizes all leasing KPIs in one place
- It highlights performance gaps using visual indicators
- It supports faster, data-driven decisions
- It improves accountability across teams
- It reduces manual reporting effort
Therefore, leasing managers, finance teams, and executives can focus on strategy instead of spreadsheet maintenance.
How Does an Equipment Leasing KPI Dashboard in Excel Work?
The dashboard works by connecting structured input sheets with calculated KPI views and charts. Once users enter actual, target, and previous-year numbers, Excel formulas automatically update all KPIs.
Moreover, interactive drop-downs allow users to select a specific month or KPI. Consequently, all visuals refresh instantly, which makes analysis fast and intuitive.
In short, the dashboard follows this simple flow:
- Enter actual leasing data
- Enter target values
- Enter previous year numbers
- Select month or KPI
- Analyze performance instantly
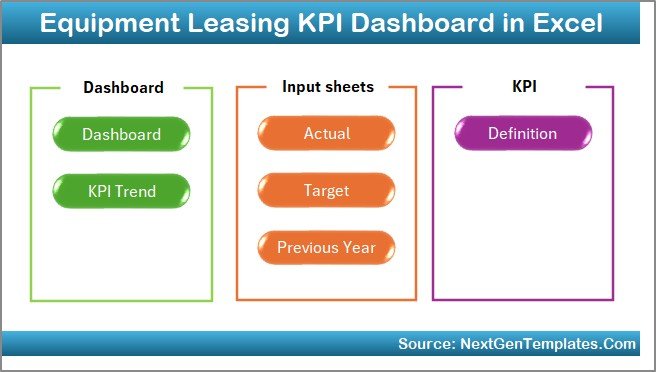
Worksheet-Wise Structure of the Equipment Leasing KPI Dashboard in Excel
This ready-to-use Equipment Leasing KPI Dashboard in Excel contains 7 structured worksheets. Each sheet serves a specific analytical purpose.
Summary Page (Index Sheet)
The Summary Page works as the entry point of the dashboard. It acts like a navigation hub that improves usability and user experience.
Key Highlights of the Summary Page
- Clean index-style layout
- 6 navigation buttons to jump to other sheets
- One-click access to analysis pages
- No manual scrolling required
Because of this structure, even non-technical users can navigate the dashboard easily.
Click to buy Equipment Leasing KPI Dashboard in Excel
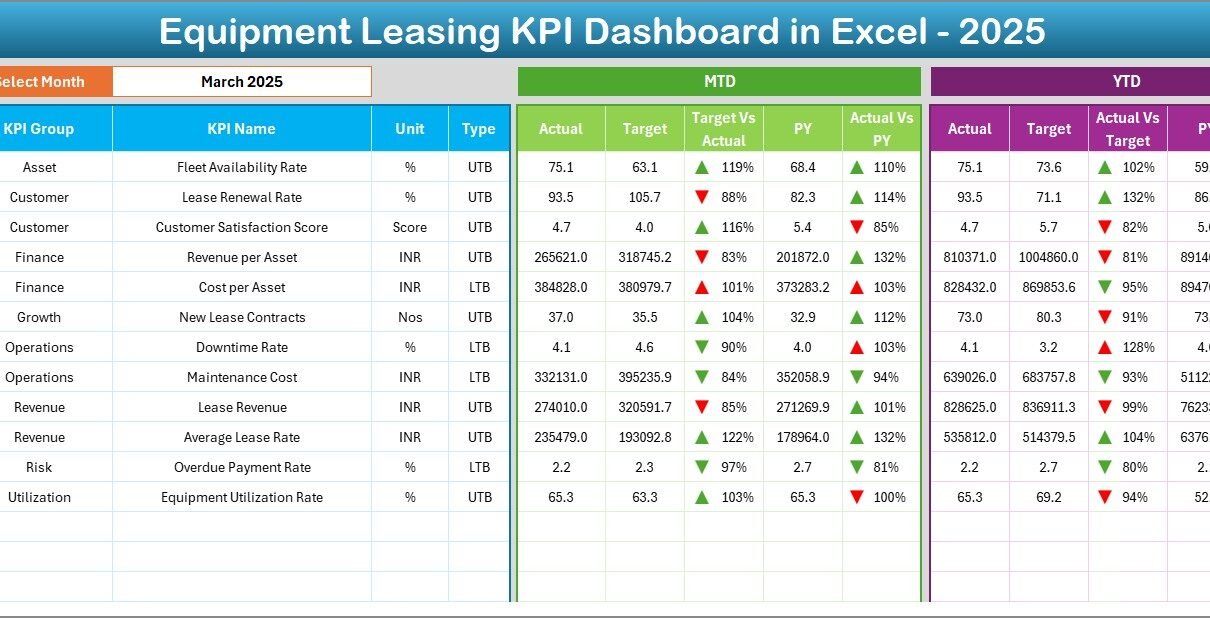
Dashboard Sheet (Main KPI View)
The Dashboard sheet is the heart of the Equipment Leasing KPI Dashboard in Excel. It displays all key performance indicators in a single view.
Key Features of the Dashboard Sheet
- Month selector at cell D3 using a drop-down
- Automatic refresh of all KPIs based on selected month
- Clear separation of MTD and YTD metrics
KPIs Displayed on the Dashboard
For each KPI, the dashboard shows:
- MTD Actual
- MTD Target
- MTD Previous Year
- Target vs Actual variance
- Previous Year vs Actual variance
Similarly, it also displays:
- YTD Actual
- YTD Target
- YTD Previous Year
- YTD Target vs Actual
- YTD PY vs Actual
Visual Enhancements
- Conditional formatting with up and down arrows
- Green indicators for positive performance
- Red indicators for negative performance
As a result, users can instantly identify problem areas without reading numbers line by line.

Click to buy Equipment Leasing KPI Dashboard in Excel
Trend Sheet (KPI-Wise Trend Analysis)
The Trend sheet focuses on deep KPI-level analysis. Instead of viewing everything at once, users can analyze one KPI at a time.
Interactive Controls
- KPI selector drop-down at cell C3
- Automatic update of charts and KPI details
KPI Information Displayed
Once you select a KPI, the sheet displays:
- KPI Group
- Unit of KPI
- Type of KPI (Lower the Better or Upper the Better)
- Formula of the KPI
- Definition of the KPI
Trend Charts Included
- MTD Trend Chart for Actual, Target, and PY
- YTD Trend Chart for Actual, Target, and PY
Because of these trend charts, managers can easily spot seasonality, growth patterns, and performance fluctuations.

Click to buy Equipment Leasing KPI Dashboard in Excel
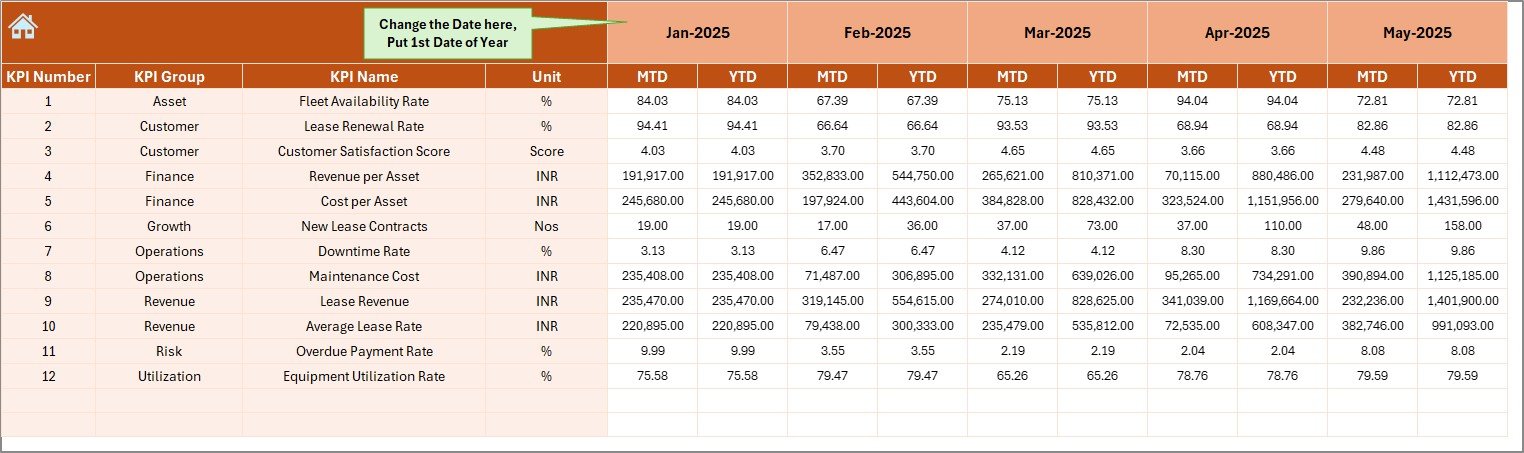
Actual Numbers Input Sheet
The Actual Numbers Input sheet acts as the primary data entry area for current-year performance.
How This Sheet Works
- Users enter MTD and YTD actual values
- Month selection available in cell E1
- Enter the first month of the financial year once
- Excel automatically adjusts calculations
Because the structure remains consistent, users avoid data duplication and errors.
Click to buy Equipment Leasing KPI Dashboard in Excel
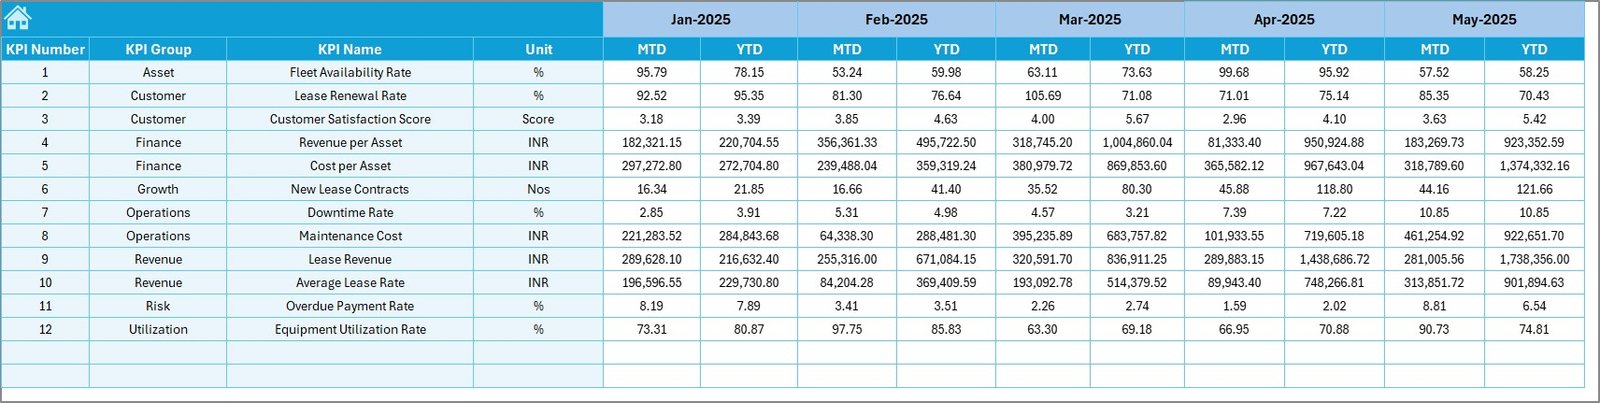
Target Sheet
The Target Sheet stores performance goals for each KPI.
Key Details
- Enter MTD Target values
- Enter YTD Target values
- One row per KPI
- Clean and structured layout
By separating targets from actuals, the dashboard ensures accurate variance analysis.
Click to buy Equipment Leasing KPI Dashboard in Excel
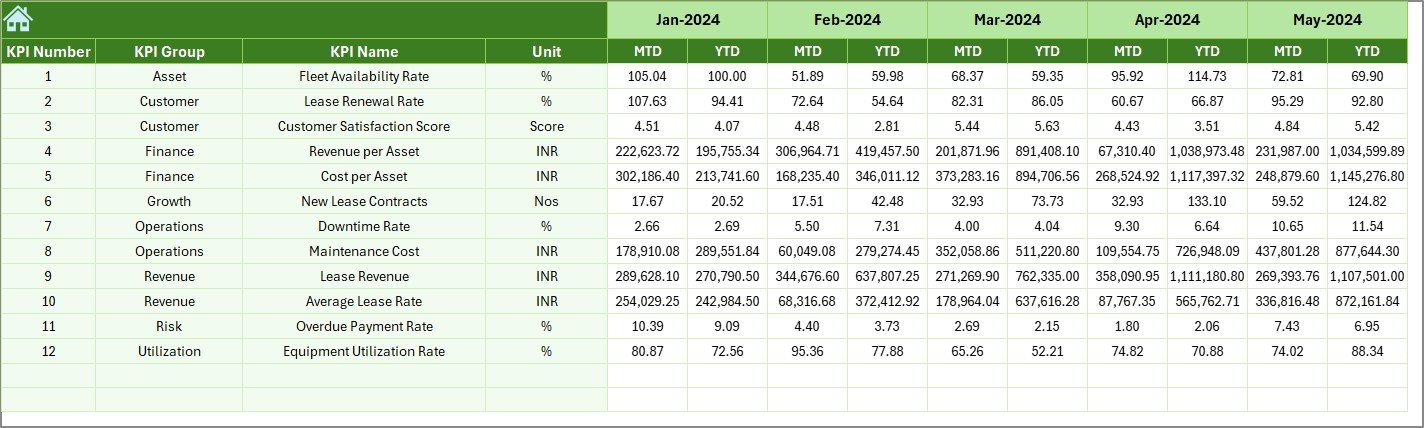
Previous Year Number Sheet
The Previous Year Number sheet stores historical data for comparison.
Why This Sheet Matters
- Enables year-over-year analysis
- Helps identify long-term performance trends
- Supports realistic target setting
Users enter data exactly as they do for the current year, which ensures consistency across reports.
Click to buy Equipment Leasing KPI Dashboard in Excel
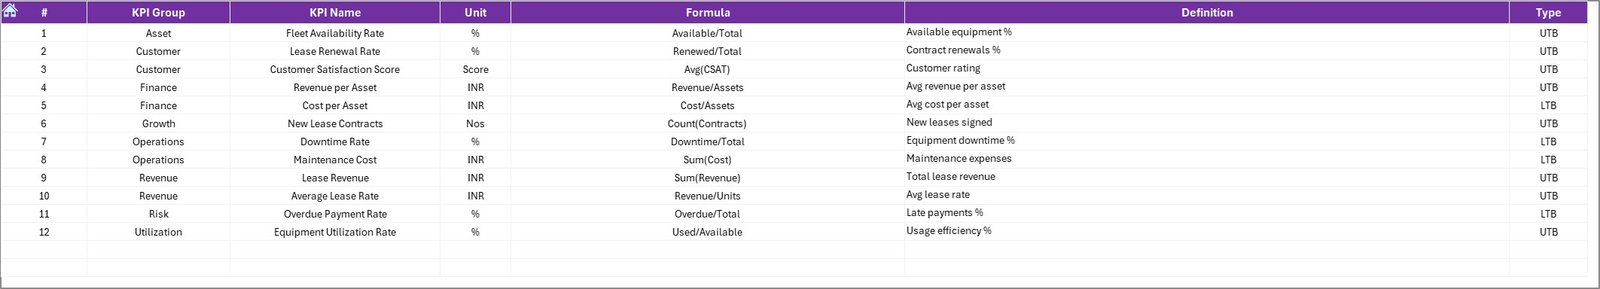
KPI Definition Sheet
The KPI Definition sheet acts as a documentation and governance layer.
Information Maintained Here
- KPI Name
- KPI Group
- Unit
- Formula
- KPI Definition
Because of this sheet, everyone interprets KPIs the same way. As a result, confusion and misreporting reduce significantly.
Click to buy Equipment Leasing KPI Dashboard in Excel
What KPIs Can Be Tracked in an Equipment Leasing Dashboard?
An Equipment Leasing KPI Dashboard in Excel can track multiple operational and financial metrics, such as:
- Equipment Utilization Rate
- Lease Revenue
- Average Lease Duration
- Asset Downtime
- Maintenance Cost per Asset
- Lease Renewal Rate
- Revenue per Asset
- Delinquency Rate
- Operating Margin
You can customize KPIs based on business size, asset type, and industry focus.
Advantages of Equipment Leasing KPI Dashboard in Excel
Using an Equipment Leasing KPI Dashboard in Excel delivers several tangible benefits.
- Centralized Performance Tracking
All KPIs remain available in one place. Therefore, managers no longer chase multiple files.
- Faster Decision-Making
Because the dashboard updates instantly, leaders respond quickly to performance gaps.
- Improved Accuracy
Excel formulas reduce manual calculations. As a result, reporting errors decrease.
- Better Target Control
Clear Target vs Actual views improve accountability across teams.
- Cost-Effective Solution
Unlike expensive BI tools, Excel dashboards require no additional licensing.
- User-Friendly Design
Navigation buttons, drop-downs, and charts make analysis simple for everyone.
Opportunities for Improvement in Equipment Leasing KPI Dashboards
Even a strong dashboard can evolve over time. Therefore, continuous improvement remains essential.
- Add asset-level drill-downs
- Introduce region or branch filters
- Include contract aging analysis
- Add predictive trends using historical data
- Automate data entry through system integration
These enhancements further strengthen decision-making capabilities.
Best Practices for the Equipment Leasing KPI Dashboard in Excel
Following best practices ensures accuracy, scalability, and long-term usability.
- Define KPIs Clearly
Always document KPI definitions in the KPI Definition sheet.
- Keep Data Entry Simple
Limit manual input to only necessary sheets.
- Use Consistent Units
Ensure units remain consistent across Actual, Target, and PY data.
- Review KPIs Monthly
Regular reviews help identify issues before they escalate.
- Avoid Overcrowding the Dashboard
Focus on critical KPIs instead of displaying everything.
- Protect Formulas
Lock formula cells to avoid accidental changes.
Who Should Use an Equipment Leasing KPI Dashboard in Excel?
This dashboard benefits a wide range of professionals:
- Equipment Leasing Managers
- Finance and Accounting Teams
- Operations Managers
- Asset Management Teams
- Business Owners
- Senior Executives
Because the dashboard works entirely in Excel, teams adopt it quickly without training delays.
How Does This Dashboard Support Strategic Decision-Making?
An Equipment Leasing KPI Dashboard in Excel supports strategy by:
- Identifying underperforming assets
- Highlighting profitable leasing segments
- Supporting pricing decisions
- Improving asset utilization
- Enhancing forecasting accuracy
As a result, businesses shift from reactive management to proactive planning.
Conclusion
An Equipment Leasing KPI Dashboard in Excel transforms raw leasing data into clear, actionable insights. Instead of relying on fragmented spreadsheets, leasing companies gain a single source of truth for performance monitoring.
With its 7-worksheet structure, interactive filters, MTD and YTD comparisons, and visual indicators, this dashboard simplifies reporting while improving accuracy. Moreover, it remains flexible, cost-effective, and easy to customize.
If you want better visibility, faster decisions, and stronger control over leasing operations, this dashboard becomes an essential tool.
Frequently Asked Questions (FAQs)
What is an Equipment Leasing KPI Dashboard in Excel?
It is a structured Excel tool that tracks key leasing performance metrics using interactive dashboards, charts, and comparisons.
Can beginners use this dashboard easily?
Yes. Because the dashboard uses simple navigation buttons and drop-downs, beginners can use it without technical knowledge.
Does the dashboard support MTD and YTD analysis?
Yes. It clearly displays both MTD and YTD Actual, Target, and Previous Year values.
Can I customize KPIs in the dashboard?
Absolutely. You can add, remove, or modify KPIs using the KPI Definition and input sheets.
Does this dashboard require Excel macros?
No. It works using standard Excel features like formulas, charts, and data validation.
Is this dashboard suitable for small and large leasing companies?
Yes. Both small businesses and large leasing firms can scale this dashboard based on their needs.
Visit our YouTube channel to learn step-by-step video tutorials
Watch the step-by-step video tutorial:
Click to buy Equipment Leasing KPI Dashboard in Excel