In today’s digital-first world, data privacy sits at the center of trust, regulation, and business continuity. Every organization now collects, processes, and stores sensitive personal data. Because of this reality, Data Privacy Offices face growing pressure to monitor compliance, measure performance, and report results accurately—and they must do it fast.
That is exactly where a Data Privacy Office KPI Dashboard in Excel becomes a game-changer.
In this in-depth guide, you will learn what a Data Privacy Office KPI Dashboard in Excel is, why it matters, how it works, its page-wise structure, key KPIs, advantages, best practices, and frequently asked questions. By the end, you will clearly understand how this dashboard helps privacy teams move from reactive reporting to proactive compliance management.
Click to buy Data Privacy Office KPI Dashboard in Excel
What Is a Data Privacy Office KPI Dashboard in Excel?
A Data Privacy Office KPI Dashboard in Excel is a structured and interactive reporting tool that tracks, analyzes, and visualizes key privacy performance indicators in one centralized place.
Instead of managing scattered spreadsheets, email updates, and manual reports, this dashboard consolidates actual values, targets, previous-year comparisons, and trends into a single, easy-to-use Excel-based solution.
Because the dashboard runs in Microsoft Excel, teams can update data easily, apply formulas natively, and share insights without additional software costs.
Why Does a Data Privacy Office Need a KPI Dashboard?
Data privacy teams handle complex responsibilities every day. However, manual tracking slows them down and increases risk. Therefore, a KPI dashboard becomes essential.
Key Challenges Without a KPI Dashboard
- Fragmented data across multiple sheets
- Delayed compliance reporting
- Manual errors in KPI calculations
- Poor visibility into monthly and yearly trends
- Difficulty explaining performance to leadership
How a KPI Dashboard Solves These Problems
- Centralizes all privacy KPIs in one file
- Automates comparisons like Target vs Actual
- Highlights risks using conditional formatting
- Shows MTD and YTD performance instantly
- Improves transparency and accountability
As a result, the Data Privacy Office gains control, clarity, and confidence.
How Does a Data Privacy Office KPI Dashboard in Excel Work?
The dashboard works through a well-defined worksheet structure. Each sheet has a specific role, and together they create a seamless reporting experience.
Let us explore each worksheet in detail.
What Is the Summary Page and Why Is It Important?
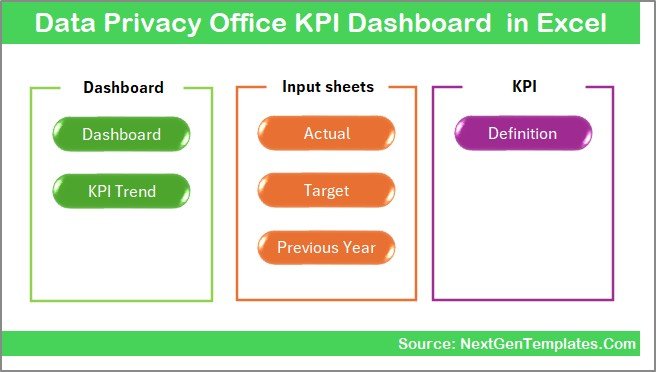
Summary Page (Index Sheet)
The Summary Page acts as the navigation hub of the dashboard.
Key Features
- Serves as the index sheet
- Contains 6 clickable buttons
- Allows quick navigation to all major sheets
- Improves usability for non-technical users
Because of this layout, users do not waste time searching for sheets. Instead, they jump directly to the required analysis.
Click to buy Data Privacy Office KPI Dashboard in Excel
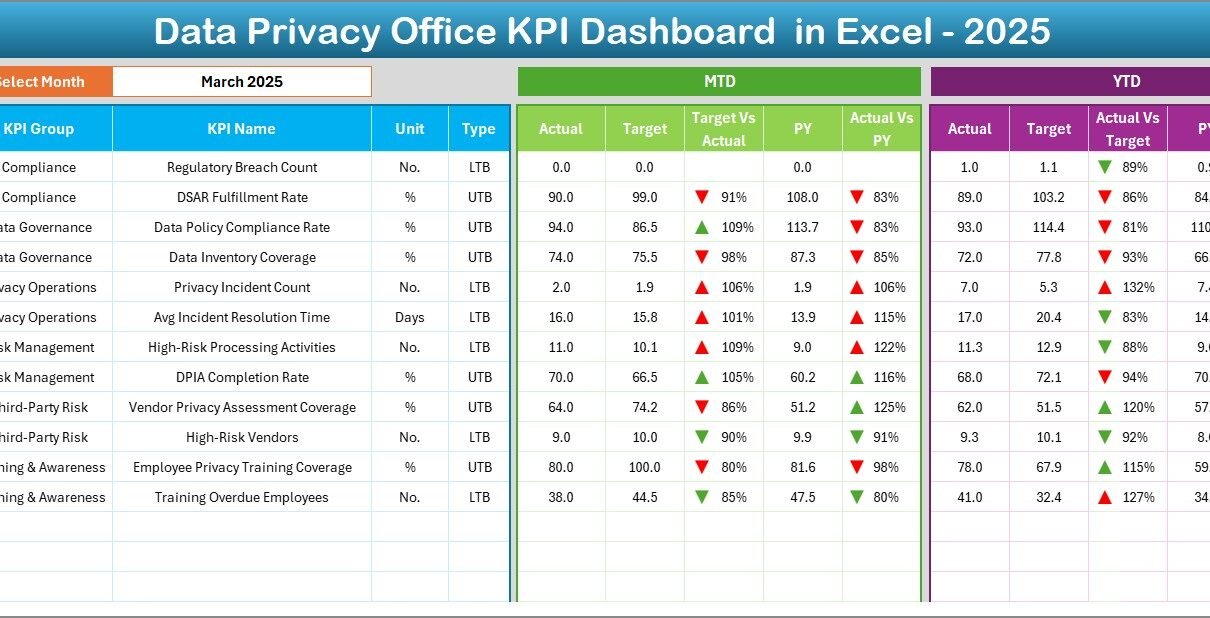
What Does the Dashboard Sheet Show?
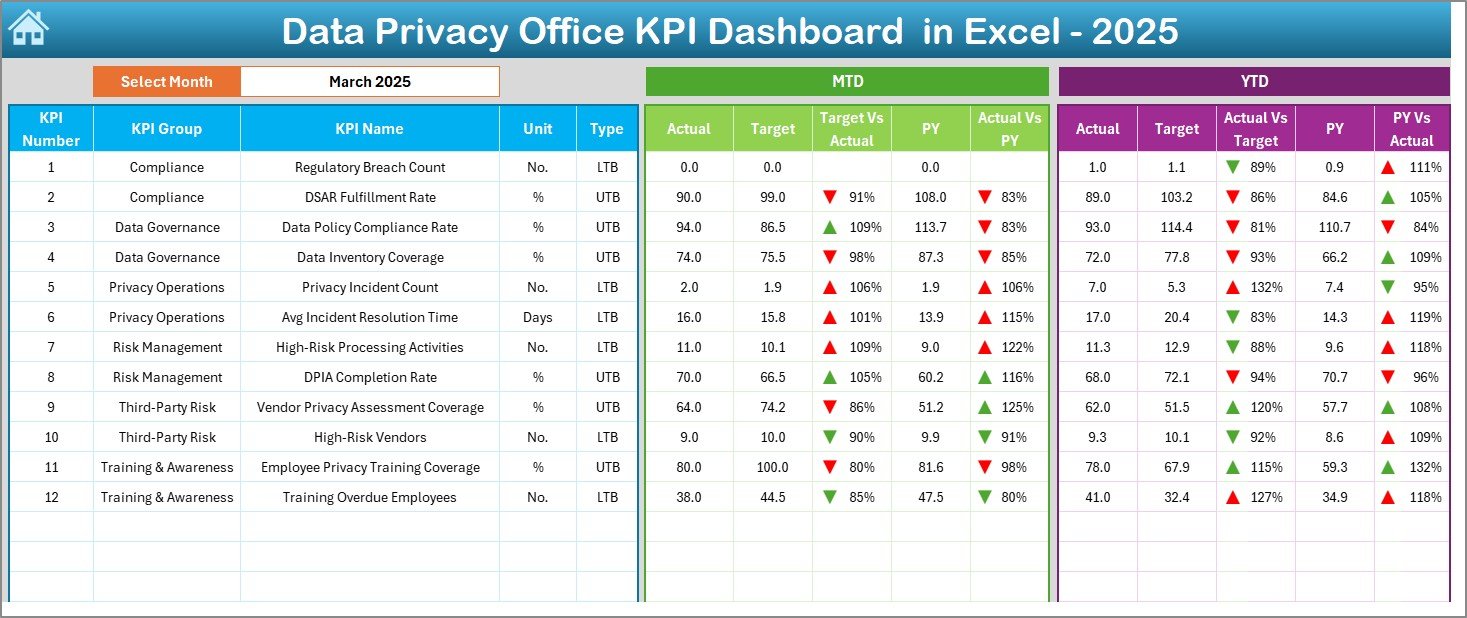
Dashboard Sheet (Main Dashboard)
The Dashboard Sheet serves as the heart of the entire system. It displays the overall performance of all privacy KPIs.
Key Highlights
- Month selector (Cell D3) using a drop-down
- Entire dashboard updates automatically based on the selected month
- Displays MTD, YTD, Target, and Previous Year values
Metrics Displayed
- MTD Actual vs Target
- MTD Actual vs Previous Year
- YTD Actual vs Target
- YTD Actual vs Previous Year
Visual Enhancements
- Up and Down arrows using conditional formatting
- Instant identification of positive and negative performance
- Clean, professional dashboard layout
As a result, leadership can review privacy performance at a glance.
Click to buy Data Privacy Office KPI Dashboard in Excel
How Does the Trend Sheet Help Analyze KPI Performance?
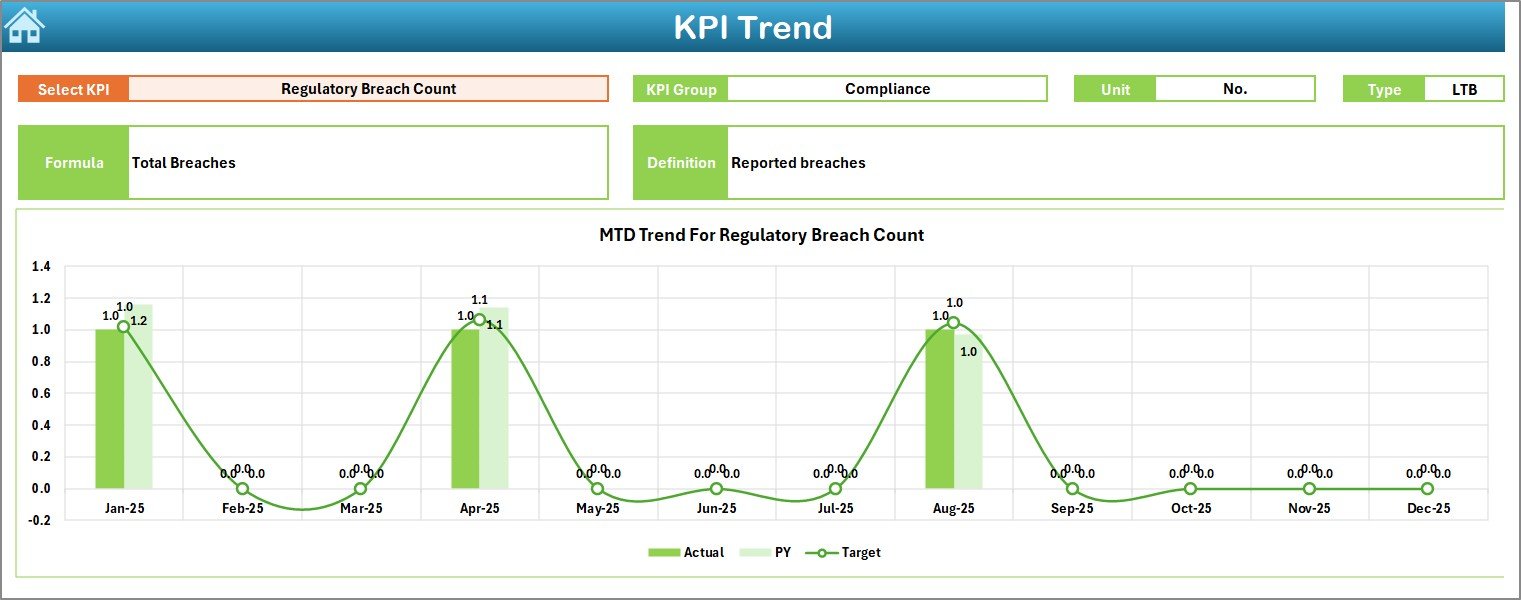
Trend Sheet
The Trend Sheet focuses on deep KPI-level analysis.
Interactive Features
- KPI name selection from a drop-down (Cell C3)
- Automatically displays KPI metadata
KPI Information Displayed
- KPI Group
- KPI Unit
- KPI Type (Lower the Better / Upper the Better)
- KPI Formula
- KPI Definition
Charts Included
- MTD Trend Chart (Actual, Target, PY)
- YTD Trend Chart (Actual, Target, PY)
Because of these visuals, users can quickly identify trends, patterns, and risks over time.
Click to buy Data Privacy Office KPI Dashboard in Excel
Where Do You Enter Actual KPI Numbers?
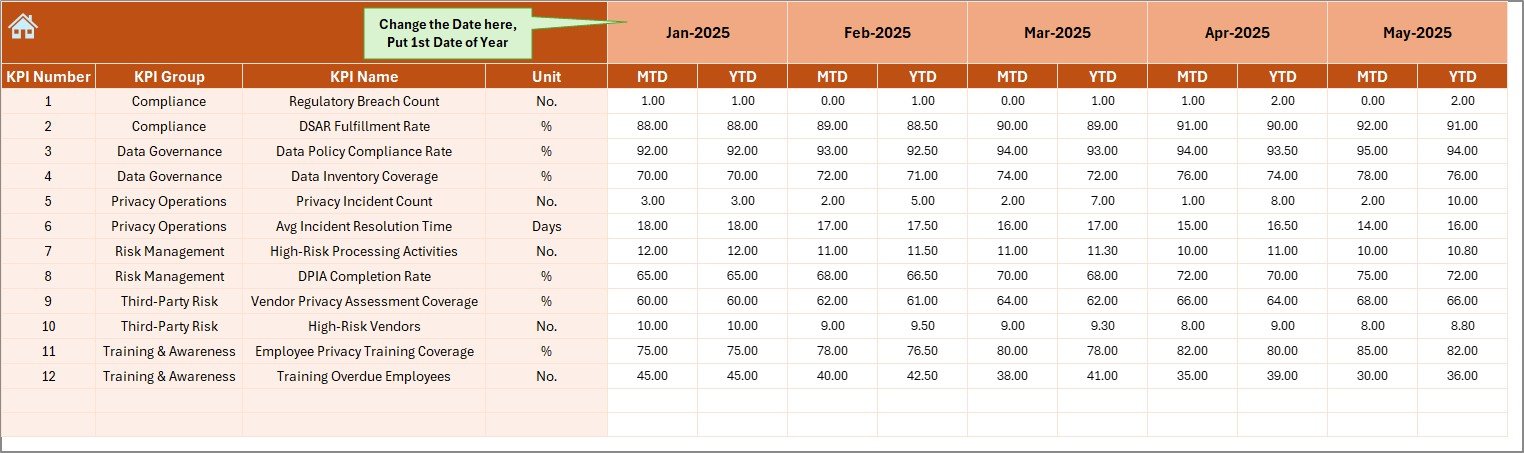
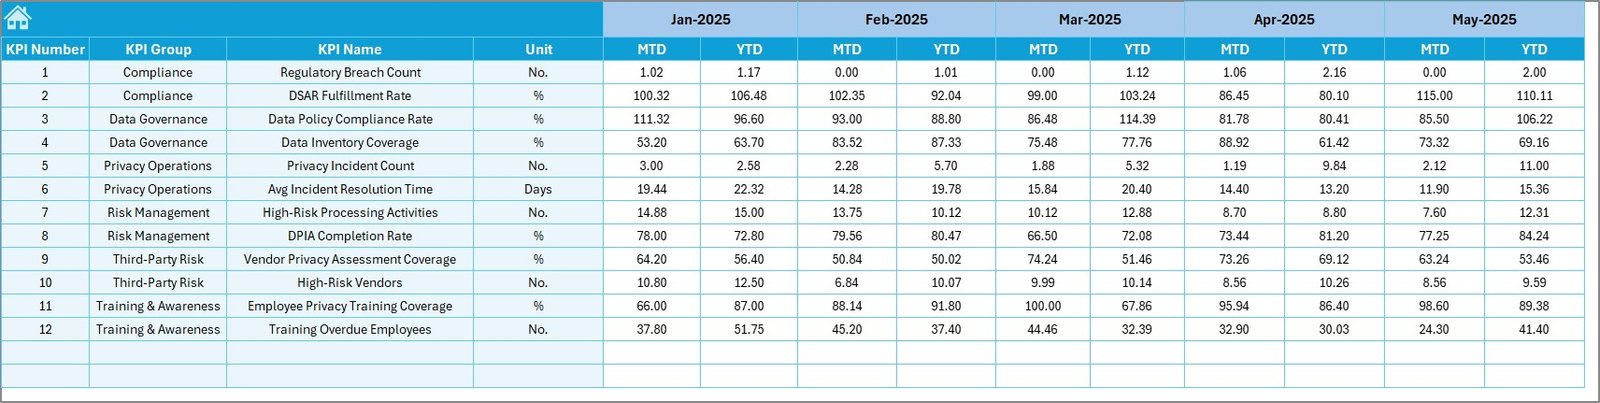
Actual Numbers Input Sheet
This sheet captures actual KPI performance data.
How It Works
- Enter MTD and YTD actual values
- Select the starting month of the year in Cell E1
- Change the month dynamically as required
This structure ensures clean data input while supporting automated calculations across the dashboard.
Click to buy Data Privacy Office KPI Dashboard in Excel
How Are KPI Targets Managed?
Target Sheet
The Target Sheet stores planned KPI benchmarks.
Key Points
- Enter MTD and YTD target values
- Targets align with monthly reporting
- Used for Target vs Actual comparisons automatically
Because targets remain separate, teams can adjust goals without disturbing historical data.
Click to buy Data Privacy Office KPI Dashboard in Excel
How Do You Track Previous Year Performance?
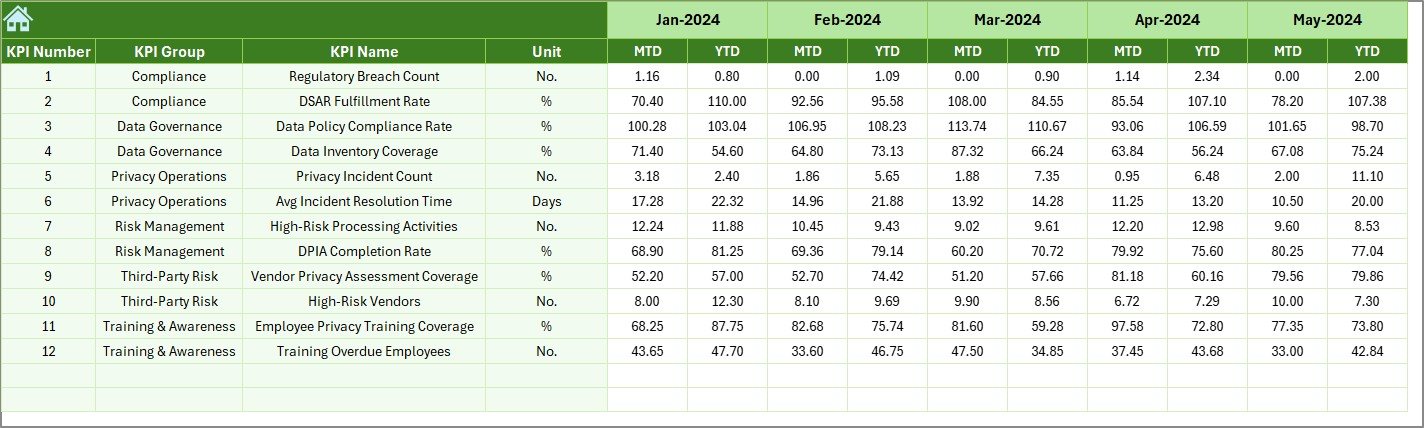
Previous Year Numbers Sheet
This sheet stores last year’s KPI data.
Benefits
- Enables year-over-year analysis
- Supports PY vs Actual comparisons
- Improves benchmarking accuracy
As a result, privacy teams can measure improvement objectively.
Click to buy Data Privacy Office KPI Dashboard in Excel
Why Is the KPI Definition Sheet Critical?
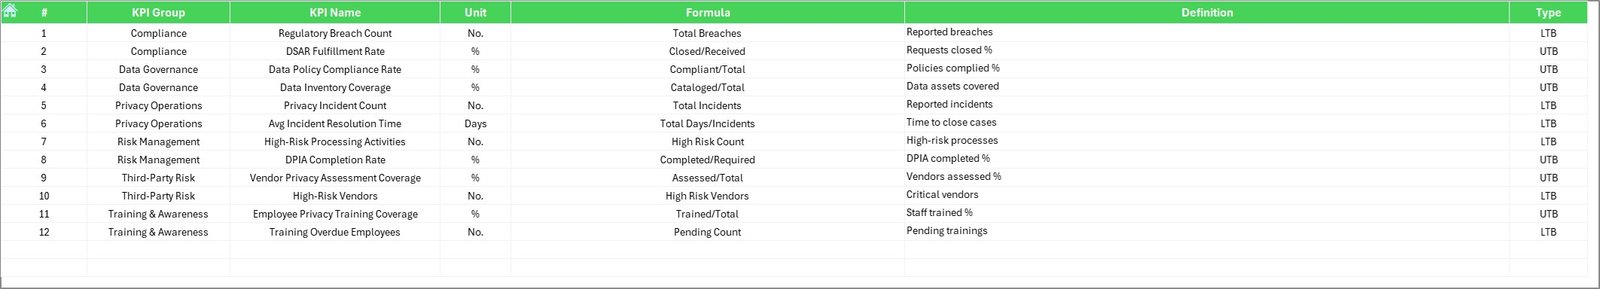
KPI Definition Sheet
The KPI Definition Sheet acts as the data governance layer of the dashboard.
Information Included
- KPI Name
- KPI Group
- KPI Unit
- KPI Formula
- KPI Definition
Because definitions stay centralized, everyone interprets KPIs consistently.
Click to buy Data Privacy Office KPI Dashboard in Excel
Which KPIs Can a Data Privacy Office Track?
A Data Privacy Office KPI Dashboard in Excel can track a wide range of compliance and operational KPIs.
Common Data Privacy KPIs
- Data Subject Access Requests (DSARs) completed
- Average response time for privacy requests
- Number of privacy incidents
- Policy compliance rate
- Training completion percentage
- Audit findings closed on time
- Third-party risk assessments completed
By tracking these KPIs, teams gain measurable insights into privacy maturity.
Advantages of Data Privacy Office KPI Dashboard in Excel
A Data Privacy Office KPI Dashboard in Excel delivers multiple business and compliance benefits.
- Centralized Privacy Monitoring
- All KPIs in one dashboard
- No dependency on multiple files
- Faster Decision-Making
- Real-time KPI updates
- Clear performance indicators
- Improved Compliance Visibility
- Easy tracking of regulatory obligations
- Reduced audit stress
- Cost-Effective Solution
- No expensive BI tools required
- Uses existing Excel infrastructure
- Easy Customization
- Add or remove KPIs easily
- Modify formulas without coding
- Strong Management Reporting
- Executive-ready visuals
- Clear MTD and YTD comparisons
Best Practices for the Data Privacy Office KPI Dashboard in Excel
Following best practices ensures long-term success and accuracy.
- Define KPIs Clearly
Always document KPI definitions, formulas, and units before tracking data.
- Keep Data Entry Structured
Use dedicated input sheets for actuals, targets, and previous-year data.
- Update Data Monthly
Maintain a regular update schedule to ensure timely insights.
- Use Conditional Formatting Wisely
Highlight risks clearly but avoid excessive colors.
- Review Trends, Not Just Numbers
Use trend charts to identify recurring compliance gaps.
- Align KPIs With Regulations
Ensure KPIs map directly to GDPR, HIPAA, or other applicable regulations.
- Train Users
Educate stakeholders on how to interpret dashboard metrics correctly.
How Does This Dashboard Support Compliance Audits?
A well-structured dashboard simplifies audits significantly.
Audit Benefits
- Clear historical records
- Consistent KPI definitions
- Evidence-based reporting
- Faster auditor responses
As a result, audits become smoother and less disruptive.
Who Should Use a Data Privacy Office KPI Dashboard?
This dashboard suits a wide range of roles.
Ideal Users
- Data Protection Officers (DPOs)
- Privacy Compliance Managers
- Risk and Compliance Teams
- Internal Audit Teams
- Senior Management
Because of its Excel-based design, both technical and non-technical users can operate it easily.
How Does This Dashboard Improve Accountability?
Accountability improves when performance becomes visible.
Accountability Drivers
- Transparent targets
- Monthly and yearly tracking
- Clear ownership of KPIs
- Performance-based reviews
As a result, teams take ownership of privacy outcomes.
How Does Excel Make This Dashboard Powerful?
Excel offers flexibility, familiarity, and scalability.
Excel Strengths
- Native formulas
- Drop-down lists
- Conditional formatting
- Charts and trends
- Easy sharing
Therefore, Excel remains a practical choice for privacy KPI reporting.
Conclusion: Why Every Data Privacy Office Needs This Dashboard
A Data Privacy Office KPI Dashboard in Excel transforms how privacy teams operate. Instead of reacting to issues, teams gain predictive insights, structured reporting, and clear accountability.
By centralizing KPIs, automating comparisons, and visualizing trends, this dashboard empowers organizations to stay compliant, reduce risk, and build trust.
In a regulatory landscape that changes constantly, having the right dashboard makes all the difference.
Frequently Asked Questions (FAQs)
- What is a Data Privacy Office KPI Dashboard in Excel?
It is an Excel-based tool that tracks, analyzes, and visualizes data privacy KPIs using MTD, YTD, target, and previous-year comparisons.
- Can this dashboard support GDPR compliance?
Yes. The dashboard supports GDPR-aligned KPIs such as DSAR response time, incident tracking, and compliance rates.
- Do users need advanced Excel skills?
No. Basic Excel knowledge is enough to use and update the dashboard.
- Can organizations customize the KPIs?
Yes. Teams can easily add, modify, or remove KPIs based on internal policies.
- How often should data be updated?
Monthly updates work best for accurate MTD and YTD analysis.
- Does the dashboard support trend analysis?
Yes. The Trend Sheet shows MTD and YTD performance over time.
- Is this dashboard suitable for audits?
Absolutely. It provides structured, historical, and well-documented KPI data for audits.
Visit our YouTube channel to learn step-by-step video tutorials
Watch the step-by-step video tutorial:
Click to buy Data Privacy Office KPI Dashboard in Excel