Cyber risks continue to grow in volume, complexity, and impact. Organizations now face constant threats such as data breaches, ransomware, system vulnerabilities, and compliance failures. Therefore, cyber risk management teams must monitor performance continuously instead of relying on static reports or scattered spreadsheets.
That is exactly where a Cyber Risk Management KPI Dashboard in Excel delivers real value.
In this detailed guide, you will learn what a Cyber Risk Management KPI Dashboard in Excel is, why it matters, how it works, and how each worksheet supports cyber risk tracking. Moreover, you will explore its advantages, best practices, and frequently asked questions to help you use this ready-to-use dashboard effectively.
Because Excel remains widely available and flexible, this dashboard becomes an ideal solution for organizations that want strong cyber risk visibility without expensive tools.
Click to Purchases Cyber Risk Management KPI Dashboard in Excel
What Is a Cyber Risk Management KPI Dashboard in Excel?
A Cyber Risk Management KPI Dashboard in Excel is a structured and interactive reporting tool designed to track, analyze, and monitor key cyber risk and cybersecurity performance indicators in one centralized workbook.
Instead of reviewing multiple files or manual reports, this dashboard consolidates:
-
Actual performance values
-
Target benchmarks
-
Previous year comparisons
-
Month-to-date (MTD) results
-
Year-to-date (YTD) results
As a result, cyber risk leaders gain instant visibility into risk posture and control effectiveness.
Why Do Organizations Need a Cyber Risk Management KPI Dashboard?
Cyber risks change rapidly. Therefore, organizations must track performance frequently and accurately.
A Cyber Risk Management KPI Dashboard in Excel helps because it:
-
Improves cyber risk visibility
-
Tracks risk trends over time
-
Highlights gaps between actual and target values
-
Supports proactive risk mitigation
-
Strengthens governance and accountability
Consequently, leadership teams move from reactive firefighting to proactive cyber risk management.
How Does a Cyber Risk Management KPI Dashboard in Excel Work?
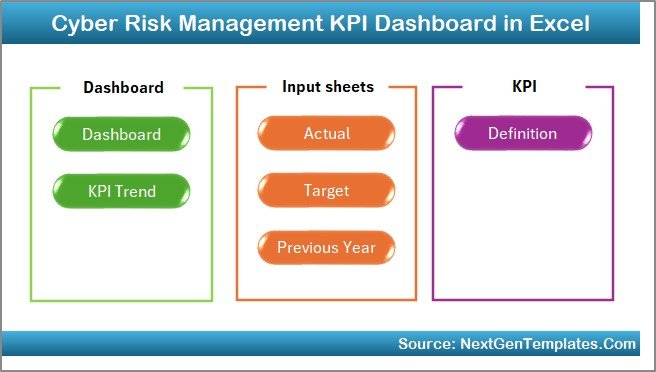
This ready-to-use dashboard works through seven well-structured worksheets, each designed for a specific purpose. Together, they create a complete cyber risk monitoring system.
Let us explore each worksheet in detail.
Click to Purchases Cyber Risk Management KPI Dashboard in Excel
What Is the Home Sheet in the Cyber Risk Management KPI Dashboard?
The Home Sheet works as the navigation center of the dashboard.
Why Is the Home Sheet Important?
The Home Sheet allows users to move between sections quickly without confusion.
What Buttons Are Available on the Home Sheet?
The Home Sheet includes six navigation buttons that help users jump directly to:
-
Dashboard
-
KPI Trend
-
Actual Numbers Input
-
Target Sheet
-
Previous Year Numbers
-
KPI Definition
Because of this index-style layout, even first-time users can navigate the dashboard confidently.
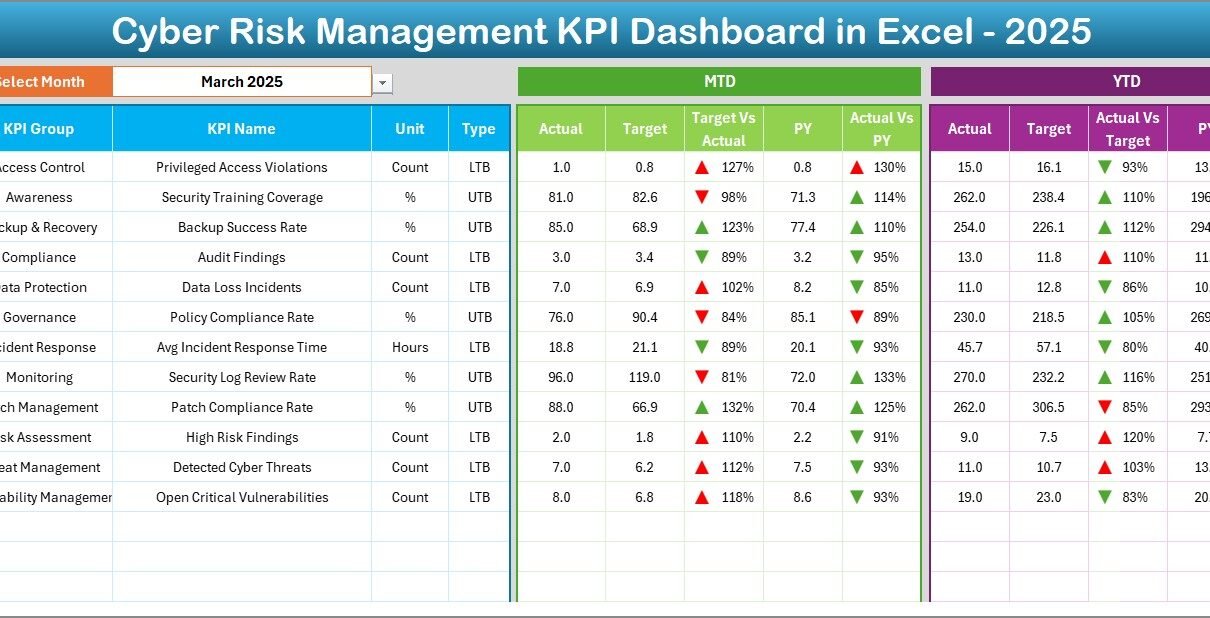
What Is the Dashboard Sheet and Why Is It the Core of the KPI Dashboard?

The Dashboard Sheet serves as the main reporting interface.
How Do You Select the Reporting Month?
On range D3, you can select the month from a drop-down. Once you select a month, the entire dashboard updates automatically.
What KPI Information Does the Dashboard Display?
The Dashboard Sheet shows comprehensive KPI information, including:
-
KPI Name
-
KPI Group
-
Unit of measurement
-
MTD Actual, Target, and Previous Year
-
YTD Actual, Target, and Previous Year
Because all KPIs appear on one screen, decision-makers gain instant clarity.
How Does Conditional Formatting Improve Cyber Risk Monitoring?
The dashboard uses conditional formatting with up-and-down arrows to show:
-
Target vs Actual performance
-
Previous Year vs Actual performance
These visual indicators help users identify risk areas immediately instead of analyzing long tables.
hy Is MTD and YTD Analysis Critical for Cyber Risk?
MTD analysis helps teams track short-term risk movement, while YTD analysis supports long-term risk trends.
Together, they ensure balanced cyber risk oversight.
Click to Purchases Cyber Risk Management KPI Dashboard in Excel
What Is the KPI Trend Sheet and How Does It Support Analysis?
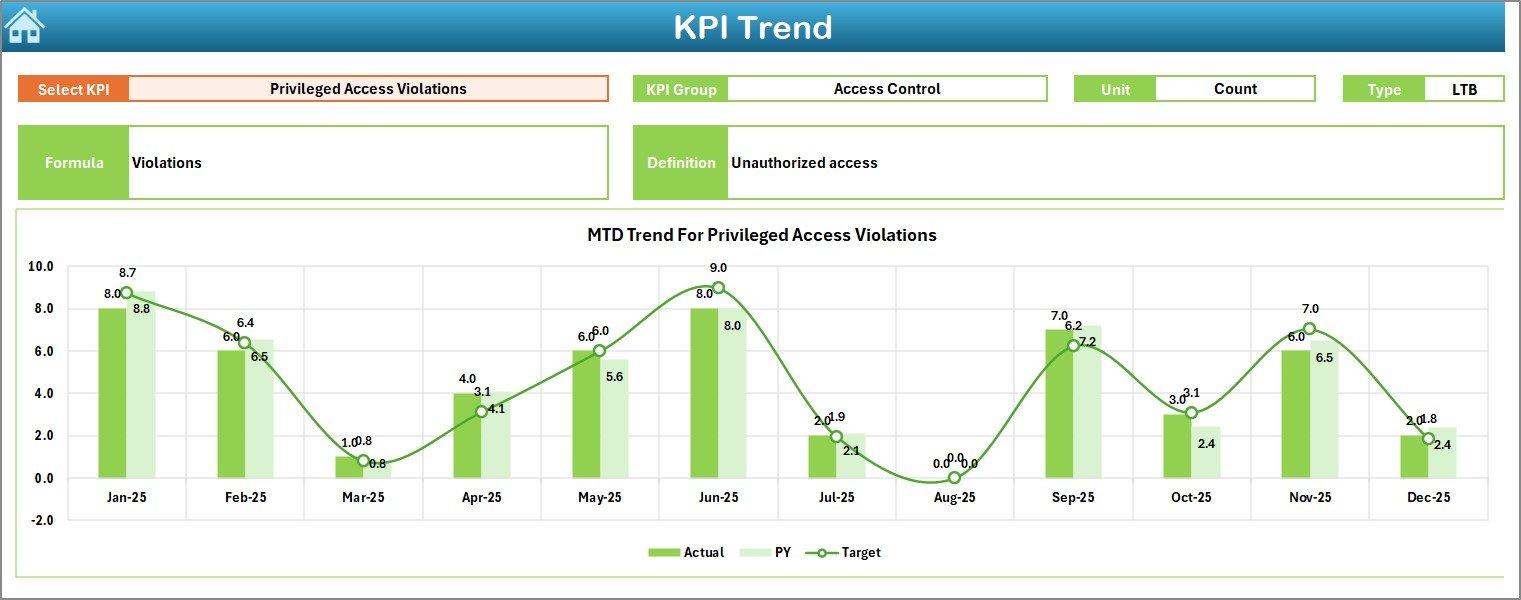
The KPI Trend Sheet focuses on deep analysis of individual cyber risk KPIs.
How Do You Select a KPI in the Trend Sheet?
You can select a KPI name from the drop-down available in range C3. Once selected, the sheet updates automatically.
What KPI Details Are Displayed in the Trend Sheet?
The KPI Trend Sheet displays:
-
KPI Group
-
Unit of KPI
-
KPI Type (Lower the Better or Upper the Better)
-
KPI Formula
-
KPI Definition
This structure ensures that users understand both what the KPI measures and how it works.
How Do Trend Charts Improve Cyber Risk Insights?
The sheet displays MTD and YTD trend charts for:
-
Actual values
-
Target values
-
Previous Year values
These charts help teams:
-
Identify increasing or decreasing risk trends
-
Compare current performance with historical data
-
Support risk forecasting and planning
What Is the Actual Numbers Input Sheet?
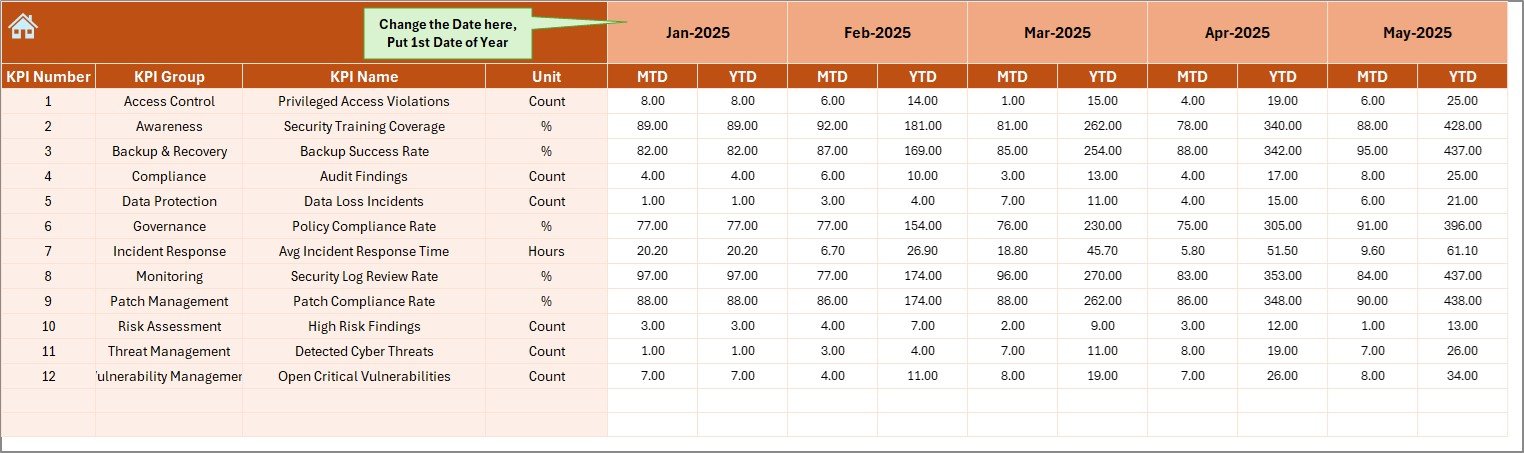
The Actual Numbers Input Sheet acts as the foundation for all calculations.
What Data Do You Enter in This Sheet?
You enter:
-
MTD actual values
-
YTD actual values
-
KPI-wise performance data
You can change the reporting month from range E1 by entering the first month of the year.
Why Is This Sheet Critical?
Because all dashboard calculations depend on this sheet, accurate data entry ensures reliable insights across the entire dashboard.
Click to Purchases Cyber Risk Management KPI Dashboard in Excel
What Is the Target Sheet and How Is It Used?
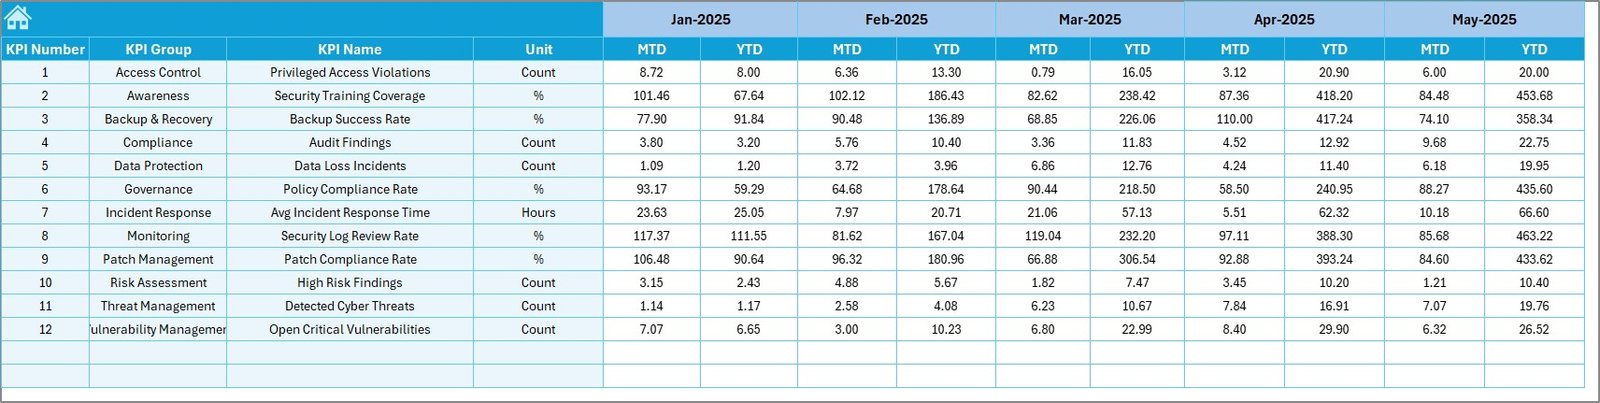
The Target Sheet stores benchmark values for each KPI.
What Do You Enter in the Target Sheet?
You enter:
-
Monthly MTD targets
-
Monthly YTD targets
These targets help compare actual performance against planned cyber risk objectives.
Why Are Targets Important in Cyber Risk Management?
Targets help organizations:
-
Measure control effectiveness
-
Track progress against risk appetite
-
Identify deviations early
What Is the Previous Year Numbers Sheet?
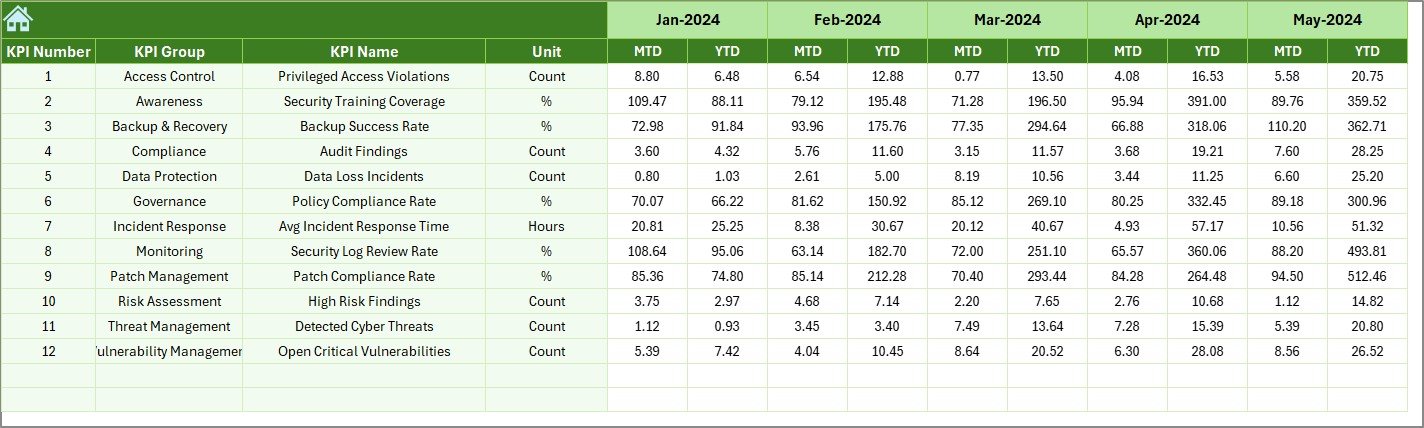
The Previous Year Numbers Sheet stores historical KPI values.
How Does Previous Year Comparison Help?
Previous year comparisons allow teams to:
-
Measure improvement or decline
-
Identify recurring cyber risk issues
-
Evaluate effectiveness of risk initiatives
As a result, cyber risk strategies become data-driven.
What Is the KPI Definition Sheet and Why Is It Essential?
The KPI Definition Sheet acts as a reference and governance layer.
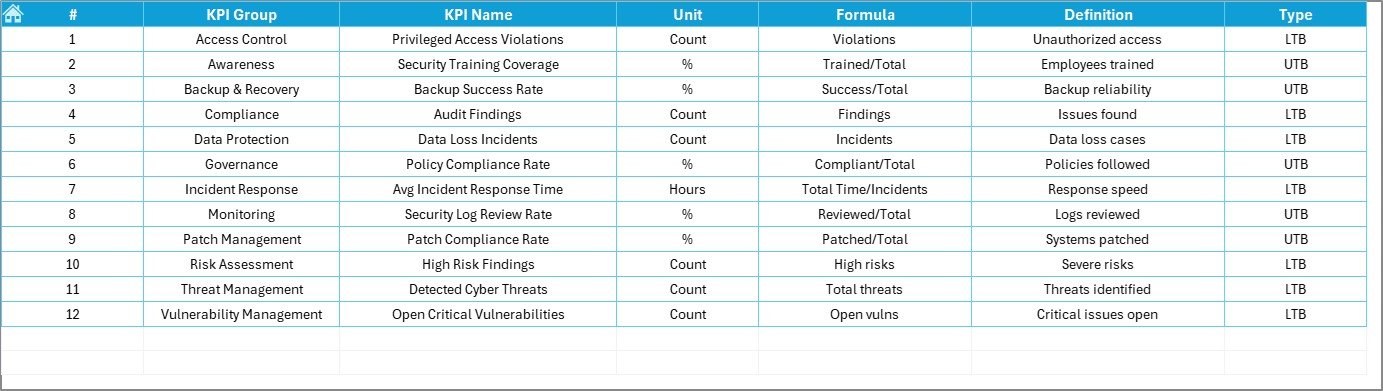
What Information Does the KPI Definition Sheet Contain?
This sheet captures:
-
KPI Name
-
KPI Group
-
Unit of measurement
-
KPI Formula
-
KPI Definition
How Does This Sheet Improve Governance?
The KPI Definition Sheet ensures:
-
Consistent KPI interpretation
-
Standardized reporting
-
Easier onboarding of new team members
How Does a Cyber Risk Management KPI Dashboard Improve Decision-Making?
This dashboard improves decision-making because it:
-
Centralizes cyber risk data
-
Highlights performance gaps visually
-
Tracks trends over time
-
Supports faster corrective actions
-
Improves communication with leadership
As a result, organizations strengthen their cyber resilience.
Click to Purchases Cyber Risk Management KPI Dashboard in Excel
Advantages of Cyber Risk Management KPI Dashboard in Excel
Using a Cyber Risk Management KPI Dashboard in Excel offers several practical benefits.
Key Advantages
-
Centralized cyber risk reporting
-
Clear MTD and YTD analysis
-
Visual performance indicators
-
Easy trend analysis
-
No additional software cost
-
Fully customizable in Excel
-
Suitable for small and large organizations
Because of these advantages, cyber risk teams gain better control and confidence.
Why Excel Works Well for Cyber Risk KPI Dashboards
Excel remains popular because it:
-
Is widely available
-
Requires minimal training
-
Supports formulas, charts, and automation
-
Allows flexible customization
-
Integrates easily with existing data sources
Therefore, Excel becomes a practical and powerful choice for cyber risk tracking.
Click to Purchases Cyber Risk Management KPI Dashboard in Excel
Best Practices for Using a Cyber Risk Management KPI Dashboard in Excel
To get maximum value, teams should follow best practices consistently.
Best Practices
-
Update actual data regularly
-
Validate inputs before review
-
Review MTD performance monthly
-
Analyze YTD trends quarterly
-
Maintain clear KPI definitions
-
Use realistic targets
-
Archive historical data safely
By following these practices, teams ensure accurate reporting and reliable insights.
Who Should Use a Cyber Risk Management KPI Dashboard in Excel?
This dashboard suits many roles and teams.
Ideal Users
-
Cyber risk management teams
-
Information security teams
-
IT governance professionals
-
Risk and compliance managers
-
Internal audit teams
-
Senior leadership
Because of its structured design, both technical and non-technical users can adopt it easily.
Click to Purchases Cyber Risk Management KPI Dashboard in Excel
Conclusion: Why Use a Cyber Risk Management KPI Dashboard in Excel?
A Cyber Risk Management KPI Dashboard in Excel transforms complex cyber risk data into clear, actionable insights. Instead of relying on fragmented reports, organizations gain a centralized and interactive performance monitoring system.
Because the dashboard includes MTD, YTD, target comparison, trend analysis, and KPI definitions, it supports both daily monitoring and long-term risk strategy. Moreover, its Excel-based design ensures flexibility, scalability, and ease of use.
Ultimately, this dashboard helps organizations strengthen cyber resilience and make informed risk decisions.
Frequently Asked Questions About Cyber Risk Management KPI Dashboard in Excel
What is a Cyber Risk Management KPI Dashboard in Excel?
It is an Excel-based dashboard that tracks and analyzes cyber risk KPIs using MTD, YTD, target, and trend analysis.
Can non-technical users use this dashboard?
Yes. The structured layout, drop-downs, and visuals make it easy to use.
Does the dashboard support MTD and YTD tracking?
Yes. The dashboard provides both MTD and YTD performance views.
Can I customize KPIs and targets?
Yes. You can modify KPIs, targets, formulas, and definitions easily.
Is this dashboard suitable for large organizations?
Yes. It works for both small teams and enterprise-level cyber risk programs.
Does the dashboard include trend analysis?
Yes. The KPI Trend Sheet displays MTD and YTD trends for Actual, Target, and Previous Year values.
Click to Purchases Cyber Risk Management KPI Dashboard in Excel
Visit our YouTube channel to learn step-by-step video tutorials