Knowledge is one of the most valuable assets in any organization. Processes, expertise, documentation, lessons learned, and institutional memory drive long-term success. However, when employees leave, roles change, or systems evolve, organizations often lose critical knowledge silently.
That is exactly why knowledge preservation needs structured measurement and continuous monitoring.
A Knowledge Preservation KPI Dashboard in Excel helps organizations track how well they capture, transfer, retain, and sustain knowledge over time. Instead of relying on assumptions, leaders gain data-driven insights into knowledge continuity, gaps, and risks.
In this detailed guide, you will learn what a Knowledge Preservation KPI Dashboard in Excel is, why it is essential, how it works, its key features, advantages, best practices, and how to use it effectively. In addition, you will find frequently asked questions at the end for complete clarity.
Click to Purchases Knowledge Preservation KPI Dashboard in Excel
What Is a Knowledge Preservation KPI Dashboard in Excel?
A Knowledge Preservation KPI Dashboard in Excel is a structured performance management tool designed to track key metrics related to knowledge retention, documentation, transfer, and continuity.
It allows organizations to monitor KPIs such as documentation coverage, knowledge transfer completion, training effectiveness, process standardization, and dependency risks. As a result, teams can proactively protect critical knowledge before it is lost.
Because Excel supports formulas, dropdowns, charts, and conditional formatting, this dashboard delivers powerful insights without complex or expensive software.
Why Is Knowledge Preservation Critical for Organizations?
Knowledge loss creates operational risks, productivity delays, compliance issues, and increased training costs. When organizations fail to preserve knowledge, they often depend heavily on individuals instead of systems.
Organizations need knowledge preservation because it:
-
Reduces dependency on key individuals
-
Ensures business continuity
-
Improves onboarding and training
-
Protects intellectual capital
-
Supports process standardization
-
Strengthens long-term resilience
Without measurable KPIs, knowledge preservation remains reactive rather than proactive.
How Does a Knowledge Preservation KPI Dashboard in Excel Work?
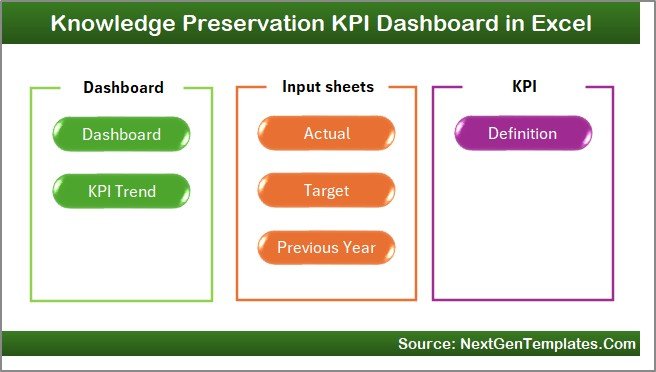
The dashboard works through a structured, multi-sheet design that separates navigation, performance review, trend analysis, and data input. This approach keeps the dashboard intuitive and scalable.
This template includes 7 worksheets, each serving a specific purpose.
Click to Purchases Knowledge Preservation KPI Dashboard in Excel
What Worksheets Are Included in the Knowledge Preservation KPI Dashboard?
1. Home Sheet – Navigation Hub
The Home sheet acts as an index page.
Key Features of the Home Sheet
-
Clean layout for easy navigation
-
Six buttons to jump directly to other sheets
-
Improves user experience and usability
Because of this structure, users move through the dashboard effortlessly.
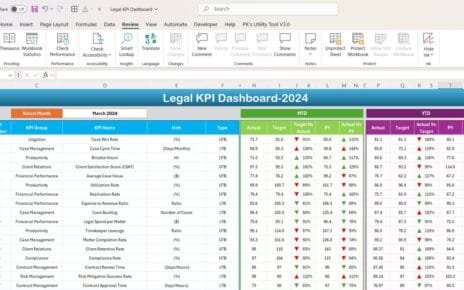
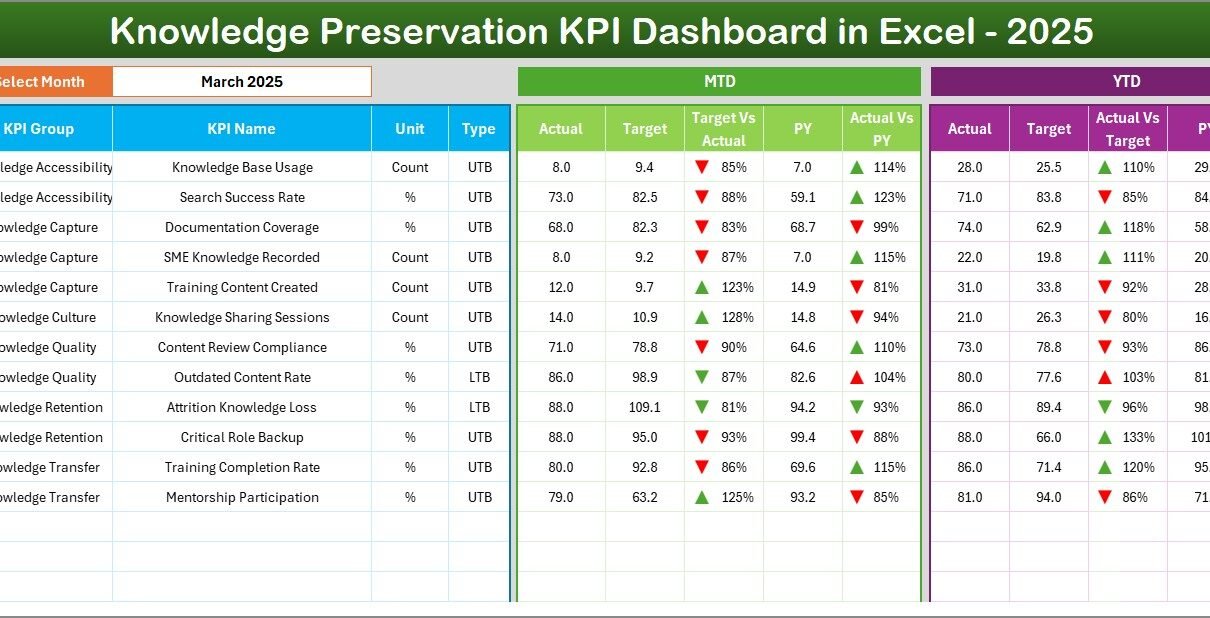
2. Dashboard Sheet Tab – Main KPI Overview
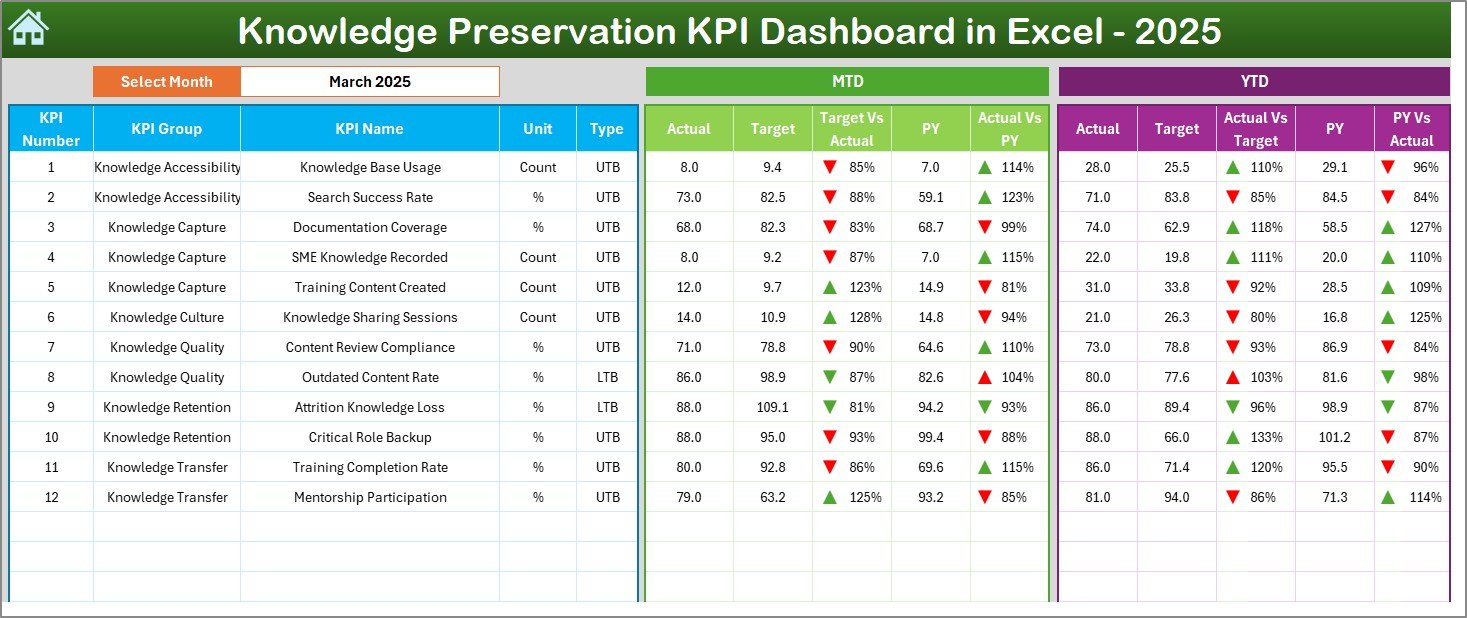
The Dashboard sheet is the central performance view where all KPIs are summarized.
Key Features of the Dashboard Sheet
-
Month Selection Dropdown (Range D3)
Selecting a month updates the entire dashboard dynamically. -
MTD Performance Analysis
-
MTD Actual
-
MTD Target
-
Previous Year (PY)
-
Target vs Actual (with up/down arrows)
-
PY vs Actual (with up/down arrows)
-
-
YTD Performance Analysis
-
YTD Actual
-
YTD Target
-
Previous Year (PY)
-
Target vs Actual
-
PY vs Actual
-
-
Conditional Formatting
Color-coded arrows highlight performance direction instantly.
This sheet allows leadership to assess knowledge preservation health at a glance.
Click to Purchases Knowledge Preservation KPI Dashboard in Excel
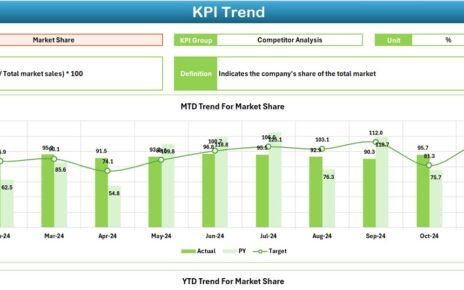
3. KPI Trend Sheet Tab – Performance Trend Analysis
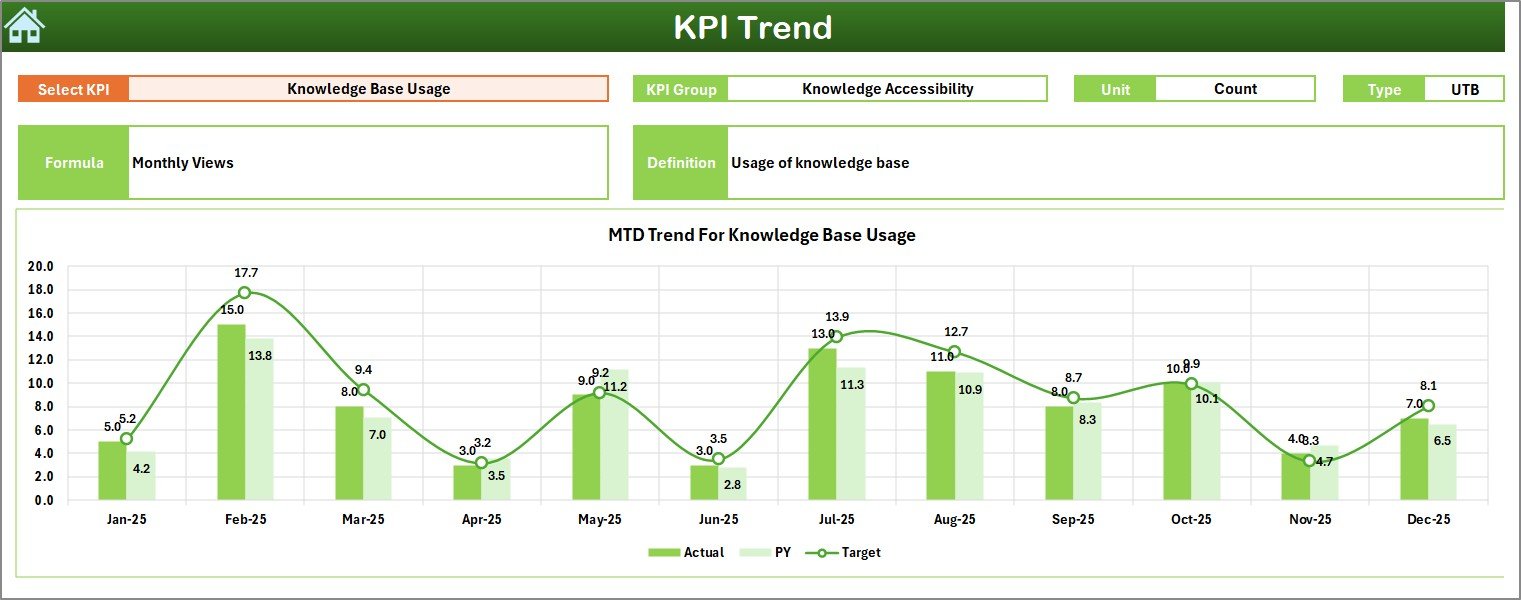
The KPI Trend sheet focuses on historical performance and trend behavior.
Key Features of the KPI Trend Sheet
-
KPI Selection Dropdown (Cell C3)
Users select a KPI to analyze. -
KPI Details Display
-
KPI Group
-
KPI Unit
-
KPI Type (Lower the Better / Upper the Better)
-
KPI Formula
-
KPI Definition
-
-
MTD and YTD Trend Charts
Trend charts show:-
Actual values
-
Target values
-
Previous Year values
-
Because of these visuals, teams identify improvement patterns and risk signals early.
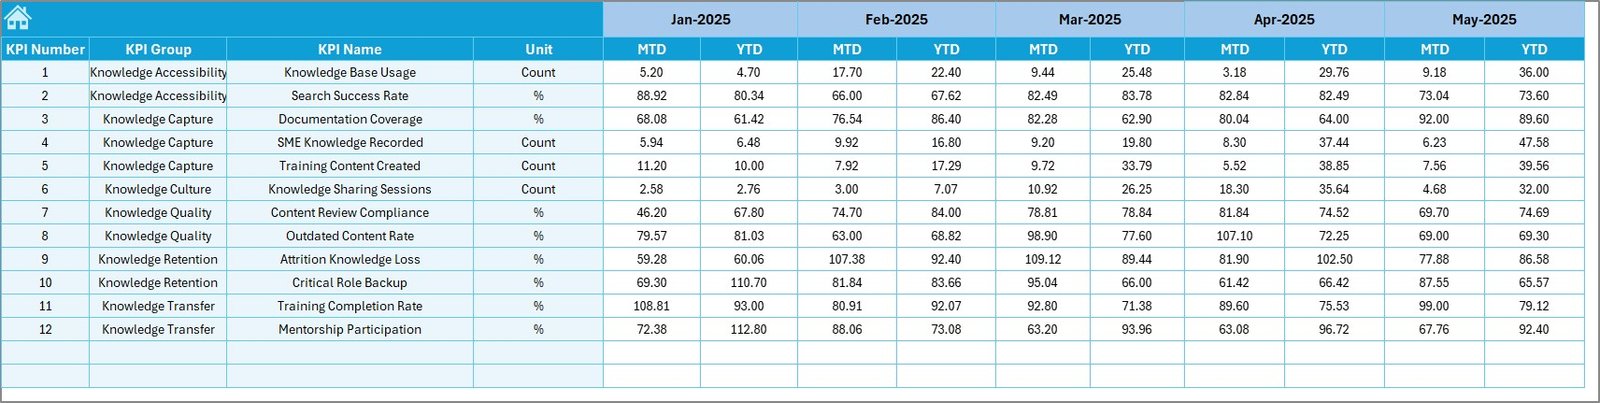
4. Actual Numbers Input Sheet – Data Entry for Current Year
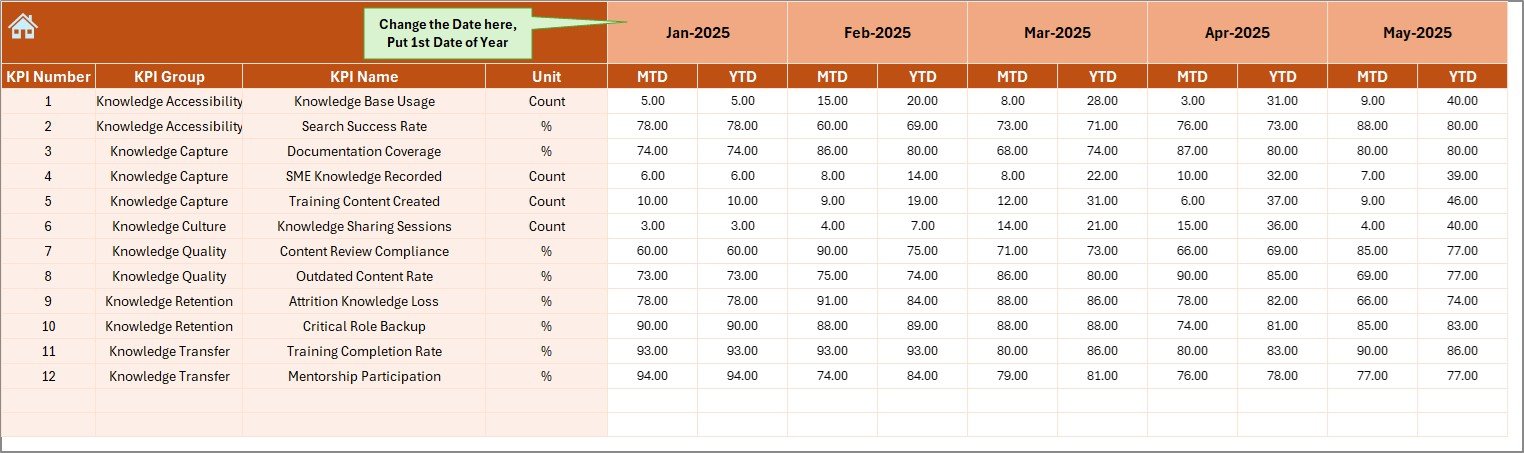
The Actual Numbers Input sheet captures actual KPI values.
Key Features
-
Enter MTD and YTD actual values
-
Change reporting month using Range E1
-
Flexible design supports monthly updates
-
Automatic dashboard refresh
This sheet ensures the dashboard always reflects current performance.
Click to Purchases Knowledge Preservation KPI Dashboard in Excel
5. Target Sheet Tab – KPI Targets
The Target sheet defines expected performance benchmarks.
Key Features
-
Enter MTD and YTD targets for each KPI
-
Supports realistic goal-setting
-
Enables performance gap analysis
Targets provide direction and accountability.
6. Previous Year Number Sheet Tab – Historical Comparison
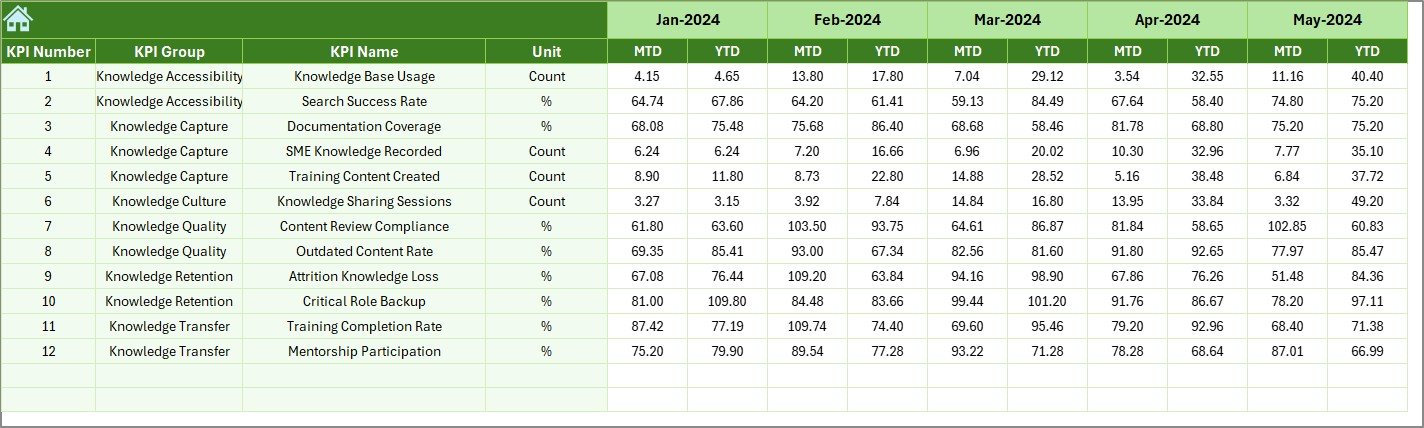
The Previous Year Number sheet stores historical KPI values.
Key Features
-
Same structure as current year data
-
Enables year-over-year comparison
-
Highlights improvement or decline trends
Historical context improves decision quality.
7. KPI Definition Sheet Tab – KPI Governance Layer
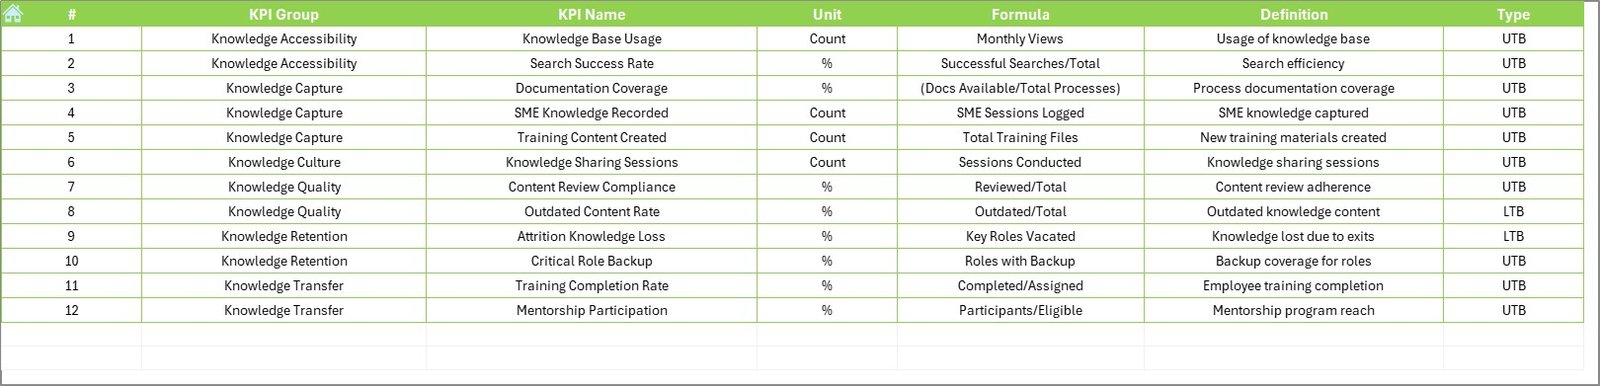
The KPI Definition sheet ensures consistency and clarity.
Information Captured
-
KPI Name
-
KPI Group
-
Unit
-
Formula
-
KPI Definition
This sheet prevents confusion and improves KPI credibility.
How Does This Dashboard Improve Knowledge Preservation?
A Knowledge Preservation KPI Dashboard in Excel improves knowledge management in several ways.
First, it creates visibility into knowledge risks.
Second, it aligns teams around measurable outcomes.
Third, it highlights gaps in documentation and transfer.
Finally, it supports proactive intervention.
As a result, knowledge preservation becomes systematic rather than reactive.
Click to Purchases Knowledge Preservation KPI Dashboard in Excel
Who Should Use a Knowledge Preservation KPI Dashboard in Excel?
This dashboard supports multiple roles and industries.
Common users include:
-
HR and L&D teams
-
Knowledge management teams
-
Operations leaders
-
Process improvement teams
-
IT and digital transformation teams
-
Compliance teams
-
Small and large organizations
Because Excel is widely used, adoption remains easy.
Advantages of Knowledge Preservation KPI Dashboard in Excel
Using a Knowledge Preservation KPI Dashboard in Excel offers several advantages.
1. Centralized Knowledge Metrics
All knowledge KPIs remain in one structured dashboard.
2. Clear MTD and YTD Visibility
MTD and YTD views support short-term and long-term monitoring.
3. Year-Over-Year Comparison
Previous year data highlights improvement trends.
4. Visual Performance Indicators
Conditional formatting simplifies interpretation.
5. Strong KPI Governance
Defined formulas and definitions ensure accuracy.
6. Easy Customization
Teams can add or modify KPIs easily.
7. Cost-Effective Solution
Excel removes the need for expensive KM platforms.
How to Use the Knowledge Preservation KPI Dashboard in Excel Step by Step?
Follow these steps to use the dashboard effectively.
Step 1: Define Knowledge KPIs
List all KPIs in the KPI Definition sheet.
Step 2: Set Targets
Enter MTD and YTD targets in the Target sheet.
Step 3: Enter Actual Data
Update actual values in the Actual Numbers Input sheet.
Step 4: Review Dashboard
Analyze MTD and YTD performance in the Dashboard sheet.
Step 5: Analyze Trends
Use the KPI Trend sheet to identify patterns.
Step 6: Take Action
Address gaps through documentation, training, or process improvement.
Click to Purchases Knowledge Preservation KPI Dashboard in Excel
What KPIs Can a Knowledge Preservation Dashboard Track?
This dashboard can track KPIs such as:
-
Knowledge documentation coverage
-
Process standardization rate
-
Knowledge transfer completion rate
-
Training effectiveness score
-
Dependency on key individuals
-
SOP update frequency
-
Knowledge access utilization
KPIs can be customized based on organizational needs.
Best Practices for the Knowledge Preservation KPI Dashboard in Excel
Follow these best practices to maximize value.
1. Focus on Critical Knowledge Areas
Track KPIs linked to business-critical processes.
2. Set Meaningful Targets
Targets should drive improvement, not just reporting.
3. Update Data Consistently
Regular updates ensure accurate insights.
4. Review Trends Regularly
Trends reveal hidden risks earlier.
5. Protect Formula Cells
Protect calculations to avoid accidental errors.
6. Use the Dashboard in Reviews
Include the dashboard in leadership reviews.
7. Continuously Improve KPIs
Refine KPIs as knowledge maturity grows.
Common Mistakes to Avoid in Knowledge Preservation Tracking
Avoid these common mistakes:
-
Tracking too many KPIs
-
Ignoring year-over-year trends
-
Using unclear KPI definitions
-
Delayed data updates
-
Treating knowledge preservation as a one-time effort
Avoiding these mistakes ensures sustainable knowledge management.
How Does This Dashboard Support Business Continuity?
Knowledge preservation directly supports continuity.
The dashboard helps leaders:
-
Identify high-risk knowledge areas
-
Reduce dependency on individuals
-
Improve handover quality
-
Strengthen resilience during change
As a result, organizations remain stable during transitions.
Click to Purchases Knowledge Preservation KPI Dashboard in Excel
Conclusion: Why You Need a Knowledge Preservation KPI Dashboard in Excel
A Knowledge Preservation KPI Dashboard in Excel transforms knowledge management from assumptions into measurable performance. With structured KPI definitions, MTD and YTD tracking, trend analysis, and visual indicators, organizations gain control over their most valuable asset.
Because Excel offers flexibility, affordability, and ease of use, this dashboard becomes a practical and powerful solution for long-term knowledge sustainability.
If your organization wants to protect expertise, reduce risk, and ensure continuity, this dashboard is a must-have tool.
Frequently Asked Questions (FAQs)
What is a Knowledge Preservation KPI Dashboard in Excel?
It is an Excel-based dashboard used to measure and monitor knowledge retention, transfer, and continuity KPIs.
Is this dashboard easy to use?
Yes, anyone with basic Excel knowledge can use it easily.
Can I customize the KPIs?
Yes, KPIs can be added, removed, or modified as needed.
Why are MTD and YTD views important?
MTD shows short-term performance, while YTD reveals long-term trends.
Does this dashboard support audits?
Yes, it provides structured documentation and historical tracking.
Is this suitable for small organizations?
Absolutely. Small teams benefit greatly from structured knowledge tracking.
Can this dashboard support digital transformation initiatives?
Yes, it aligns knowledge preservation with transformation goals.
Click to Purchases Knowledge Preservation KPI Dashboard in Excel
Visit our YouTube channel to learn step-by-step video tutorials