Corporate secretarial teams play a critical role in ensuring governance, compliance, and statutory adherence within an organization. However, when teams track key performance indicators using scattered Excel files, emails, or manual reports, visibility drops quickly. As a result, decision-makers struggle to identify compliance gaps, missed deadlines, and performance issues on time.
That is exactly where a Corporate Secretarial KPI Dashboard in Power BI makes a real difference.
This in-depth guide explains what a Corporate Secretarial KPI Dashboard in Power BI is, why it is important, how it works, and how each dashboard page supports better decision-making. Moreover, you will learn its advantages, best practices, and common questions answered. By the end, you will clearly understand how this ready-to-use dashboard helps secretarial teams stay compliant, efficient, and audit-ready.
Click to Purchases Corporate Secretarial KPI Dashboard in Power BI
What Is a Corporate Secretarial KPI Dashboard in Power BI?
A Corporate Secretarial KPI Dashboard in Power BI is an interactive analytics solution designed to monitor, analyze, and visualize key performance indicators related to corporate governance and statutory compliance.
Instead of reviewing static spreadsheets or preparing manual reports every month, this dashboard presents real-time KPI performance using charts, tables, icons, and slicers. As a result, secretarial teams can track compliance status, compare targets versus actuals, and analyze trends across months and years from a single screen.
Additionally, this dashboard uses Excel as the data source, which makes it easy for teams to update actuals, targets, and KPI definitions without technical complexity.
Why Do Corporate Secretarial Teams Need a KPI Dashboard?
Corporate secretarial functions involve deadlines, regulations, filings, board meetings, and statutory reporting. Therefore, even a small oversight can lead to penalties, governance risks, or reputational damage.
A Corporate Secretarial KPI Dashboard in Power BI helps because:
-
It provides clear visibility into compliance performance
-
It highlights missed or delayed KPIs instantly
-
It reduces manual tracking and reporting efforts
-
It improves management reporting and governance reviews
-
It ensures data consistency and accuracy
Moreover, leadership teams can use this dashboard during board meetings and audits to demonstrate control and transparency.
How Does the Corporate Secretarial KPI Dashboard in Power BI Work?
The dashboard works on a simple and structured data flow. First, users maintain KPI data in Excel. Then, Power BI connects to that Excel file and transforms the data into interactive visuals.
Step-by-Step Working Process
-
Define KPIs and targets in Excel
-
Enter monthly actual and target values
-
Refresh the Power BI dashboard
-
Analyze MTD and YTD performance
-
Drill through KPIs for detailed definitions
As a result, the dashboard updates automatically without rebuilding visuals every time.
What Are the Key Features of the Corporate Secretarial KPI Dashboard in Power BI?
This dashboard comes with a ready-to-use structure, intuitive navigation, and powerful analytical features.
Key Highlights
-
Excel-based data input
-
Month and KPI Group slicers
-
MTD and YTD performance tracking
-
Target vs Actual comparison
-
Previous Year performance analysis
-
Visual KPI status indicators
-
Drill-through KPI definitions
What Pages Are Available in the Corporate Secretarial KPI Dashboard?
The dashboard consists of three well-structured pages, each designed to answer a specific business question.
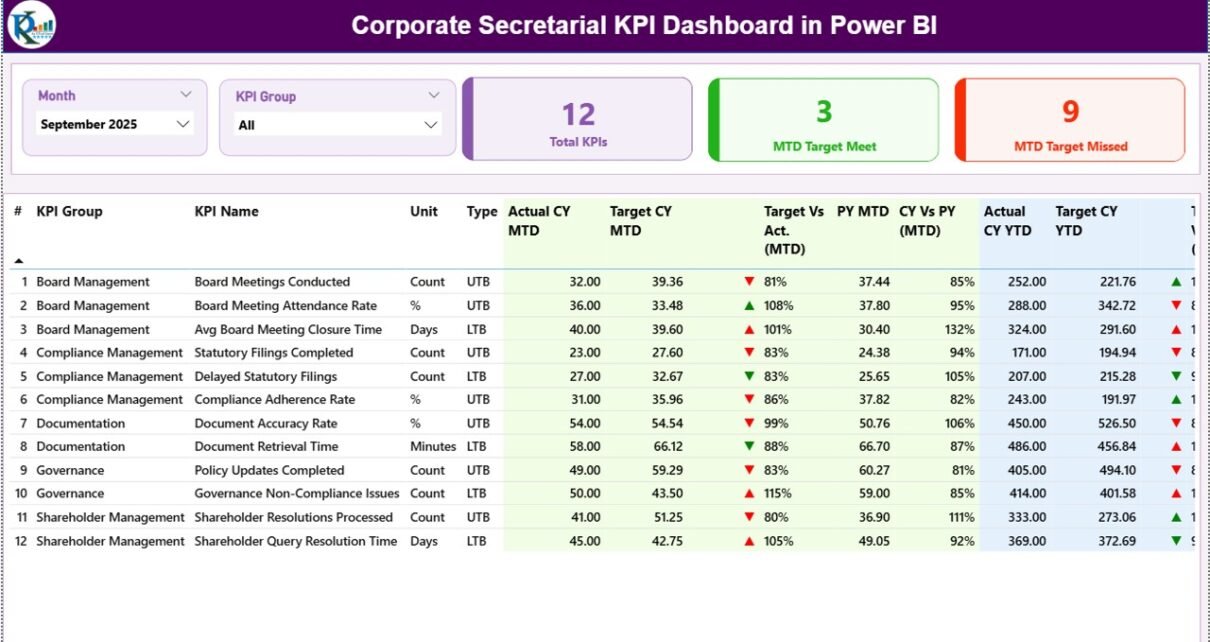
1. Summary Page: How Can You Track Overall KPI Performance?

The Summary Page acts as the central control panel for the dashboard. It gives a high-level view of all corporate secretarial KPIs in one place.
What Filters Are Available on the Summary Page?
At the top of the page, you will find:
-
Month Slicer – Select a specific month for analysis
-
KPI Group Slicer – Filter KPIs by category
These slicers allow users to narrow down the analysis quickly.
What KPI Cards Are Displayed on the Summary Page?
The dashboard shows three KPI cards at the top:
-
Total KPIs Count
-
MTD Target Met Count
-
MTD Target Missed Count
These cards instantly summarize performance for the selected month.
What Information Does the Detailed KPI Table Show?
Below the KPI cards, a detailed KPI table displays complete performance metrics.
Columns Available in the KPI Table
-
KPI Number – Unique sequence number of the KPI
-
KPI Group – Category of the KPI
-
KPI Name – Name of the KPI
-
Unit – Measurement unit
-
Type – LTB (Lower the Better) or UTB (Upper the Better)
How Are MTD Metrics Displayed?
-
Actual CY MTD – Current year actual MTD value
-
Target CY MTD – Current year target MTD value
-
MTD Icon – Green ▲ or Red ▼ indicator
-
Target vs Actual (MTD) – Actual / Target percentage
-
PY MTD – Previous year MTD value
-
CY vs PY (MTD) – Current vs previous year comparison
These metrics help teams identify short-term compliance performance quickly.
How Are YTD Metrics Displayed?
Click to Purchases Corporate Secretarial KPI Dashboard in Power BI
-
Actual CY YTD – Current year actual YTD value
-
Target CY YTD – Current year target YTD value
-
YTD Icon – Green ▲ or Red ▼ indicator
-
Target vs Actual (YTD) – Actual / Target percentage
-
PY YTD – Previous year YTD value
-
CY vs PY (YTD) – Current vs previous year comparison
As a result, leadership teams can evaluate long-term trends and progress.
2. KPI Trend Page: How Can You Analyze Performance Trends?
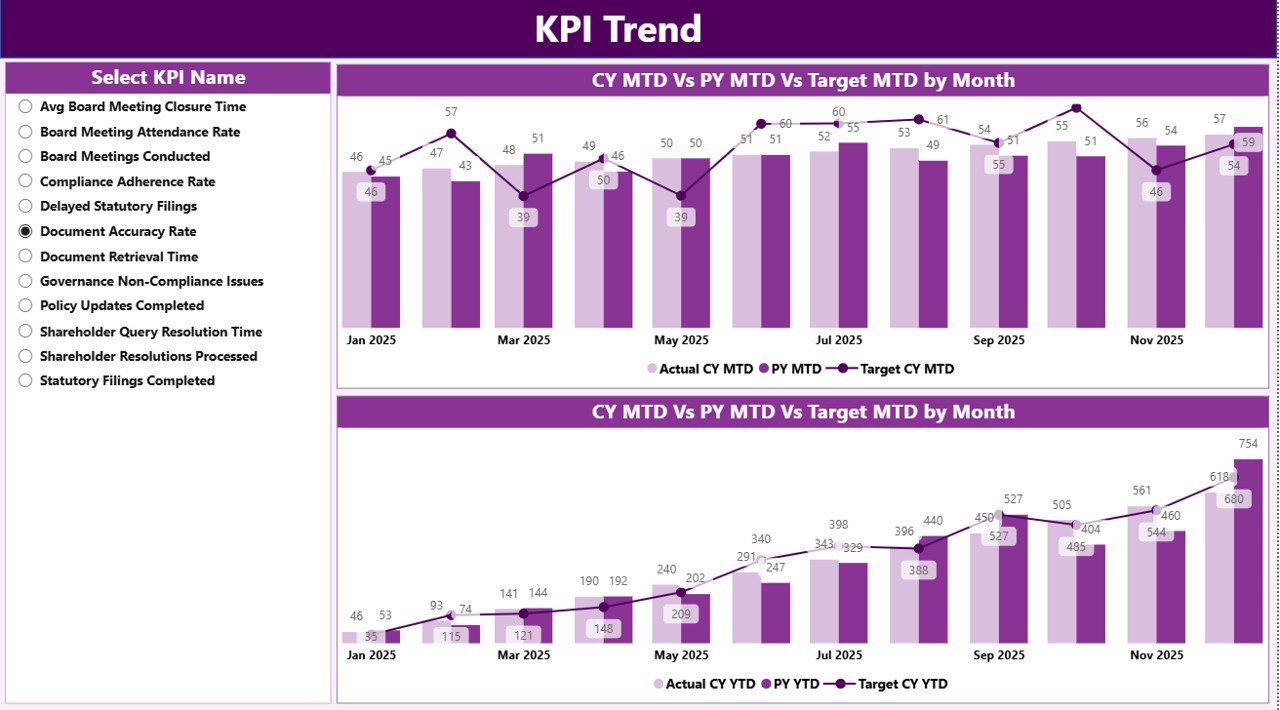
The KPI Trend Page focuses on trend analysis for individual KPIs.
What Is the Purpose of the KPI Trend Page?
This page helps users understand:
-
How KPI performance changes over time
-
Whether targets remain realistic
-
How current performance compares with last year
What Charts Are Used on the KPI Trend Page?
The page includes two combo charts:
-
MTD Trend Chart – Actual vs Target vs Previous Year
-
YTD Trend Chart – Actual vs Target vs Previous Year
These charts provide a clear visual comparison across months.
How Does the KPI Slicer Work?
A KPI Name slicer appears on the left side of the page. Users can select any KPI to update both charts instantly. As a result, analysis becomes fast and focused.
3. KPI Definition Page: How Can You View KPI Details?
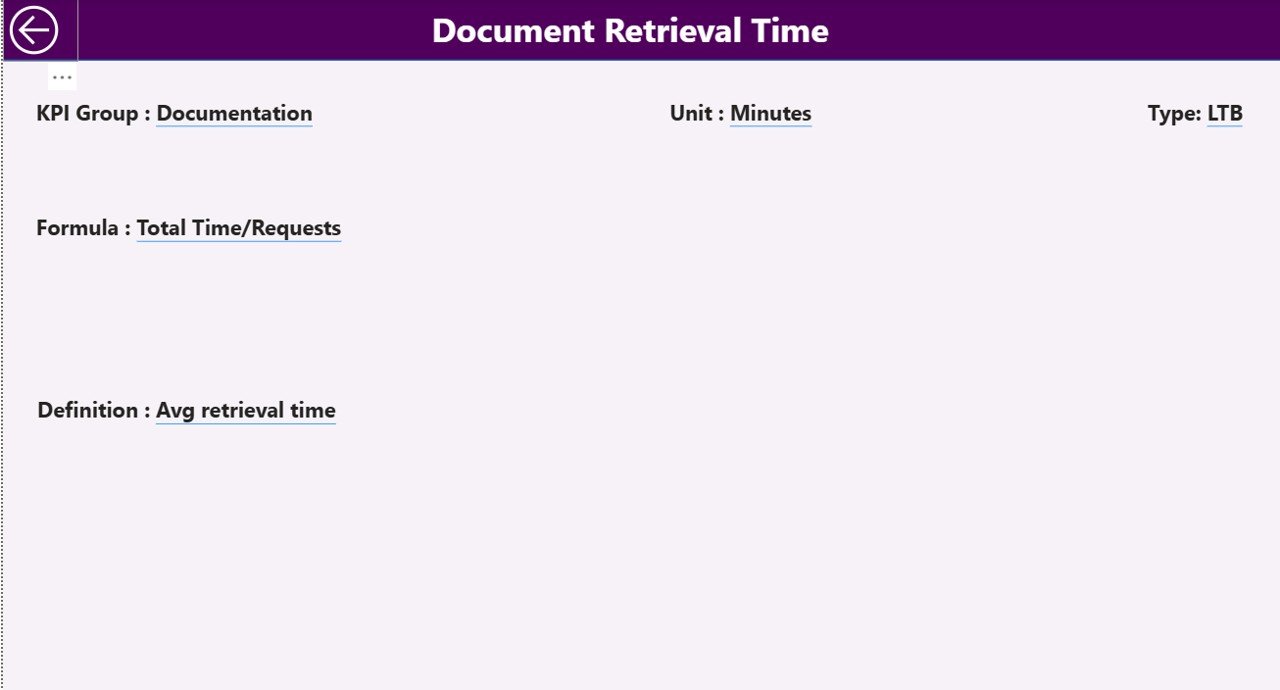
The KPI Definition Page serves as a drill-through page. It remains hidden to maintain a clean dashboard layout.
What Information Does the KPI Definition Page Show?
This page displays:
-
KPI Formula
-
KPI Definition
-
KPI Unit
-
KPI Type (LTB or UTB)
Users can drill through from the Summary Page to view these details.
How Do You Navigate Back to the Summary Page?
A Back Button appears on the top-left corner of the page. With one click, users can return to the main dashboard.
What Excel Data Is Required for This Dashboard?
The Corporate Secretarial KPI Dashboard uses three structured Excel worksheets as its data source.
1. Input_Actual Sheet: How Do You Enter Actual Data?
Click to Purchases Corporate Secretarial KPI Dashboard in Power BI
In this sheet, users enter:
-
KPI Name
-
Month (first date of the month)
-
MTD Actual Value
-
YTD Actual Value
This sheet captures real performance data.
2. Input_Target Sheet: How Do You Enter Target Data?
In this sheet, users enter:
-
KPI Name
-
Month (first date of the month)
-
MTD Target Value
-
YTD Target Value
This structure ensures accurate target comparison.
3. KPI Definition Sheet: How Do You Define KPIs?
In this sheet, users maintain:
-
KPI Number
-
KPI Group
-
KPI Name
-
Unit
-
Formula
-
Definition
-
Type (LTB or UTB)
This sheet acts as the single source of truth for KPI metadata.
Advantages of Corporate Secretarial KPI Dashboard in Power BI
Using this dashboard delivers multiple business benefits.
Key Advantages
-
Improves compliance visibility
-
Reduces manual reporting effort
-
Highlights risks proactively
-
Enhances governance transparency
-
Supports audit and board reviews
-
Enables data-driven decisions
-
Ensures consistent KPI tracking
Best Practices for Corporate Secretarial KPI Dashboard in Power BI
To get maximum value, teams should follow best practices.
Recommended Best Practices
-
Define KPIs clearly with measurable targets
-
Update Excel data on a fixed schedule
-
Use consistent KPI naming conventions
-
Review missed KPIs weekly
-
Share dashboard access with leadership
-
Validate data before monthly refresh
-
Maintain historical data for trend analysis
How Does This Dashboard Support Compliance and Governance?
This dashboard strengthens governance by:
-
Tracking statutory deadlines
-
Monitoring filing accuracy
-
Measuring secretarial efficiency
-
Providing audit-ready reports
-
Improving accountability across teams
As a result, organizations reduce compliance risk significantly.
Who Can Use the Corporate Secretarial KPI Dashboard?
Click to Purchases Corporate Secretarial KPI Dashboard in Power BI
This dashboard suits:
-
Corporate secretarial teams
-
Compliance officers
-
Legal departments
-
Governance professionals
-
Senior management
-
Internal auditors
Conclusion: Why Should You Use a Corporate Secretarial KPI Dashboard in Power BI?
A Corporate Secretarial KPI Dashboard in Power BI transforms how organizations manage compliance and governance. Instead of manual tracking and delayed reporting, teams gain real-time visibility, clear insights, and actionable trends.
Moreover, its Excel-based data input makes it easy to adopt, while Power BI visuals ensure professional reporting. When organizations use this dashboard consistently, they improve compliance discipline, reduce risks, and strengthen governance culture.
Frequently Asked Questions (FAQs)
What is a Corporate Secretarial KPI Dashboard in Power BI?
It is an interactive dashboard that tracks corporate secretarial KPIs using Power BI with Excel as the data source.
Can non-technical users update this dashboard?
Yes, users only update Excel sheets. Power BI refresh handles the rest.
Does this dashboard support MTD and YTD analysis?
Yes, it tracks both MTD and YTD actuals, targets, and comparisons.
Can I customize KPIs and targets?
Yes, you can add, modify, or remove KPIs directly in the Excel file.
Is this dashboard suitable for audits?
Yes, it provides structured, traceable, and transparent KPI reporting for audits.
Does the dashboard show previous year comparisons?
Yes, it includes both MTD and YTD previous year comparisons.
Visit our YouTube channel to learn step-by-step video tutorials