The live events industry moves fast. Ticket sales change daily. Marketing campaigns impact revenue instantly. Audience ratings influence future bookings. Therefore, event organizers must track everything in real time.
However, many event managers still rely on scattered Excel sheets. As a result, they miss trends. They lose revenue opportunities. They fail to optimize pricing and promotions.
That is exactly why a Ticketing and Live Events Dashboard in Power BI becomes essential.
This powerful and interactive dashboard transforms raw ticketing data into clear, visual, and actionable insights. Moreover, it helps you monitor gross sales, net sales, discounts, ratings, marketing channels, venues, cities, and ticket types — all in one place.
In this complete guide, you will learn:
Click to Purchases Ticketing and Live Events Dashboard in Power BI
-
What a Ticketing and Live Events Dashboard in Power BI is
-
Why event organizers need it
-
Detailed explanation of all 5 dashboard pages
-
Advantages of using it
-
Best practices for implementation
-
Frequently asked questions
Let’s dive in.
What Is a Ticketing and Live Events Dashboard in Power BI?
A Ticketing and Live Events Dashboard in Power BI is an interactive analytics solution designed to track, analyze, and optimize ticket sales and event performance.
Instead of reviewing multiple reports, you can:
-
Track gross and net sales instantly
-
Monitor marketing channel performance
-
Analyze event ratings by region and event type
-
Compare ticket type performance
-
Identify top-performing venues and cities
-
Evaluate monthly sales trends
Because Power BI connects directly to Excel or other data sources, the dashboard updates automatically. Therefore, decision-makers get real-time insights.
Why Do Event Organizers Need a Ticketing Dashboard?
Live events involve multiple variables. Ticket prices vary. Discounts change frequently. Marketing campaigns run across different channels. Customer ratings impact future bookings.
Without a structured dashboard:
-
Revenue tracking becomes confusing
-
Marketing ROI becomes unclear
-
Venue performance remains hidden
-
Discount impact goes unnoticed
-
Seasonal trends stay invisible
However, when you use a Power BI dashboard, you gain clarity. You understand what works. You fix what does not work. As a result, you improve profitability.
What Are the Key Metrics in a Ticketing and Live Events Dashboard?
Click to Purchases Ticketing and Live Events Dashboard in Power BI
Before we explore the dashboard pages, let us understand the core KPIs:
-
Gross Sales – Total revenue before discounts
-
Net Sales – Revenue after discounts
-
Discount Amount – Total discount provided
-
Rating – Audience satisfaction score
-
Marketing Channel Performance – Sales contribution by campaign
-
Venue Performance – Revenue by venue
-
City & Region Performance – Geographic sales distribution
These KPIs drive every decision in event management.
What Are the Pages in the Ticketing and Live Events Dashboard?
This Power BI dashboard includes five powerful and interactive pages. Each page focuses on a specific business angle.
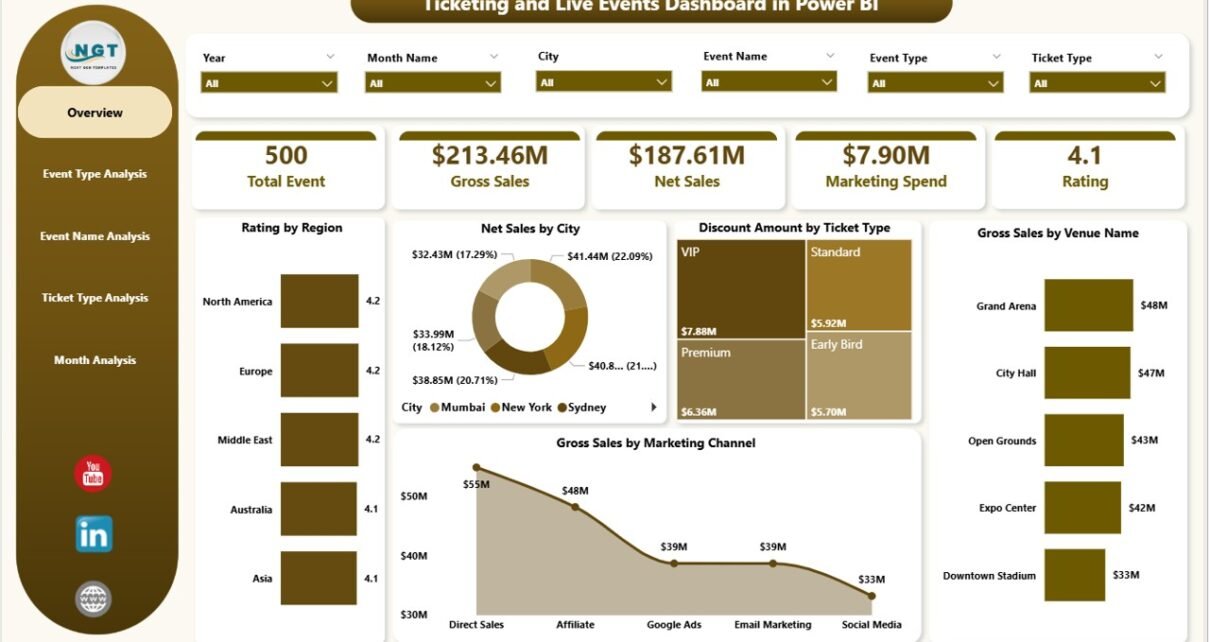
1️⃣ What Does the Overview Page Show?
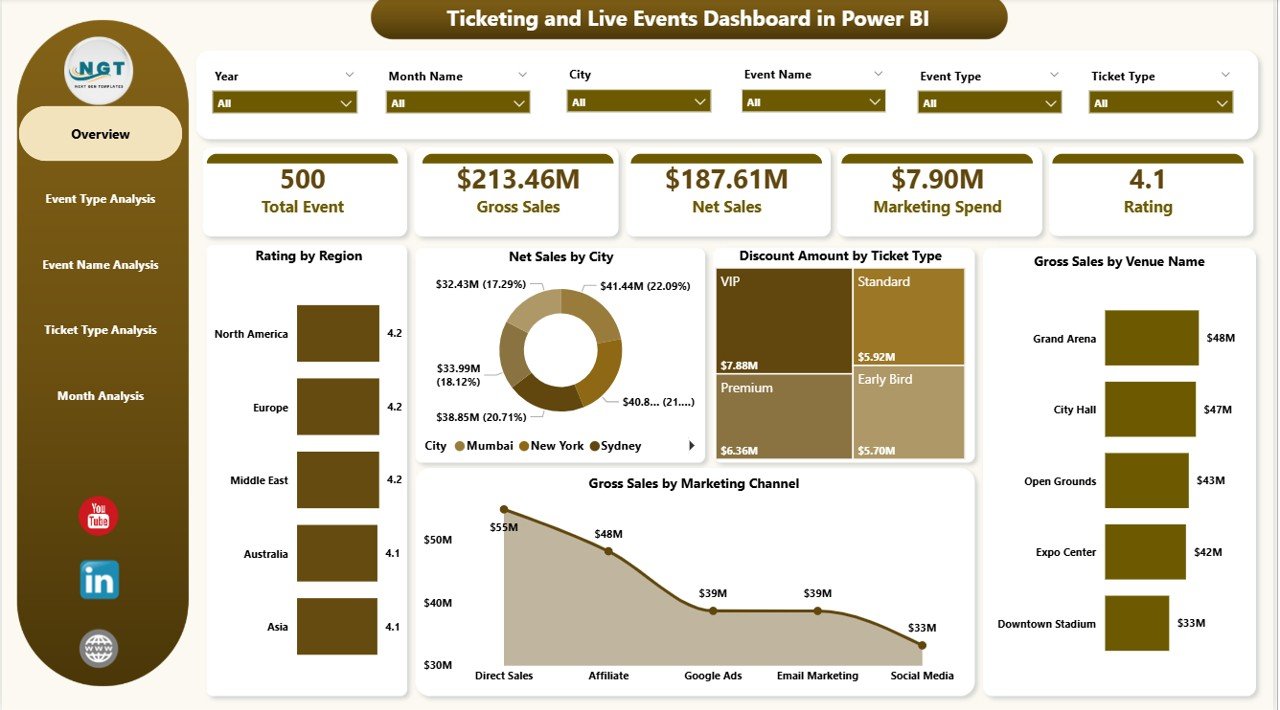
The Overview Page serves as the main summary dashboard. Here, you get a complete snapshot of performance.
Key Features of Overview Page
-
Interactive slicers (filters) for dynamic selection
-
5 KPI Cards for instant insights
-
Visual breakdowns by region, city, venue, and channel
Visuals Included:
-
Rating by Region
-
Net Sales by City
-
Discount Amount by Ticket Type
-
Gross Sales by Venue Name
-
Gross Sales by Marketing Channel
Why Is the Overview Page Important?
First, it helps leadership teams understand performance instantly.
Second, it highlights top-performing regions and venues.
Third, it identifies which marketing channel drives the highest revenue.
Therefore, executives can take quick and confident decisions.
2️⃣ How Does the Event Type Analysis Page Help?
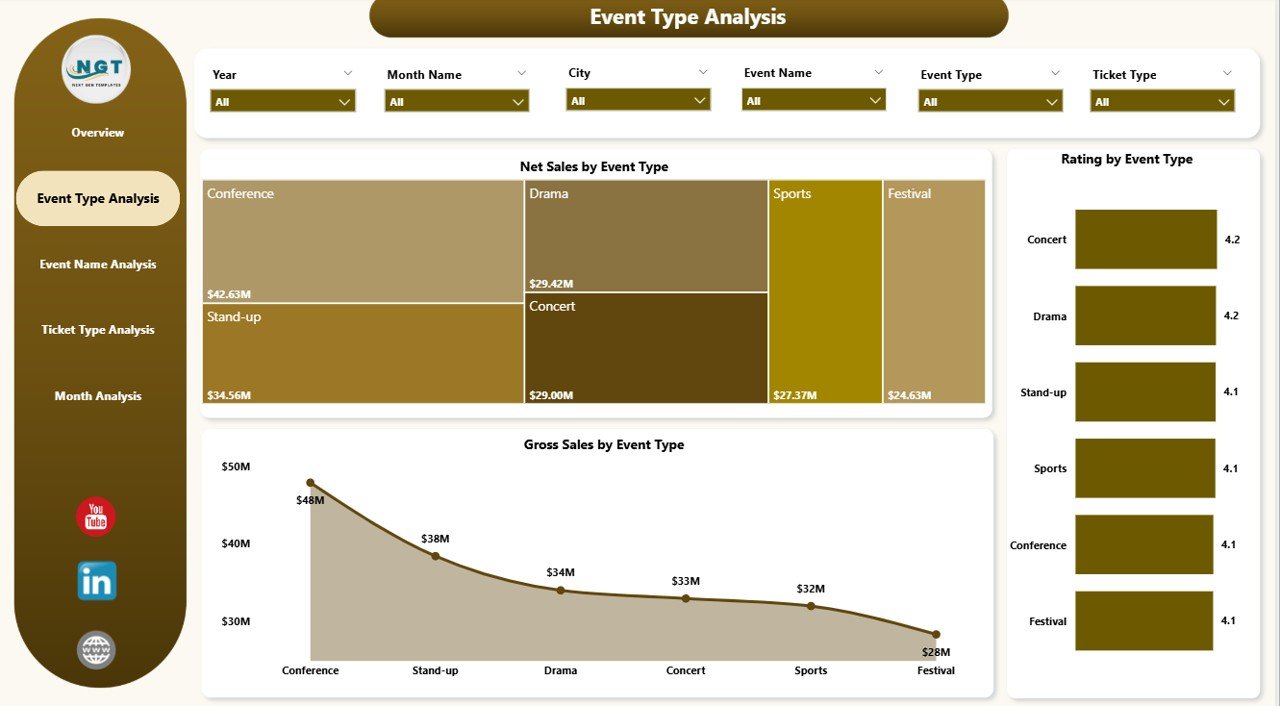
The Event Type Analysis Page focuses on performance by event category.
For example:
-
Concerts
-
Sports
-
Theatre
-
Comedy Shows
-
Conferences
Charts Included:
-
Rating by Event Type
-
Net Sales by Event Type
-
Gross Sales by Event Type
Why Is This Page Critical?
Because different event types attract different audiences.
For example, concerts may generate high gross sales. However, conferences may generate higher ratings. Therefore, this page helps you balance revenue and customer satisfaction.
Moreover, you can:
-
Identify high-demand event categories
-
Allocate marketing budget effectively
-
Plan future event schedules strategically
3️⃣ What Insights Does the Event Name Analysis Page Provide?
Click to Purchases Ticketing and Live Events Dashboard in Power BI
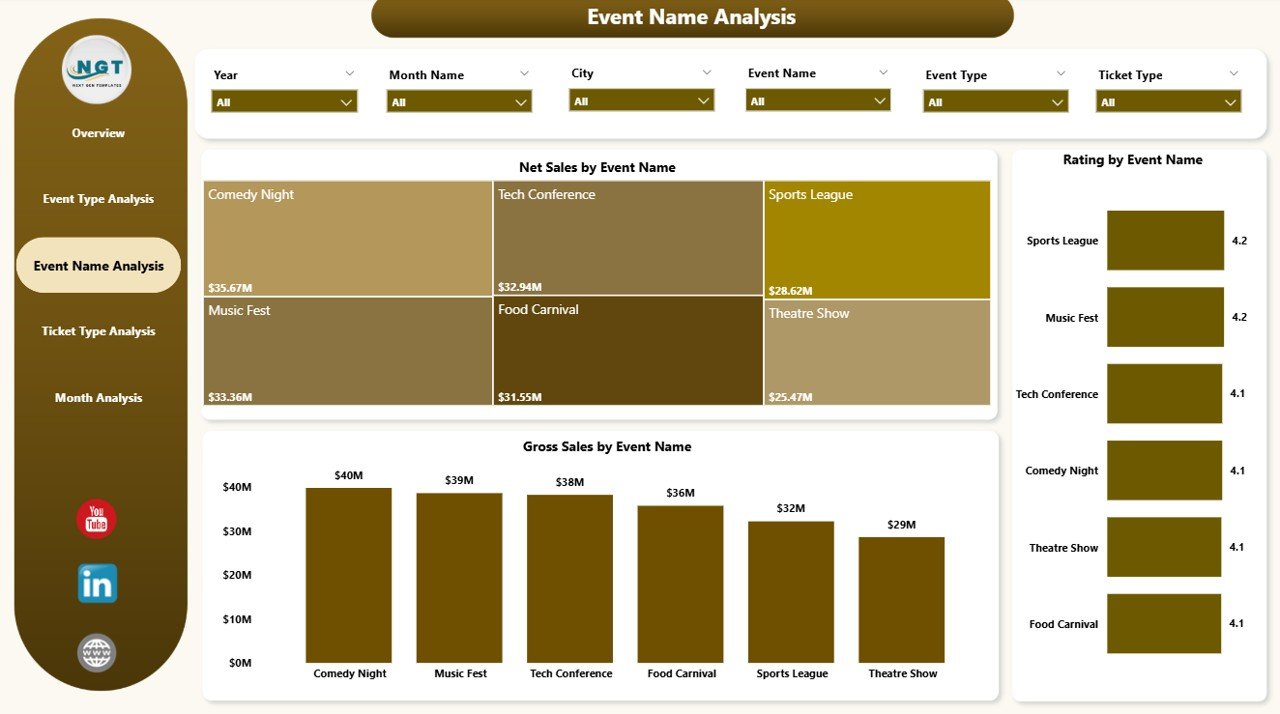
The Event Name Analysis Page goes deeper. Instead of categories, it focuses on individual events.
Charts Included:
-
Rating by Event Name
-
Net Sales by Event Name
-
Gross Sales by Event Name
Why Does This Matter?
Not every event performs equally.
For example:
-
A music festival may outperform others in gross sales.
-
A theatre show may receive higher ratings.
Therefore, this page allows you to:
-
Identify top-performing events
-
Detect underperforming shows
-
Adjust pricing strategies
-
Improve marketing campaigns
As a result, you maximize ticket revenue.
4️⃣ Why Is Ticket Type Analysis Important?
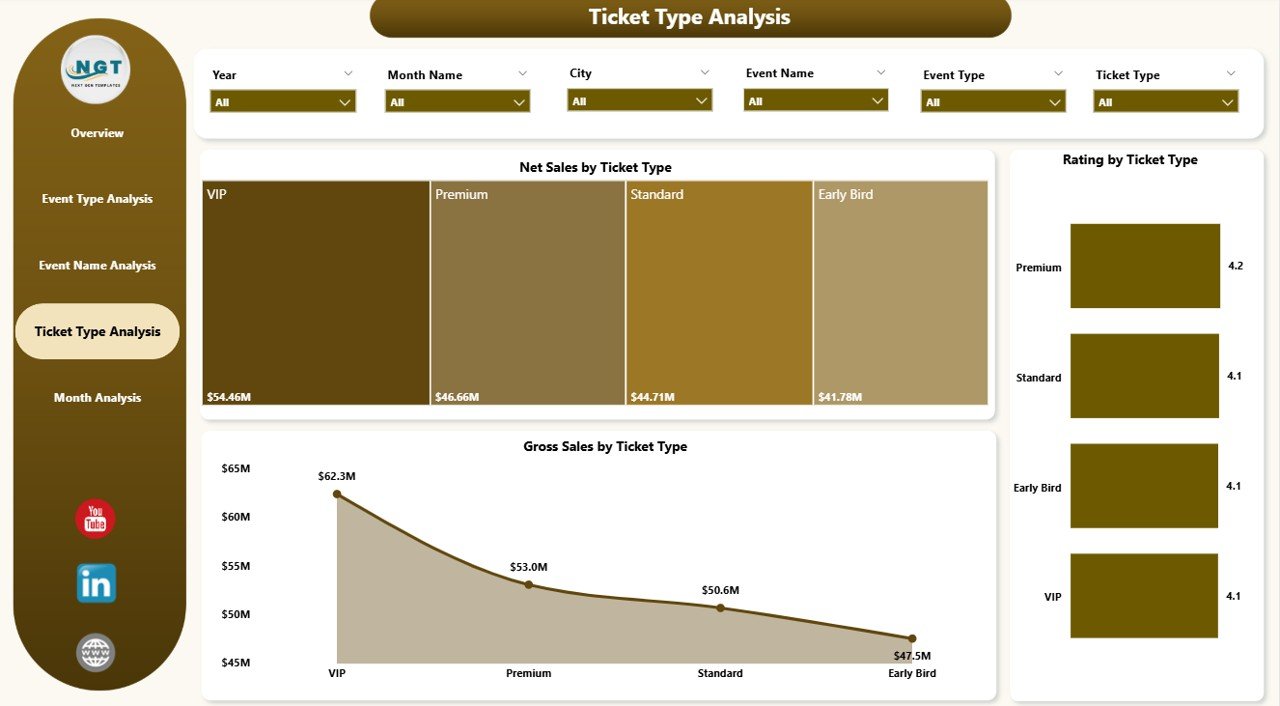
Ticket pricing plays a huge role in revenue. Most events offer multiple ticket types:
-
VIP
-
Premium
-
Standard
-
Early Bird
-
Group Pass
The Ticket Type Analysis Page provides deep insights into pricing strategy.
Charts Included:
-
Rating by Ticket Type
-
Net Sales by Ticket Type
-
Gross Sales by Ticket Type
Key Benefits
First, you understand which ticket type generates the most revenue.
Second, you evaluate discount impact.
Third, you optimize pricing tiers.
For example, VIP tickets may generate high gross sales. However, Standard tickets may drive volume. Therefore, you must balance both.
5️⃣ How Does Month Analysis Improve Planning?
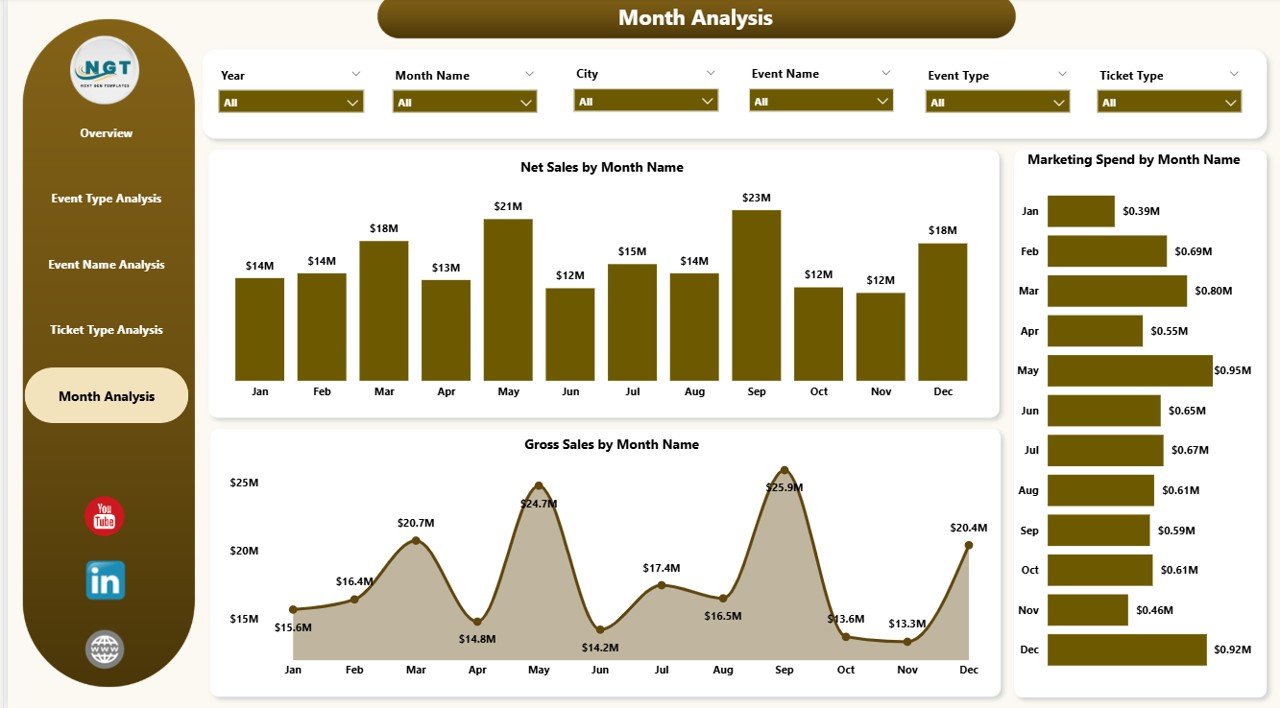
Seasonality affects live events significantly. Some months attract higher audiences. Others remain slow.
The Month Analysis Page helps you understand trends.
Charts Included:
-
Marketing Spend by Month
-
Net Sales by Month
-
Gross Sales by Month
Why This Page Is Powerful
Because you can compare marketing spend with revenue.
For example:
-
If marketing spend increases but sales do not grow, then you must adjust strategy.
-
If sales spike during festive seasons, then you should plan more events during that period.
Therefore, this page supports strategic planning.
Advantages of Ticketing and Live Events Dashboard in Power BI
Now let us explore the major advantages.
1. Real-Time Performance Monitoring
You track sales instantly. Therefore, you react quickly.
2. Improved Revenue Optimization
You analyze ticket types and discounts. As a result, you maximize profit.
3. Better Marketing Decisions
You compare marketing channels. Therefore, you invest wisely.
4. Geographic Insights
You identify strong-performing regions and cities.
5. Venue Performance Tracking
You evaluate venue contribution and negotiate better deals.
6. Customer Satisfaction Monitoring
You track ratings. Therefore, you improve audience experience.
7. Data-Driven Decision Making
Instead of guessing, you rely on visual insights.
How Does This Dashboard Improve Business Strategy?
Click to Purchases Ticketing and Live Events Dashboard in Power BI
This dashboard does more than show numbers.
It helps you:
-
Plan future events based on demand
-
Optimize ticket pricing
-
Reduce unnecessary discounts
-
Improve marketing ROI
-
Strengthen venue partnerships
-
Increase customer loyalty
Therefore, it becomes a strategic tool, not just a reporting tool.
Best Practices for the Ticketing and Live Events Dashboard in Power BI
To get maximum value, follow these best practices:
1. Maintain Clean Data
Always ensure ticket data remains accurate. Incorrect data leads to wrong decisions.
2. Update Data Regularly
Connect the dashboard to your ticketing system for automatic refresh.
3. Use Clear Slicers
Create slicers for:
-
Date
-
Event Type
-
City
-
Ticket Type
-
Marketing Channel
This improves user experience.
4. Monitor Discounts Carefully
Track discount trends regularly. High discounts may reduce profit.
5. Compare Gross vs Net Sales
Always analyze both metrics. Gross sales show revenue. Net sales show actual earnings.
6. Review Ratings Monthly
Customer satisfaction impacts future sales. Therefore, monitor ratings consistently.
7. Align Marketing Spend with Revenue
Do not increase budget blindly. Always compare spend with performance.
Who Should Use This Dashboard?
This dashboard benefits:
-
Event organizers
-
Ticketing companies
-
Marketing managers
-
Venue owners
-
Entertainment companies
-
Sports event managers
-
Festival planners
If you manage live events, you need this dashboard.
How to Implement the Ticketing Dashboard in Power BI?
Implementation remains simple.
Step 1: Collect ticket sales data in Excel.
Step 2: Include columns like Event Name, Event Type, City, Venue, Ticket Type, Gross Sales, Discount, Net Sales, Marketing Channel, Rating, Date.
Step 3: Import data into Power BI.
Step 4: Create relationships if needed.
Step 5: Design visuals as per 5 pages.
Step 6: Add slicers for dynamic filtering.
Step 7: Publish to Power BI Service for sharing.
As a result, your organization gets real-time visibility.
What Makes Power BI the Best Tool for Ticketing Analytics?
Power BI offers:
-
Interactive visuals
-
Real-time updates
-
Drill-down capability
-
Cloud sharing
-
Strong data modeling
-
Easy integration with Excel
Therefore, it becomes the perfect solution for event analytics.
Conclusion
The live events industry grows rapidly. Competition increases every year. Therefore, event managers must rely on data-driven insights.
A Ticketing and Live Events Dashboard in Power BI transforms scattered ticket data into a powerful decision-making system. It provides clarity. It improves revenue. It enhances marketing strategy. It strengthens customer satisfaction.
Instead of reacting late, you act fast. Instead of guessing, you decide confidently.
If you want to scale your events business, this dashboard becomes your ultimate performance tool.
Frequently Asked Questions with Answers
1. What is a Ticketing and Live Events Dashboard in Power BI?
It is an interactive Power BI dashboard that tracks ticket sales, revenue, ratings, venues, and marketing performance for live events.
2. What KPIs should I track in ticketing analytics?
You should track:
-
Gross Sales
-
Net Sales
-
Discount Amount
-
Rating
-
Marketing Channel Performance
-
Venue Performance
-
City and Region Sales
3. How often should I update the dashboard?
You should update it daily or connect it to an automated data source for real-time insights.
4. Can small event organizers use this dashboard?
Yes. Small organizers benefit greatly because they can track revenue and optimize marketing easily.
5. Does this dashboard help improve profitability?
Yes. It helps you analyze ticket pricing, discount impact, and marketing ROI. Therefore, you increase profit margins.
6. Why should I use Power BI instead of Excel alone?
Power BI provides interactive visuals, drill-down features, and better data modeling. Therefore, it handles large datasets efficiently.
Visit our YouTube channel to learn step-by-step video tutorials