Water is life. However, managing water resources has become more complex than ever. Cities grow fast. Industries consume more water. Climate change affects rainfall patterns. Therefore, water authorities must track performance in real time.
Still, many organizations rely on scattered reports. As a result, they miss leakage trends. They fail to control treatment costs. They struggle to compare actual performance with targets.
So, how can water utilities, municipalities, and environmental agencies monitor water usage, leakage percentage, treatment cost, and reservoir levels in one interactive system?
Click to Purchases Water Resource Management Dashboard in Power BI
The answer is simple.
You need a Water Resource Management Dashboard in Power BI.
In this comprehensive guide, you will learn:
-
What a Water Resource Management Dashboard in Power BI is
-
Why water authorities need it
-
Detailed explanation of all 5 dashboard pages
-
Key KPIs for water resource monitoring
-
Advantages of Water Resource Management Dashboard in Power BI
-
Best Practices for Water Resource Management Dashboard in Power BI
-
Frequently Asked Questions with Answers
Let’s explore everything step by step.
What Is a Water Resource Management Dashboard in Power BI?
A Water Resource Management Dashboard in Power BI is a ready-to-use analytical tool that helps water utilities track, analyze, and improve water performance metrics.
It allows you to:
-
Track actual value vs target value
-
Monitor leakage percentage
-
Compare current year vs previous year data
-
Analyze treatment cost in USD
-
Monitor reservoir level percentage
-
Evaluate performance by department, region, and water source
Moreover, Power BI provides interactive slicers, filters, and drill-down features. Therefore, decision-makers can analyze water data instantly without manual calculations.
Why Do Organizations Need a Water Resource Management Dashboard?
Water management requires accuracy and speed. However, manual reporting creates delays. Furthermore, it increases errors.
A Power BI dashboard solves these challenges because:
-
It centralizes all water data in one place
-
It updates data automatically
-
It visualizes trends clearly
-
It helps leaders take quick action
For example, if leakage percentage increases in one region, the dashboard highlights it immediately. As a result, the maintenance team can act fast.
Similarly, if treatment cost rises unexpectedly, management can investigate the reason.
Key Features of Water Resource Management Dashboard in Power BI
This dashboard includes 5 powerful analytical pages. Each page focuses on a specific area of water resource performance.
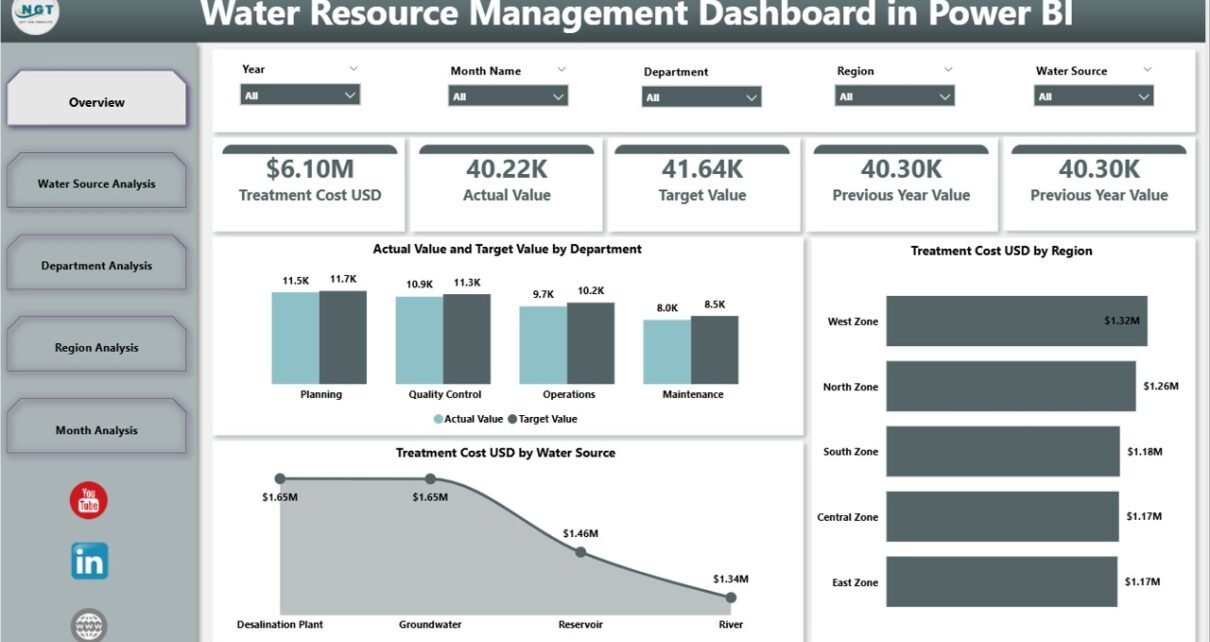
1️⃣ Overview Page – What Does the Main Dashboard Show?
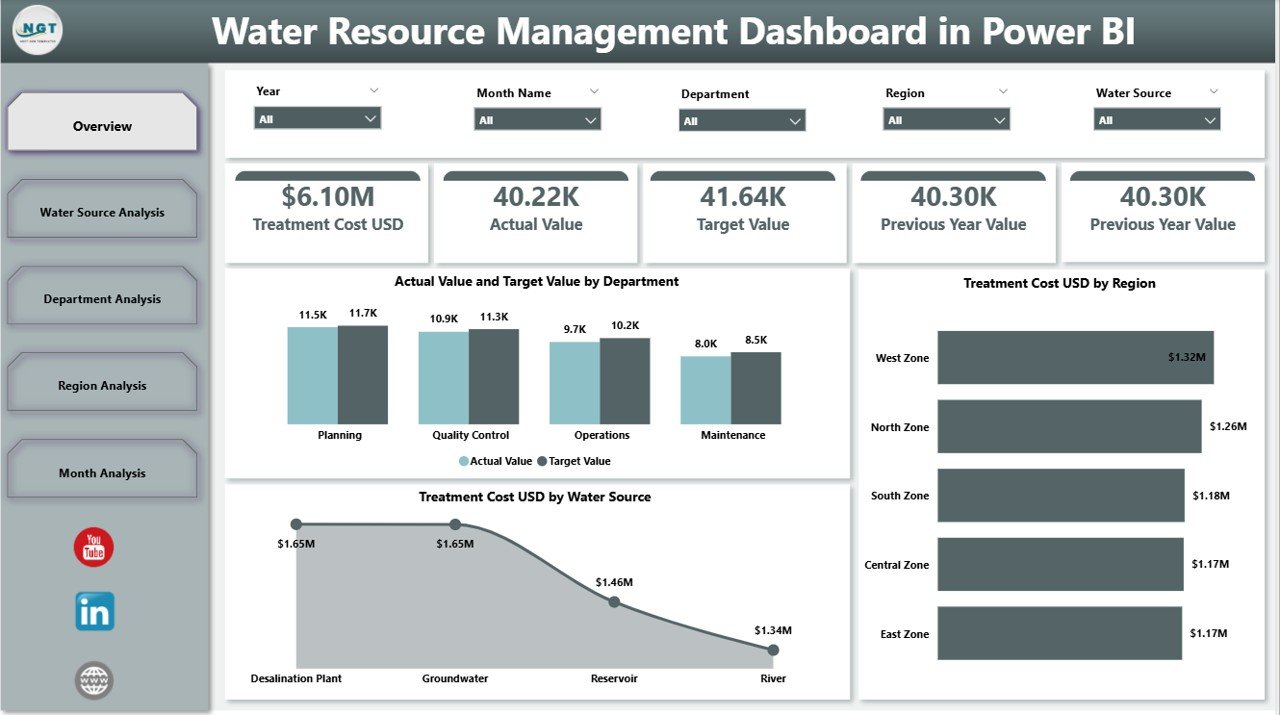
The Overview Page acts as the control center of the dashboard.
Here, you will find:
-
Silencers (Slicers) for filtering data
-
5 KPI Cards
-
Summary visuals for quick insights
KPI Cards on Overview Page
-
Actual Value by Department
-
Target Value by Department
-
Treatment Cost (USD) by Region
-
Treatment Cost (USD) by Water Source
-
Overall Performance Summary
Because this page shows high-level metrics, decision-makers can understand the complete water performance within seconds.
Moreover, slicers allow users to filter data by region, department, month, or water source. Therefore, analysis becomes simple and flexible.
2️⃣ Water Source Analysis – How Do Different Sources Perform?
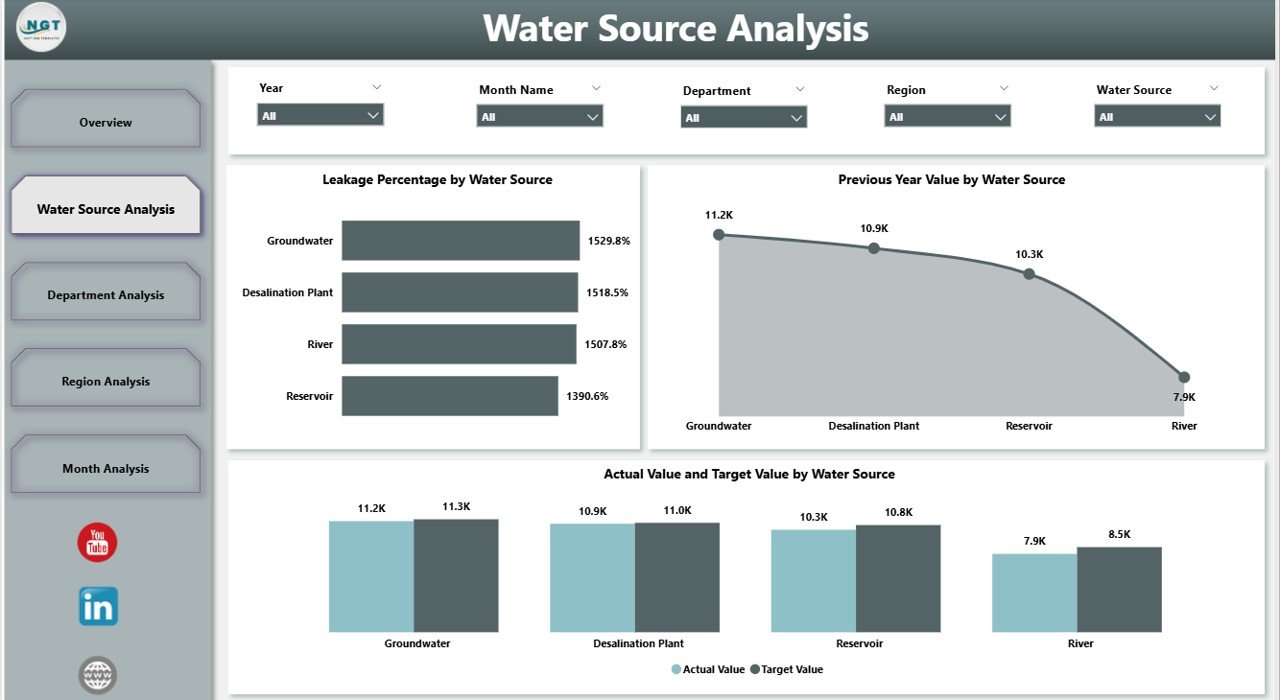
Water comes from various sources such as rivers, lakes, reservoirs, groundwater, and desalination plants. However, each source performs differently.
The Water Source Analysis Page helps you compare them clearly.
Charts Included:
-
Actual Value vs Target Value by Water Source
-
Leakage Percentage by Water Source
-
Previous Year Value by Water Source
For example, groundwater may show low leakage but high treatment cost. On the other hand, reservoir water may show seasonal fluctuation.
Therefore, this page helps planners optimize water sourcing strategy.
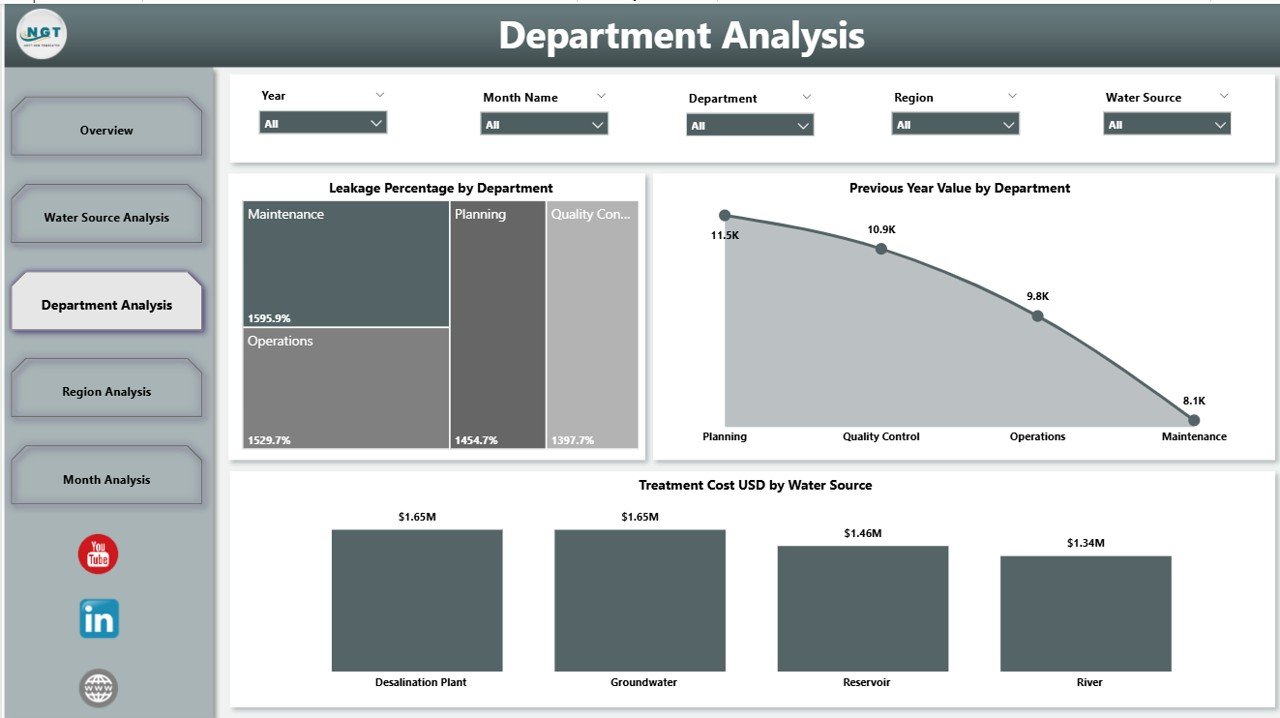
3️⃣ Department Analysis – How Efficient Are Departments?
Water utilities usually include departments such as:
-
Operations
-
Maintenance
-
Treatment
-
Distribution
-
Quality Control
However, without proper monitoring, inefficiency grows.
The Department Analysis Page provides:
-
Leakage Percentage by Department
-
Previous Year Value by Department
-
Treatment Cost USD by Department
Because of this analysis, managers can identify:
-
Departments with high leakage
-
Departments exceeding cost limits
-
Departments showing performance improvement
As a result, leadership can reward high performers and improve weak areas.
Click to Purchases Water Resource Management Dashboard in Power BI
4️⃣ Region Analysis – Which Region Needs Attention?
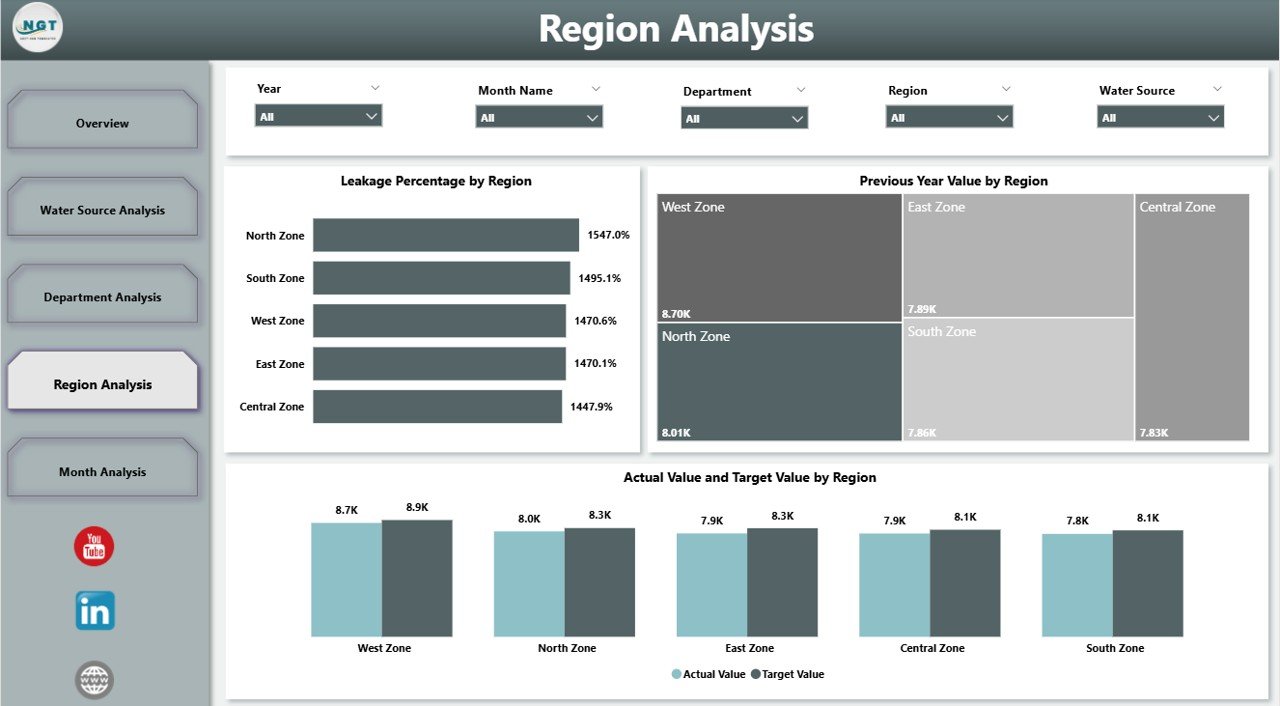
Different regions face different water challenges. Some areas suffer from high leakage. Others face high treatment cost.
The Region Analysis Page includes:
-
Leakage Percentage by Region
-
Previous Year Value by Region
-
Actual Value vs Target Value by Region
This page helps authorities:
-
Detect regional performance gaps
-
Compare urban vs rural areas
-
Allocate budget strategically
For instance, if one region shows rising leakage trends, management can schedule pipeline maintenance quickly.
5️⃣ Month Analysis – How Does Performance Change Over Time?
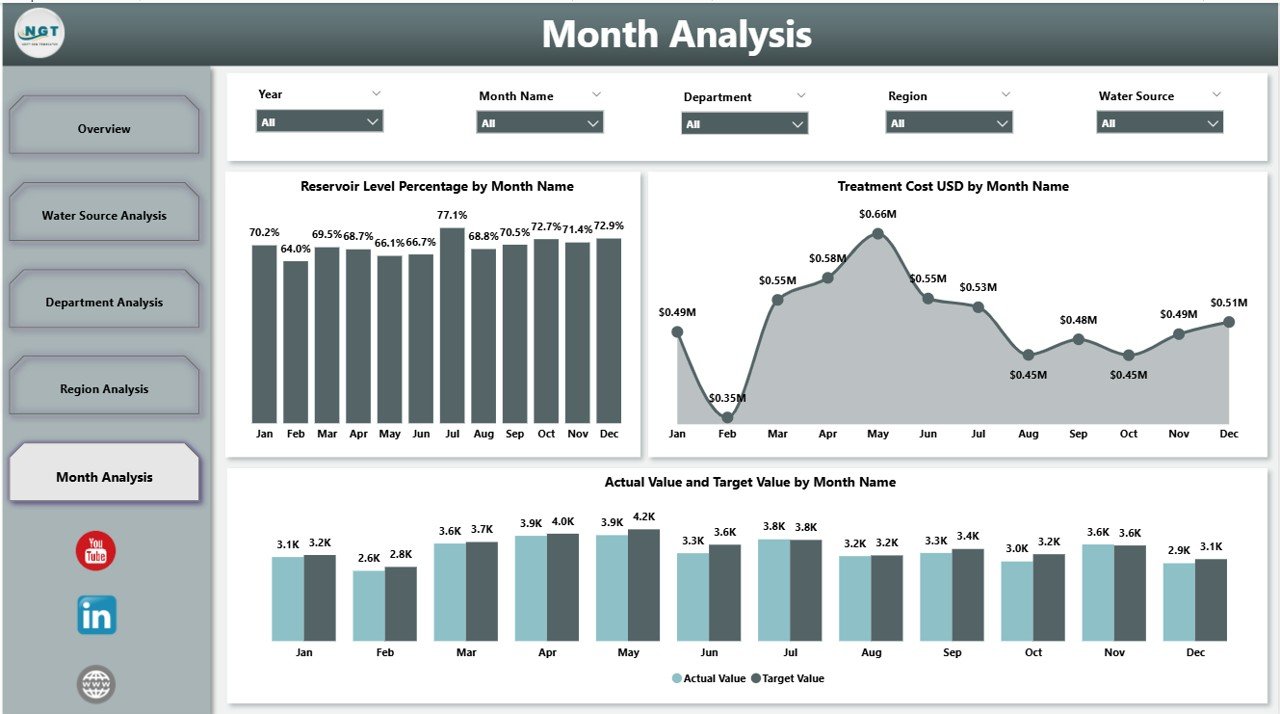
Water usage changes monthly due to climate and demand. Therefore, trend monitoring becomes essential.
The Month Analysis Page shows:
-
Actual Value vs Target Value by Month
-
Reservoir Level Percentage by Month
-
Treatment Cost by Month
Because of monthly tracking, planners can:
-
Forecast water demand
-
Manage seasonal shortages
-
Control cost spikes
For example, reservoir levels may drop in summer months. However, early detection helps authorities plan alternative supply.
Important KPIs for Water Resource Management
A powerful dashboard depends on the right KPIs. Below are essential metrics every water authority should track:
Operational KPIs
-
Total Water Production
-
Total Water Distribution
-
Leakage Percentage
-
Water Loss Rate
Financial KPIs
-
Treatment Cost (USD)
-
Cost per Cubic Meter
-
Budget Utilization Rate
Performance KPIs
-
Actual vs Target Achievement %
-
Previous Year Comparison
-
Department Efficiency Rate
Environmental KPIs
-
Reservoir Level Percentage
-
Water Quality Compliance Rate
-
Source Sustainability Index
Because these KPIs cover operations, finance, and environment, the dashboard delivers a complete performance view.
How Does Power BI Improve Water Resource Monitoring?
Power BI transforms raw data into clear visuals.
It offers:
-
Interactive slicers
-
Drill-through analysis
-
Real-time refresh
-
Dynamic comparisons
-
Automated calculations
Furthermore, users can export reports or share dashboards securely.
Therefore, organizations save time and improve transparency.
Advantages of Water Resource Management Dashboard in Power BI
Now let’s discuss why this dashboard adds strong value.
1. Real-Time Decision Making
Leaders can monitor leakage instantly. Therefore, they act faster.
2. Improved Cost Control
The dashboard highlights rising treatment cost. As a result, management controls spending.
3. Better Resource Allocation
Regional comparison helps planners distribute funds effectively.
4. Enhanced Transparency
Data visualization builds trust among stakeholders.
5. Performance Accountability
Department analysis improves accountability.
6. Seasonal Forecasting
Month analysis helps manage summer demand spikes.
Because of these benefits, organizations achieve smarter water governance.
Click to Purchases Water Resource Management Dashboard in Power BI
Best Practices for Water Resource Management Dashboard in Power BI
To maximize results, follow these best practices:
1. Define Clear KPIs
Select KPIs that match organizational goals.
2. Maintain Data Accuracy
Clean and validate data regularly.
3. Update Data Frequently
Schedule automatic refresh for updated insights.
4. Use Meaningful Visuals
Choose simple charts that users understand easily.
5. Monitor Leakage Closely
Leakage directly impacts cost and sustainability.
6. Train Staff
Educate departments on dashboard usage.
7. Review Performance Monthly
Monthly review ensures continuous improvement.
When organizations follow these practices, they unlock full dashboard potential.
How Can Water Authorities Implement This Dashboard?
Implementation becomes easy when you follow these steps:
-
Collect water data from departments
-
Structure data in Power BI model
-
Create relationships between tables
-
Design interactive visuals
-
Publish and share dashboard
-
Monitor and improve regularly
Therefore, even small utilities can adopt this system successfully.
Conclusion
Water resource management demands precision, speed, and accountability. However, manual reporting slows progress.
The Water Resource Management Dashboard in Power BI solves these challenges by providing interactive analysis across:
-
Departments
-
Regions
-
Water Sources
-
Months
Moreover, it improves cost control, leakage monitoring, and seasonal planning.
Therefore, if you want smarter water management, better transparency, and improved performance tracking, this dashboard provides the perfect solution.
Frequently Asked Questions (FAQs)
1. What is a Water Resource Management Dashboard in Power BI?
It is an interactive reporting tool that helps monitor water performance, leakage, treatment cost, and reservoir levels.
2. Who should use this dashboard?
Water utilities, municipalities, environmental agencies, and water treatment plants should use it.
3. Can we customize KPIs?
Yes. You can modify KPIs based on your organization’s goals.
4. Does Power BI support real-time updates?
Yes. Power BI supports scheduled and real-time data refresh.
5. How does the dashboard reduce water loss?
It identifies high-leakage areas quickly. Therefore, teams fix issues faster.
6. Can small municipalities use this dashboard?
Yes. Even small organizations can implement it easily.
7. Does it track previous year comparison?
Yes. The dashboard includes previous year value analysis.
8. Why is monthly analysis important?
Monthly analysis helps forecast demand and manage seasonal water shortages.
Visit our YouTube channel to learn step-by-step video tutorials