Laboratories run on accuracy, speed, and compliance. However, many labs still track instrument performance using scattered Excel files. As a result, managers struggle to monitor calibration schedules, downtime, utilization rates, and maintenance costs.
So, how do you track laboratory instrument KPIs in one centralized system?
The answer is simple.
You need a Laboratory Instruments KPI Dashboard in Excel.
This ready-to-use dashboard helps laboratory managers, quality teams, and operations heads track all critical KPIs in one place. Moreover, it converts raw instrument data into visual insights. Instead of manually calculating metrics every month, you can simply select a month and instantly view MTD and YTD performance.
In this detailed guide, you will learn:
-
What a Laboratory Instruments KPI Dashboard in Excel is
-
Why laboratories need it
-
A complete explanation of all 7 worksheets
-
Key KPIs you can track
-
Advantages of Laboratory Instruments KPI Dashboard in Excel
-
Best Practices for the Laboratory Instruments KPI Dashboard
-
Frequently Asked Questions with Answers
Let’s explore everything step by step.
Click to Purchases Laboratory Instruments KPI Dashboard in Excel
What Is a Laboratory Instruments KPI Dashboard in Excel?
A Laboratory Instruments KPI Dashboard in Excel is a ready-to-use performance monitoring tool built in Microsoft Excel. It helps laboratories track instrument efficiency, utilization, maintenance, downtime, and compliance metrics.
Instead of relying on manual reports, you can:
-
Monitor Monthly (MTD) performance
-
Track Year-to-Date (YTD) results
-
Compare Actual vs Target
-
Compare Current Year vs Previous Year
-
Identify underperforming KPIs instantly
Moreover, the dashboard uses dynamic drop-down selections and conditional formatting arrows. Therefore, you can quickly see whether performance improves or declines.
Why Do Laboratories Need a KPI Dashboard?
Laboratories operate in highly regulated environments. Therefore, instrument performance directly impacts test accuracy and turnaround time.
However, many labs face these challenges:
-
Frequent instrument breakdowns
-
Delayed calibration
-
Unplanned downtime
-
Rising maintenance costs
-
Poor asset utilization
-
Lack of trend visibility
As a result, decision-makers react too late.
A Laboratory Instruments KPI Dashboard solves these problems because it:
-
Centralizes all KPI data
-
Provides monthly and yearly comparisons
-
Highlights deviations immediately
-
Supports data-driven decisions
Furthermore, when you track KPIs consistently, you improve compliance and reduce operational risks.
Click to Purchases Laboratory Instruments KPI Dashboard in Excel
What Are the 7 Worksheets Inside the Laboratory Instruments KPI Dashboard?
This dashboard includes 7 structured worksheets. Each sheet serves a specific purpose.
Let’s understand them in detail.
1️⃣ What Is the Home Sheet?
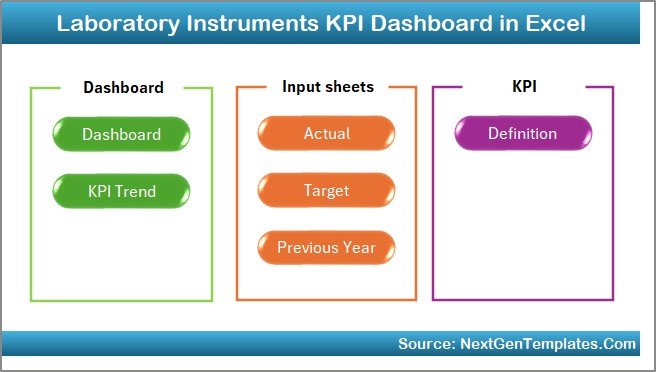
The Home Sheet acts as an index page.
Here, you get:
-
6 navigation buttons
-
Direct access to all major worksheets
-
Clean and user-friendly interface
Therefore, instead of scrolling across sheets, you can jump directly to the desired page.
This improves usability and saves time.
Click to Purchases Laboratory Instruments KPI Dashboard in Excel
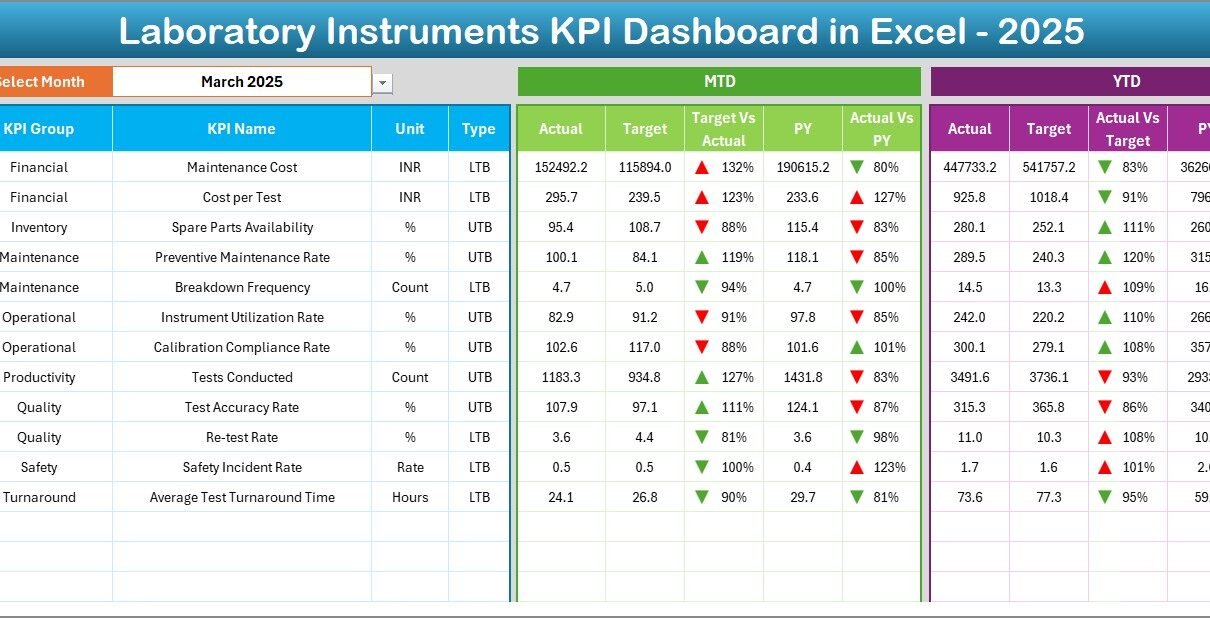
2️⃣ How Does the Main Dashboard Sheet Work?
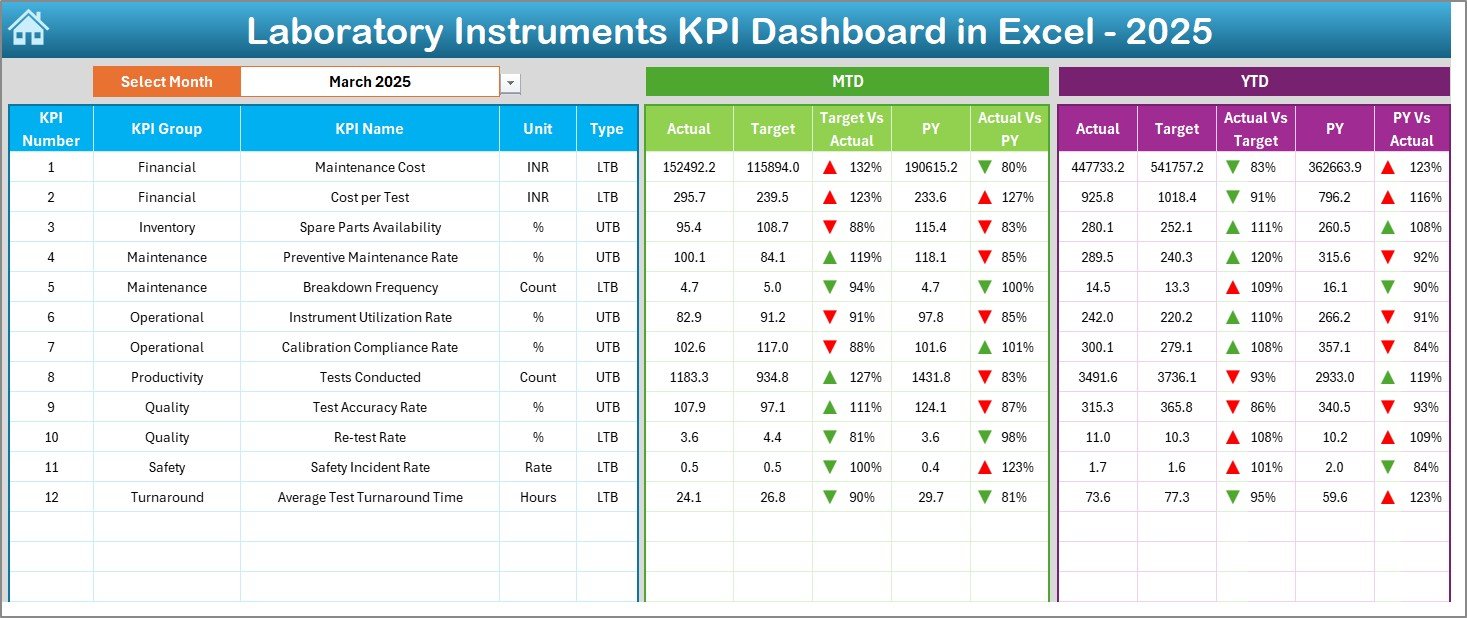
The Dashboard Sheet serves as the core of the entire system.
Month Selection
On cell D3, you can select the Month from a drop-down list. Once you select the month, the entire dashboard updates automatically.
This feature allows instant monthly comparison.
MTD Section Includes:
-
MTD Actual
-
MTD Target
-
MTD Previous Year
-
Target vs Actual comparison
-
PY vs Actual comparison
-
Conditional formatting arrows (Up/Down indicators)
YTD Section Includes:
-
YTD Actual
-
YTD Target
-
YTD Previous Year
-
Target vs Actual comparison
-
PY vs Actual comparison
-
Conditional formatting arrows
Therefore, you can instantly analyze both short-term and long-term performance.
Moreover, the visual arrows help you detect improvement or decline at a glance.
Click to Purchases Laboratory Instruments KPI Dashboard in Excel
3️⃣ What Is the KPI Trend Sheet?
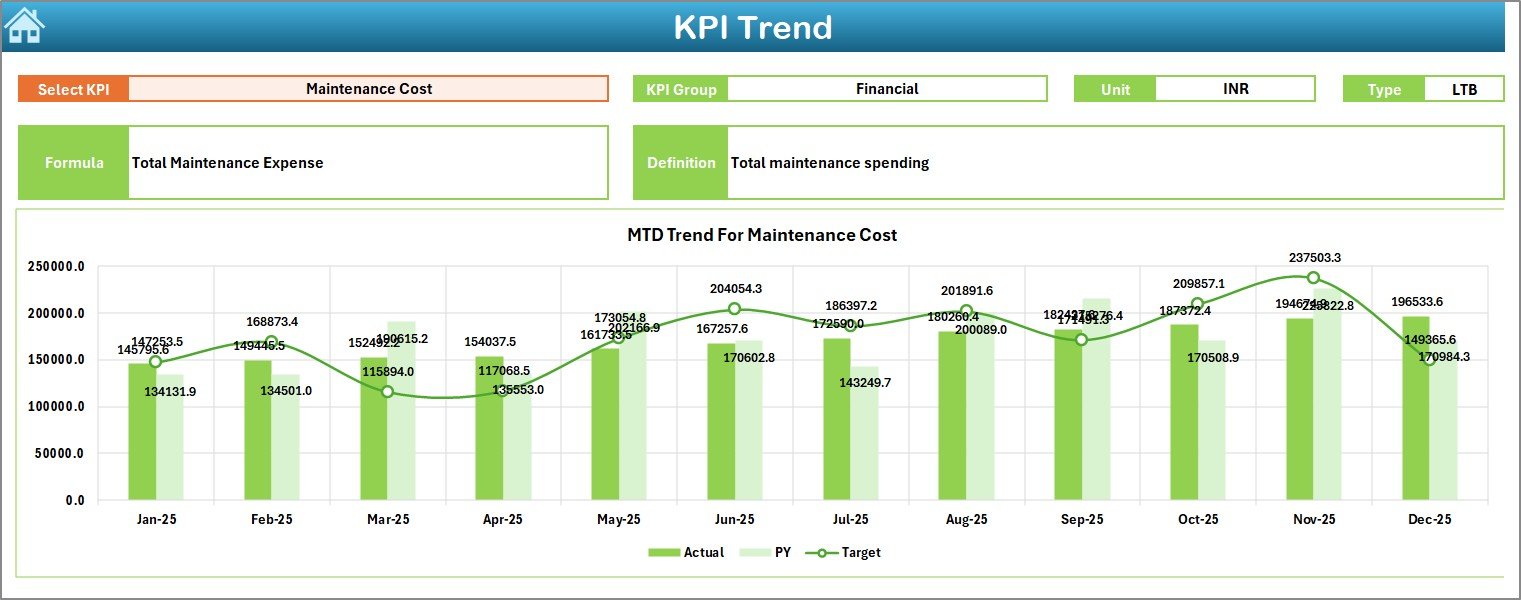
The KPI Trend Sheet provides detailed KPI-level analysis.
On cell C3, you can select a KPI Name from a drop-down.
Once selected, the sheet displays:
-
KPI Group
-
Unit of KPI
-
Type of KPI (Lower the Better / Upper the Better)
-
KPI Formula
-
KPI Definition
Additionally, it shows:
-
MTD Trend Chart (Actual, Target, PY)
-
YTD Trend Chart (Actual, Target, PY)
Therefore, you can study performance trends over time instead of viewing only summary numbers.
For example:
If instrument downtime increases for three consecutive months, the trend chart clearly highlights it. As a result, you can take preventive action quickly.
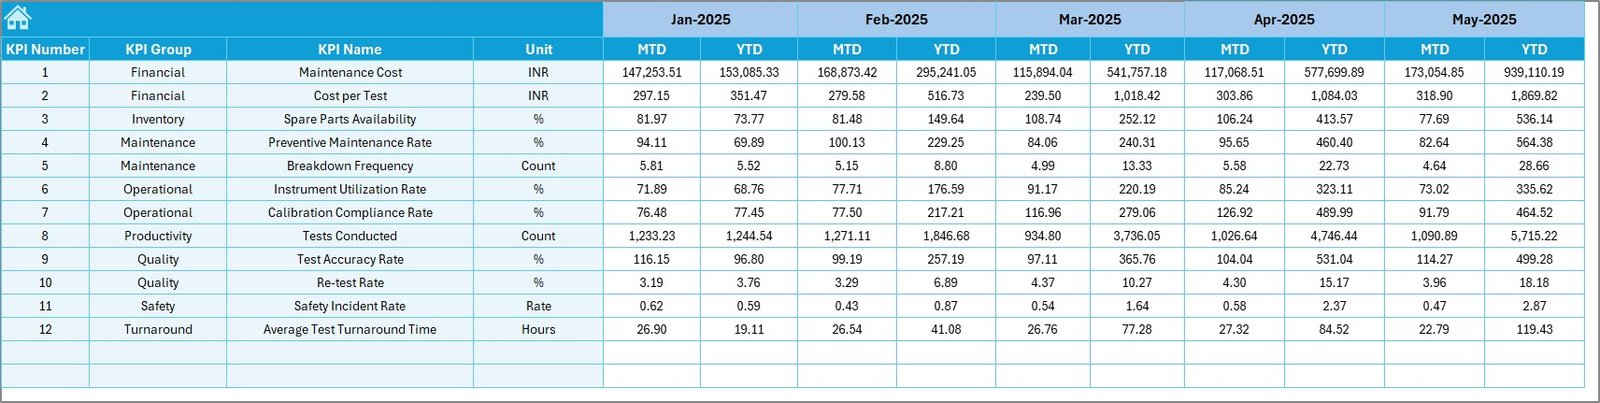
4️⃣ How Do You Enter Actual Numbers?
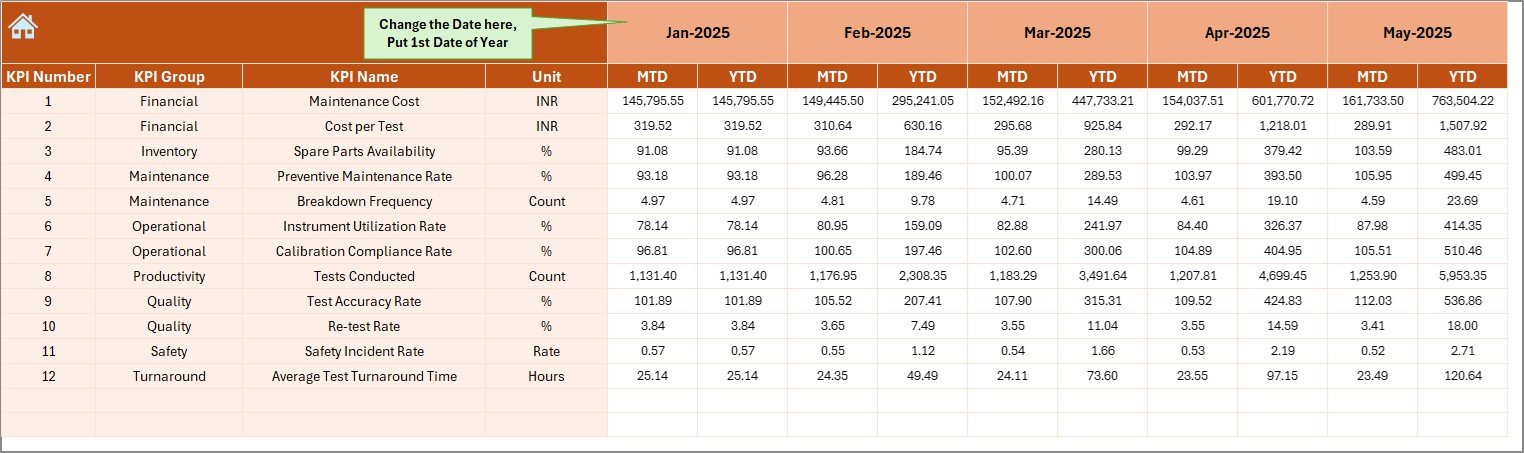
The Actual Numbers Input Sheet allows you to enter real performance data.
Key Features:
-
Change first month of the year in cell E1
-
Enter MTD and YTD actual numbers
-
Structured data entry format
Therefore, you can maintain clean and consistent data.
Moreover, once you update this sheet, the dashboard reflects changes automatically.
Click to Purchases Laboratory Instruments KPI Dashboard in Excel
5️⃣ What Is the Target Sheet?
The Target Sheet stores monthly targets for each KPI.
Here, you enter:
-
Monthly Target (MTD)
-
Year-to-Date Target (YTD)
Because you define targets clearly, you can measure performance accurately.
Furthermore, clear target tracking improves accountability.
6️⃣ How Does the Previous Year Sheet Help?
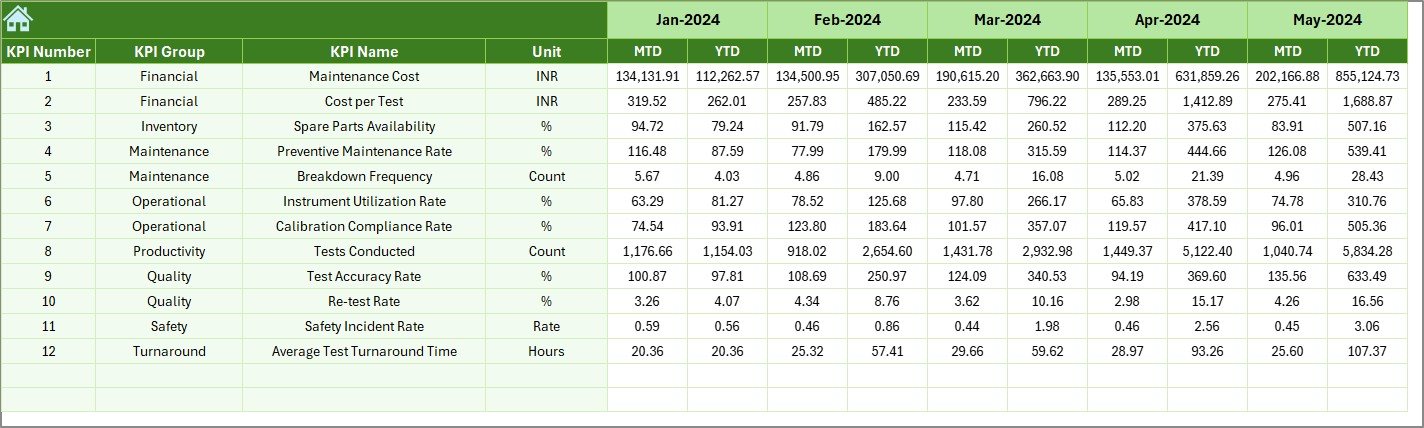
The Previous Year Numbers Sheet stores last year’s data.
You enter:
-
Previous Year MTD numbers
-
Previous Year YTD numbers
This comparison helps you:
-
Track year-over-year growth
-
Measure improvement
-
Detect performance decline
Therefore, instead of guessing, you rely on historical comparison.
Click to Purchases Laboratory Instruments KPI Dashboard in Excel
7️⃣ What Is the KPI Definition Sheet?
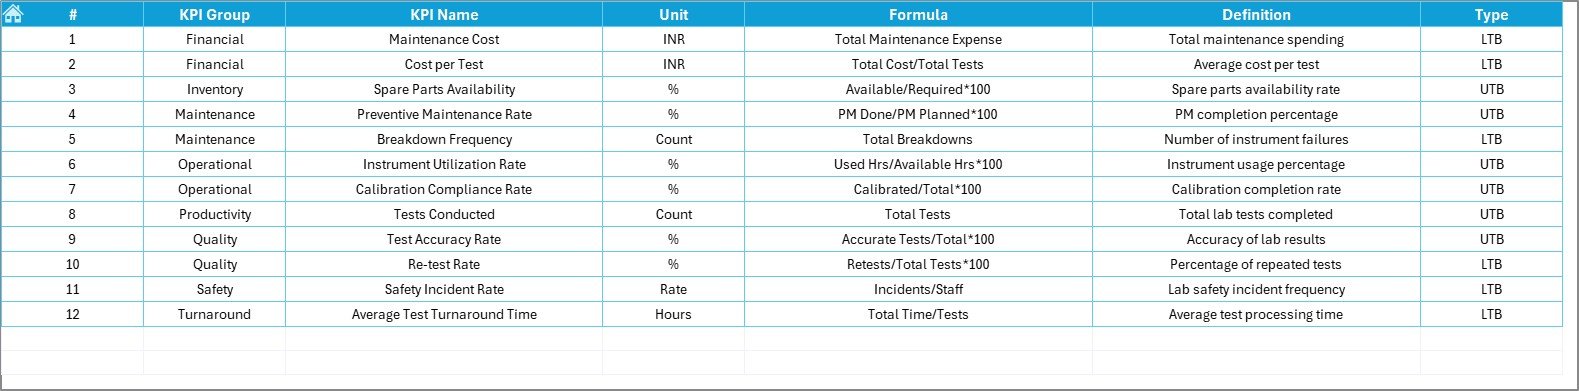
The KPI Definition Sheet forms the foundation of the dashboard.
Here, you define:
-
KPI Name
-
KPI Group
-
Unit
-
Formula
-
KPI Definition
Because you define KPIs clearly, your team avoids confusion.
Moreover, when auditors review performance reports, this sheet provides clarity and transparency.
Which KPIs Can You Track in a Laboratory Instruments Dashboard?
You can track many lab-related KPIs, such as:
-
Instrument Utilization Rate (%)
-
Downtime Hours
-
Calibration Compliance Rate (%)
-
Preventive Maintenance Completion (%)
-
Breakdown Frequency
-
Average Repair Time
-
Cost per Test
-
Equipment Availability (%)
-
Error Rate (%)
-
Rework Rate
For example:
If equipment availability drops below 95%, you can investigate immediately. Therefore, you avoid delays in test processing.
Advantages of Laboratory Instruments KPI Dashboard in Excel
Now, let’s explore the major benefits.
1️⃣ Centralized Monitoring
You store all KPI data in one file. Therefore, you avoid multiple spreadsheets.
2️⃣ Real-Time Monthly Comparison
You select a month, and numbers update instantly.
3️⃣ Clear Visual Indicators
Up and down arrows help you detect performance direction quickly.
4️⃣ Trend Visibility
Trend charts help you analyze patterns over time.
5️⃣ Improved Decision Making
Because you see accurate data, you make faster decisions.
6️⃣ Better Compliance Tracking
You monitor calibration and maintenance metrics consistently.
7️⃣ Cost Control
You identify rising maintenance costs early.
8️⃣ Easy Customization
Since Excel offers flexibility, you can add more KPIs anytime.
Click to Purchases Laboratory Instruments KPI Dashboard in Excel
Best Practices for the Laboratory Instruments KPI Dashboard
To get maximum value, follow these best practices.
1️⃣ Update Data Monthly
Enter actual numbers at the end of every month.
2️⃣ Define Clear KPIs
Always define formulas and units clearly in the KPI Definition sheet.
3️⃣ Review Trends Regularly
Do not rely only on summary numbers. Always analyze trend charts.
4️⃣ Set Realistic Targets
Avoid unrealistic targets because they distort performance evaluation.
5️⃣ Monitor Both MTD and YTD
MTD shows short-term results. YTD shows long-term direction.
6️⃣ Validate Data Accuracy
Always double-check data before entering it.
7️⃣ Train Your Team
Ensure your team understands KPI definitions and interpretation.
How Does This Dashboard Improve Laboratory Efficiency?
This dashboard improves efficiency because:
-
It reduces manual calculation time
-
It improves transparency
-
It encourages accountability
-
It highlights risks early
-
It supports preventive maintenance planning
For example:
If preventive maintenance completion drops below 90%, you can assign tasks immediately. Therefore, you reduce unexpected breakdowns.
Who Can Benefit from This Dashboard?
This dashboard benefits:
-
Laboratory Managers
-
Quality Control Teams
-
Hospital Diagnostic Centers
-
Research Laboratories
-
Pharmaceutical Labs
-
Equipment Maintenance Teams
Moreover, any organization that uses lab instruments can adapt this dashboard easily.
Conclusion
Laboratory performance depends heavily on instrument reliability and efficiency. However, manual tracking creates errors and delays.
The Laboratory Instruments KPI Dashboard in Excel solves this problem effectively. It centralizes KPI data, provides instant comparisons, and highlights trends clearly.
Furthermore, it empowers laboratory managers to take proactive decisions instead of reactive actions.
If you want structured monitoring, improved compliance, and better efficiency, this dashboard offers a practical solution.
Click to Purchases Laboratory Instruments KPI Dashboard in Excel
Frequently Asked Questions with Answers
1️⃣ What software do I need to use this dashboard?
You only need Microsoft Excel.
2️⃣ Can I add more KPIs?
Yes. You can add new KPIs in the KPI Definition sheet and update related data.
3️⃣ Does the dashboard update automatically?
Yes. Once you enter data in input sheets and select a month, the dashboard updates automatically.
4️⃣ Can I customize the month selection?
Yes. You can modify the drop-down list based on your financial year.
5️⃣ Is this dashboard suitable for small laboratories?
Yes. Both small and large laboratories can use it effectively.
6️⃣ How often should I update the dashboard?
You should update it monthly. However, you can update it weekly if required.
Click to Purchases Laboratory Instruments KPI Dashboard in Excel
Visit our YouTube channel to learn step-by-step video tutorials