Waste management plays a critical role in every modern city. Cities generate tons of waste daily. Municipal teams collect garbage from residential areas, commercial buildings, and industrial zones. However, without proper tracking, costs increase, fuel usage rises, and service quality drops.
So, how can waste management companies monitor operations efficiently?
The answer is simple.
You need a Waste Management Dashboard in Power BI.
Click to Purchases Waste Management Dashboard in Power BI
This powerful dashboard helps organizations track operating costs, vehicle usage, fuel consumption, labor expenses, service ratings, and monthly trends — all in one interactive system. Instead of juggling multiple spreadsheets, managers can analyze real-time data and make faster decisions.
In this complete guide, you will learn:
-
What a Waste Management Dashboard in Power BI is
-
Why waste management companies need it
-
Detailed explanation of all 5 dashboard pages
-
Advantages of using this dashboard
-
Best practices for implementation
-
Frequently Asked Questions with answers
Let us explore everything step by step.
What Is a Waste Management Dashboard in Power BI?
A Waste Management Dashboard in Power BI is an interactive data visualization system designed for waste collection companies, municipalities, and environmental service providers.
It converts raw operational data into clear visual insights. Instead of analyzing scattered reports, managers can:
-
Track Total Operating Cost
-
Monitor Fuel and Maintenance Costs
-
Evaluate Service Ratings
-
Analyze Collection Team Performance
-
Review Monthly Trends
-
Compare Waste Types and Zones
Moreover, Power BI allows you to use slicers (filters) so users can drill down by region, waste type, zone, team, or month. As a result, decision-makers get instant clarity.
Why Do Waste Management Companies Need a Power BI Dashboard?
Waste management operations involve multiple moving parts. Vehicles travel across cities. Teams collect waste daily. Fuel prices fluctuate. Maintenance costs increase. Therefore, without structured monitoring, inefficiencies grow quickly.
However, when companies use a dashboard:
-
They reduce operational waste
-
They improve route planning
-
They control fuel expenses
-
They enhance service quality
-
They increase accountability
Furthermore, real-time data allows managers to take corrective action immediately. Instead of waiting for monthly reports, they can identify problems instantly.
Key Features of Waste Management Dashboard in Power BI
This dashboard includes 5 fully interactive pages inside the Power BI desktop application. Each page focuses on a specific operational area. Together, they provide a complete performance overview.
Let us examine each page in detail.
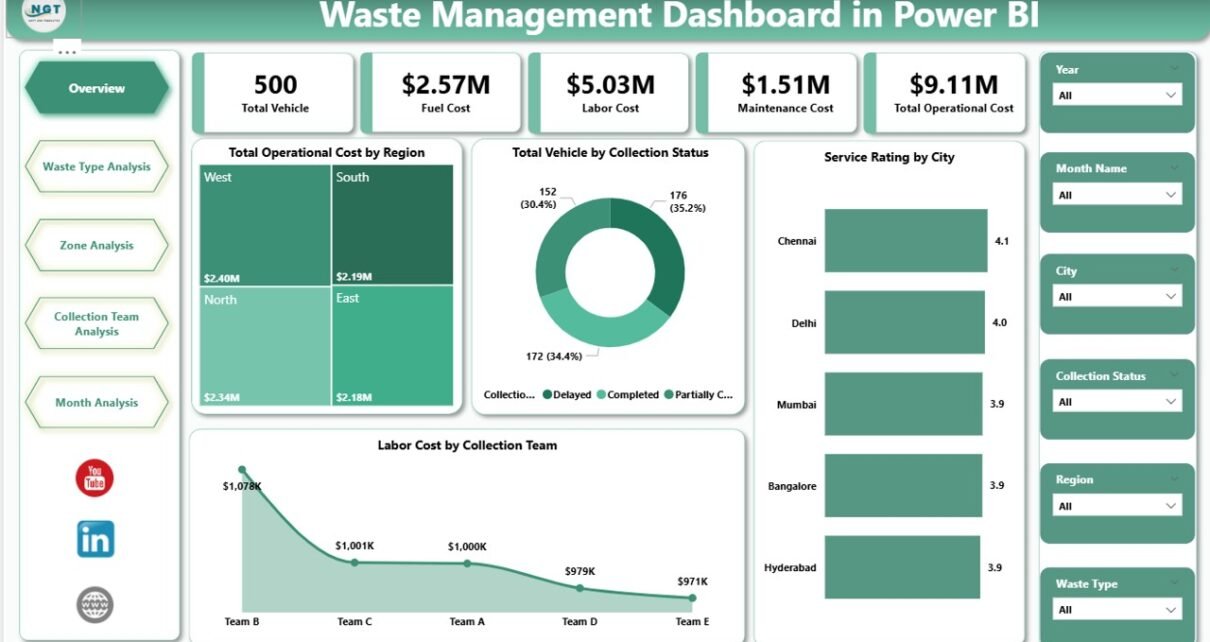
1. Overview Page – How Is Overall Performance?
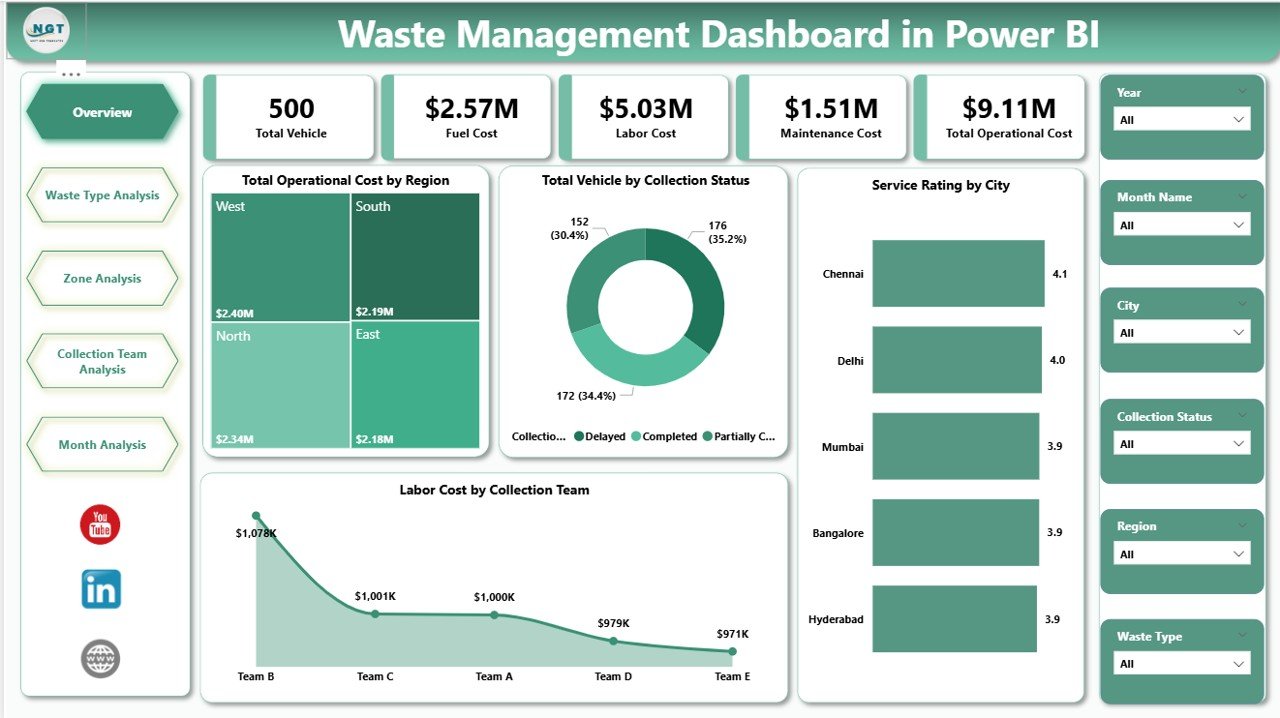
The Overview Page serves as the main control center of the dashboard.
Key Cards Displayed:
-
Total Operating Cost by Region
-
Total Vehicles by Collection Status
-
Service Rating by City
-
Labor Cost by Collection Team
What Insights Can You Get?
First, managers can analyze which region spends the most on operations. If one region shows unusually high costs, they can investigate fuel usage, vehicle breakdowns, or staffing issues.
Second, they can monitor collection status. For example:
-
Active Vehicles
-
Under Maintenance
-
Inactive Units
This visibility improves asset management.
Moreover, the Service Rating by City helps identify performance gaps. If one city receives lower ratings, management can review route efficiency or team behavior.
Finally, labor cost tracking helps control workforce expenses. If one team consumes more labor cost than expected, managers can rebalance assignments.
Therefore, the Overview page provides a quick yet powerful operational snapshot.
2. Waste Type Analysis – Which Waste Category Costs More?
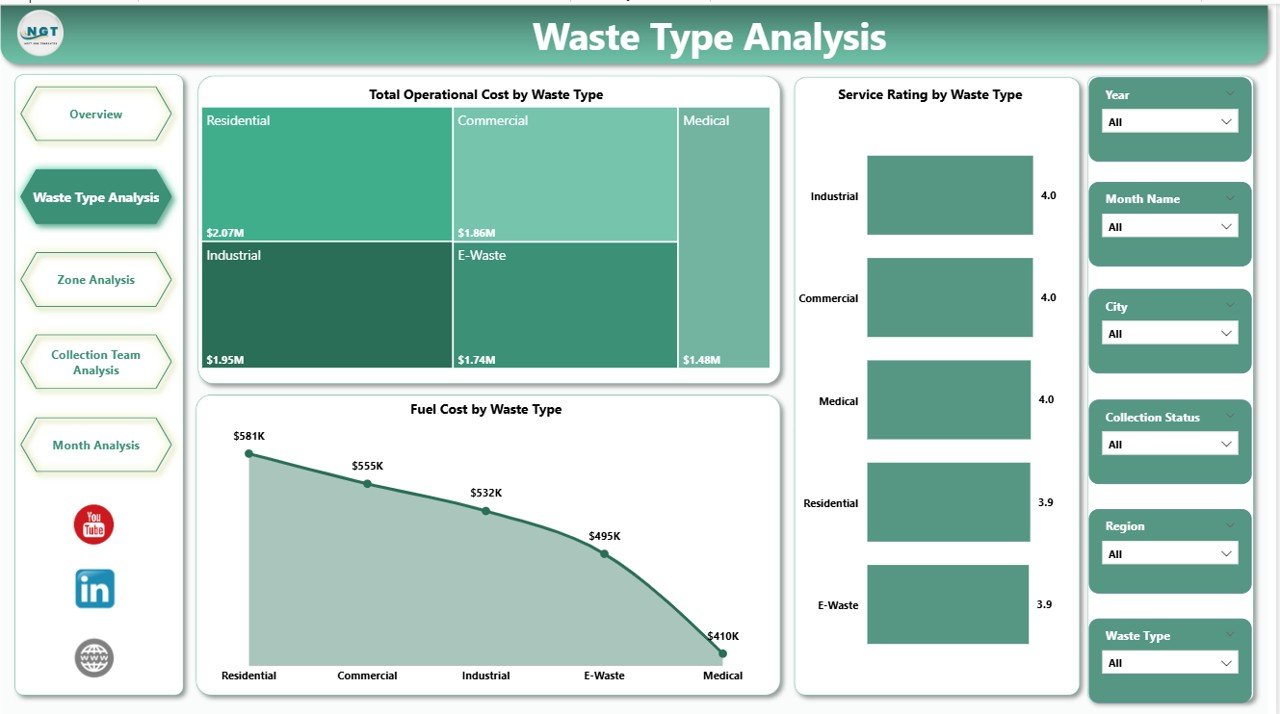
Waste collection involves multiple categories such as:
-
Organic Waste
-
Plastic Waste
-
Metal Waste
-
E-Waste
-
Hazardous Waste
The Waste Type Analysis Page focuses on cost and service efficiency across waste types.
Charts Included:
-
Total Operating Cost by Waste Type
-
Service Rating by Waste Type
-
Fuel Cost by Waste Type
Why Is This Important?
Different waste types require different handling methods. For example, hazardous waste demands special vehicles and trained staff. Therefore, costs vary.
This page allows managers to:
-
Compare operating cost across waste categories
-
Identify high fuel-consuming waste types
-
Monitor service quality variations
If plastic waste shows high fuel costs, managers can optimize routes. Similarly, if organic waste receives low service ratings, supervisors can improve handling processes.
Thus, this page drives cost optimization and quality improvement.
3. Zone Analysis – Which Area Performs Better?
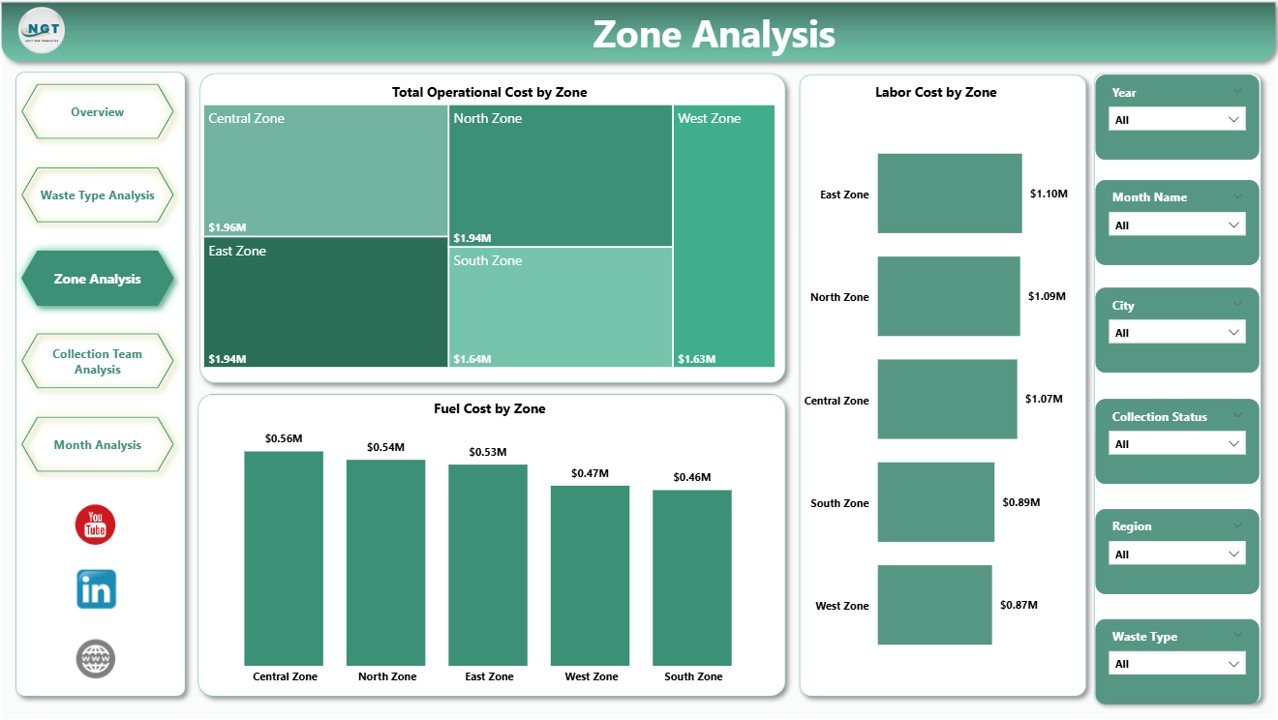
Waste collection operations often divide cities into zones such as:
-
North Zone
-
South Zone
-
East Zone
-
West Zone
The Zone Analysis Page highlights regional performance differences.
Charts Included:
-
Total Operating Cost by Zone
-
Fuel Cost by Zone
-
Labor Cost by Zone
What Can Managers Discover?
First, managers can compare zones side by side. If one zone shows higher fuel cost, it may indicate longer routes or traffic congestion.
Second, labor cost analysis helps identify overstaffing or understaffing issues.
Moreover, managers can evaluate whether specific zones require additional vehicles or route redesign.
Consequently, zone-level analysis enhances strategic planning.
4. Collection Team Analysis – Which Team Performs Best?

Every waste management company operates through multiple collection teams. Each team handles specific routes and schedules.
The Collection Team Analysis Page measures team performance directly.
Charts Included:
-
Total Operating Cost by Collection Team
-
Fuel Cost by Collection Team
-
Service Rating by Collection Team
How Does This Help?
This page increases accountability.
Managers can:
-
Identify high-performing teams
-
Reward efficient teams
-
Support underperforming teams
-
Optimize resource allocation
If one team maintains low cost and high ratings, management can replicate their strategies across other teams.
Therefore, team-level insights boost productivity and morale.
5. Month Analysis – How Do Costs Change Over Time?
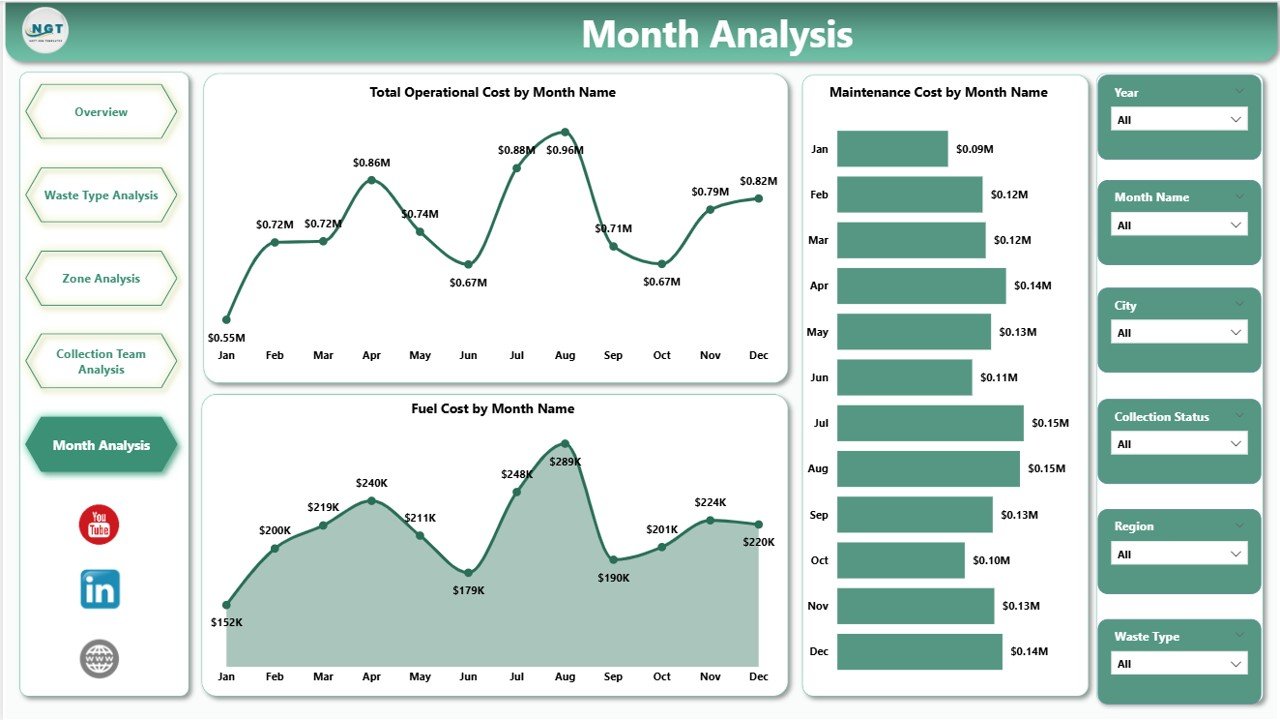
Seasonal factors affect waste collection. For example:
-
Festivals increase waste volume
-
Fuel prices fluctuate
-
Weather impacts vehicle maintenance
The Month Analysis Page tracks performance over time.
Charts Included:
-
Total Operating Cost by Month
-
Fuel Cost by Month
-
Maintenance Cost by Month
Why Does Monthly Tracking Matter?
Click to Purchases Waste Management Dashboard in Power BI
Monthly analysis helps detect trends.
For example:
-
If fuel cost rises steadily, managers can renegotiate contracts.
-
If maintenance cost spikes during rainy months, they can improve preventive maintenance.
Thus, month-wise tracking supports long-term financial planning.
Advantages of Waste Management Dashboard in Power BI
Now let us discuss the major benefits of this dashboard.
1. Real-Time Decision Making
Managers access updated insights instantly. Therefore, they respond quickly to operational issues.
2. Improved Cost Control
The dashboard highlights fuel, labor, and maintenance expenses. Consequently, companies reduce unnecessary spending.
3. Better Resource Allocation
Zone and team comparisons allow smarter vehicle and workforce distribution.
4. Increased Accountability
Team-level analysis creates transparency. As a result, performance improves.
5. Enhanced Service Quality
Service ratings by city and waste type reveal customer satisfaction gaps.
6. Data-Driven Strategy
Instead of guessing, leaders rely on facts and trends.
Best Practices for the Waste Management Dashboard in Power BI
To maximize value, companies should follow these best practices:
1. Maintain Clean Data
Always update accurate and structured data. Incorrect inputs lead to misleading insights.
2. Use Standard KPIs
Define clear metrics such as:
-
Cost per Ton
-
Fuel per Kilometer
-
Average Service Rating
-
Cost per Vehicle
3. Review Dashboard Weekly
Although data updates daily, managers should conduct weekly performance reviews.
4. Set Performance Targets
Define cost and service benchmarks. Then compare actual performance against targets.
5. Train Your Team
Ensure supervisors understand how to use slicers and filters effectively.
6. Integrate with GPS Systems
Link vehicle tracking data to improve route optimization.
Click to Purchases Waste Management Dashboard in Power BI
How Can This Dashboard Transform Waste Management Operations?
When companies adopt structured analytics, operations improve significantly.
For example:
-
Fuel waste decreases by up to 10–20%
-
Route efficiency improves
-
Maintenance planning becomes proactive
-
Customer complaints reduce
Moreover, transparent data builds trust among stakeholders.
Therefore, this dashboard does not just display numbers — it transforms strategy.
Who Should Use This Dashboard?
This dashboard suits:
-
Municipal Corporations
-
Private Waste Collection Companies
-
Environmental Service Providers
-
Facility Management Firms
-
Recycling Companies
Additionally, consultants can use it to provide analytical insights to clients.
Conclusion
Waste management operations demand precision, cost control, and service excellence. However, manual reporting limits visibility and slows decision-making.
The Waste Management Dashboard in Power BI solves this problem effectively. It centralizes operational data, visualizes performance clearly, and enables smarter decisions.
With five structured pages — Overview, Waste Type Analysis, Zone Analysis, Collection Team Analysis, and Month Analysis — this dashboard delivers complete operational transparency.
Therefore, if you want to reduce cost, improve efficiency, and enhance service quality, you should implement this dashboard today.
Frequently Asked Questions (FAQs)
1. What is the main purpose of a Waste Management Dashboard in Power BI?
The dashboard helps track operational cost, fuel consumption, labor expenses, vehicle performance, and service ratings in one centralized system.
2. Can small waste management companies use this dashboard?
Yes. Both small and large companies can use it. Moreover, Power BI allows easy customization based on data size.
3. How often should companies update the data?
Companies should update data daily or weekly for accurate analysis.
4. Does this dashboard support real-time monitoring?
Click to Purchases Waste Management Dashboard in Power BI
Yes, when integrated with live data sources, Power BI supports real-time monitoring.
5. Can managers track individual team performance?
Yes. The Collection Team Analysis page specifically tracks team-level performance metrics.
6. Why is monthly analysis important?
Monthly tracking identifies trends, seasonal impacts, and cost fluctuations. Therefore, it supports better financial planning.
Visit our YouTube channel to learn step-by-step video tutorials