Running a tattoo studio requires more than artistic talent. You must track appointments, revenue, customer satisfaction, artist productivity, and operational efficiency. However, many tattoo parlors still rely on scattered spreadsheets or manual records. As a result, owners struggle to see the full business picture.
So, how can tattoo studio owners monitor performance in one centralized, professional, and easy-to-use system?
The answer is simple.
You need a Tattoo Parlors KPI Dashboard in Excel.
Click to Purchases Tattoo Parlors KPI Dashboard in Excel
This ready-to-use Excel dashboard helps tattoo studio owners, managers, and business analysts track key performance indicators (KPIs) in real time. Moreover, it transforms raw data into meaningful insights. Therefore, you can make faster and smarter business decisions.
In this detailed guide, you will learn everything about the Tattoo Parlors KPI Dashboard in Excel — including features, benefits, best practices, and frequently asked questions.
What Is a Tattoo Parlors KPI Dashboard in Excel?
A Tattoo Parlors KPI Dashboard in Excel is a structured performance monitoring tool built inside Microsoft Excel. It allows tattoo businesses to track, analyze, and visualize important KPIs such as:
-
Revenue per artist
-
Appointment utilization
-
Customer satisfaction
-
Repeat client rate
-
Average tattoo value
-
Artist productivity
Instead of checking multiple files, you can monitor your entire studio performance from one interactive dashboard.
Most importantly, the dashboard updates automatically when you enter new data. As a result, you always see the latest performance snapshot.
Why Do Tattoo Studios Need a KPI Dashboard?
Tattoo businesses operate in a fast-moving environment. Therefore, manual tracking often creates delays and errors.
Here is why a KPI dashboard becomes essential:
-
You gain real-time visibility into studio performance
-
You identify underperforming artists quickly
-
You monitor monthly revenue trends
-
You improve appointment planning
-
You enhance customer retention strategies
-
You make data-driven decisions confidently
Without a structured dashboard, tattoo studio owners often rely on guesswork. However, with this Excel solution, you work with facts and numbers.
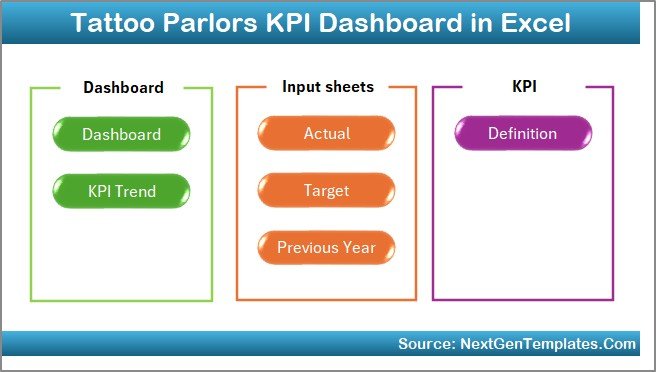
Key Features of the Tattoo Parlors KPI Dashboard in Excel
In this template, we have designed 7 powerful worksheets to give you complete analytical control. Let us explore each sheet in detail.
1️⃣ Home Sheet – Your Navigation Hub
The Home sheet works as the central index page. It improves user experience and saves time.
Key highlights:
-
Clean and professional layout
-
Six interactive navigation buttons
-
One-click jump to any worksheet
-
User-friendly design
Because of this structure, even non-technical users can operate the dashboard easily.
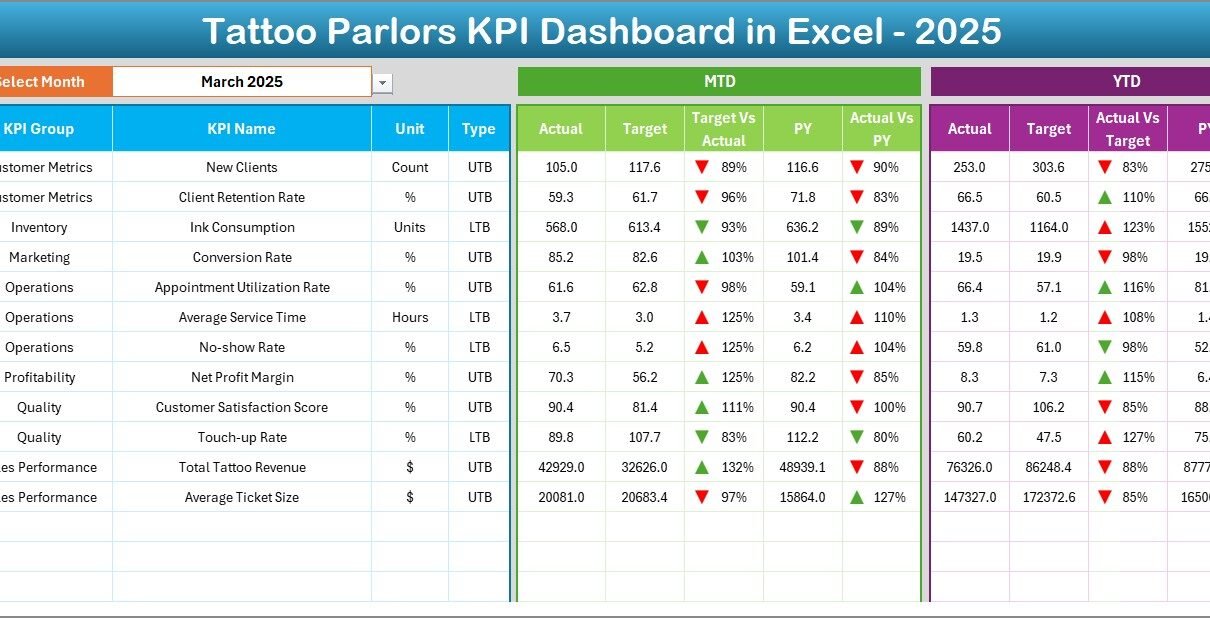
2️⃣ Dashboard Sheet – The Main Performance Overview
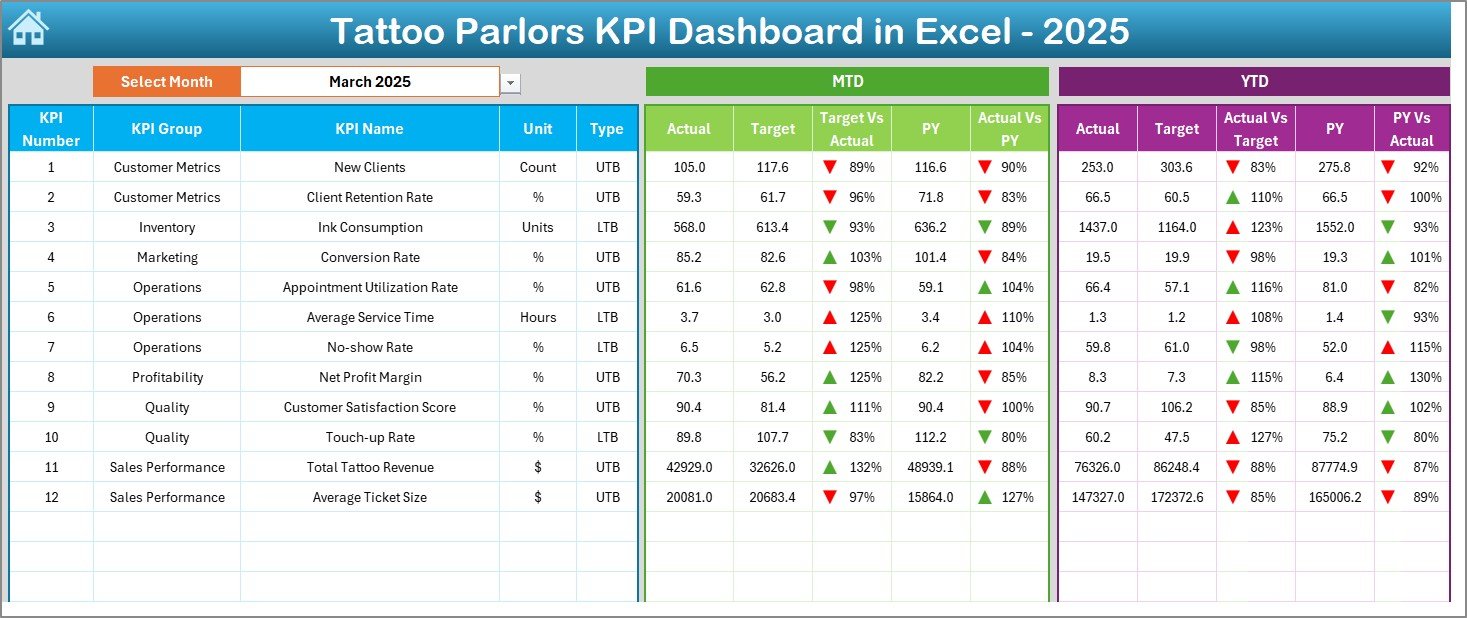
The Dashboard sheet acts as the heart of the Tattoo Parlors KPI Dashboard in Excel.
Here, you can monitor all KPIs in one consolidated view.
Smart Month Selection
At cell D3, you can select the desired month from the dropdown. Once you change the month:
Click to Purchases Tattoo Parlors KPI Dashboard in Excel
-
All KPI numbers update automatically
-
Charts refresh instantly
-
Variance indicators adjust dynamically
Therefore, monthly analysis becomes fast and effortless.
What Metrics Does the Dashboard Show?
The dashboard displays both MTD (Month-to-Date) and YTD (Year-to-Date) performance.
MTD Section Includes:
-
MTD Actual
-
MTD Target
-
Previous Year (MTD)
-
Target vs Actual variance
-
Previous Year vs Actual variance
-
Conditional formatting arrows
YTD Section Includes:
-
YTD Actual
-
YTD Target
-
Previous Year (YTD)
-
Target vs Actual comparison
-
PY vs Actual comparison
-
Dynamic visual indicators
Because of these elements, you can quickly identify performance gaps.
Visual Intelligence with Conditional Formatting
The dashboard uses smart visual signals:
-
🔼 Up arrows for positive performance
-
🔽 Down arrows for negative performance
-
Traffic-light style indicators
-
Color-coded variance highlights
As a result, decision-makers can interpret performance within seconds.
3️⃣ KPI Trend Sheet – Deep Performance Analysis
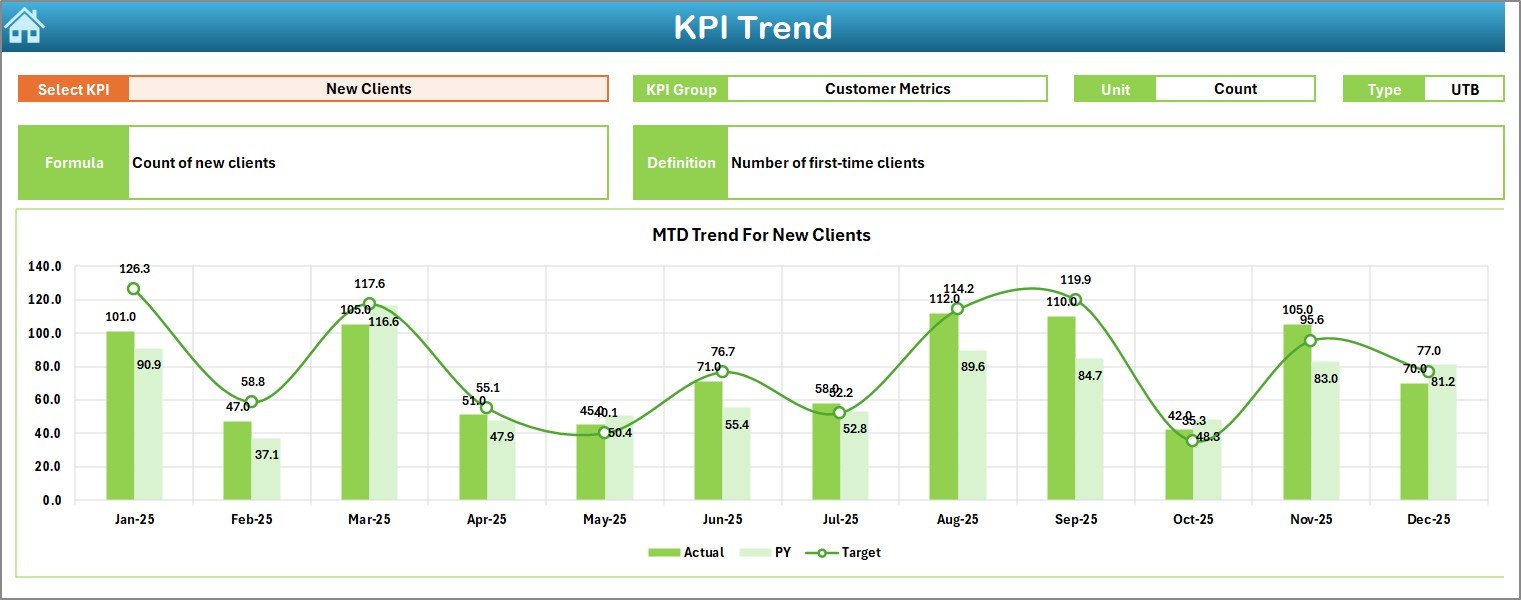
The KPI Trend sheet provides detailed analytical insights for individual KPIs.
Dynamic KPI Selection
At cell C3, you can select any KPI from the dropdown list.
Immediately, the dashboard displays:
-
KPI Group
-
Unit of measurement
-
KPI Type (LTB or UTB)
-
Formula
-
KPI definition
Therefore, users always understand what each KPI represents.
Click to Purchases Tattoo Parlors KPI Dashboard in Excel
Trend Charts for Better Insights
This sheet also shows:
-
MTD trend chart (Actual vs Target vs PY)
-
YTD trend chart (Actual vs Target vs PY)
Because of these charts, you can:
-
Track performance patterns
-
Identify seasonal trends
-
Detect early warning signals
-
Monitor growth trajectory
In short, this sheet transforms raw numbers into meaningful stories.
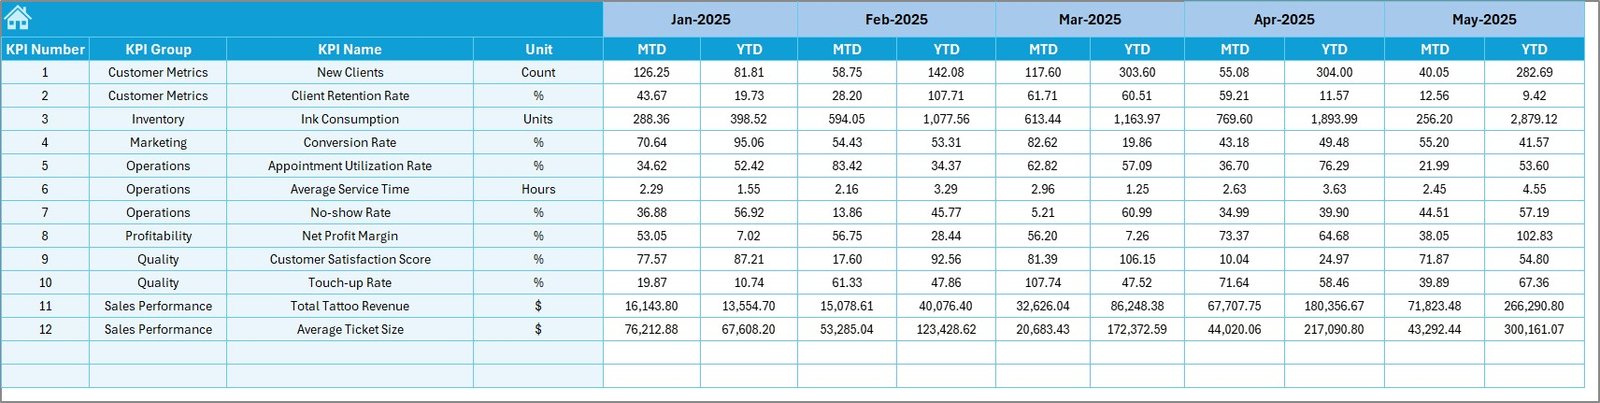
4️⃣ Actual Numbers Input Sheet – Data Entry Made Simple
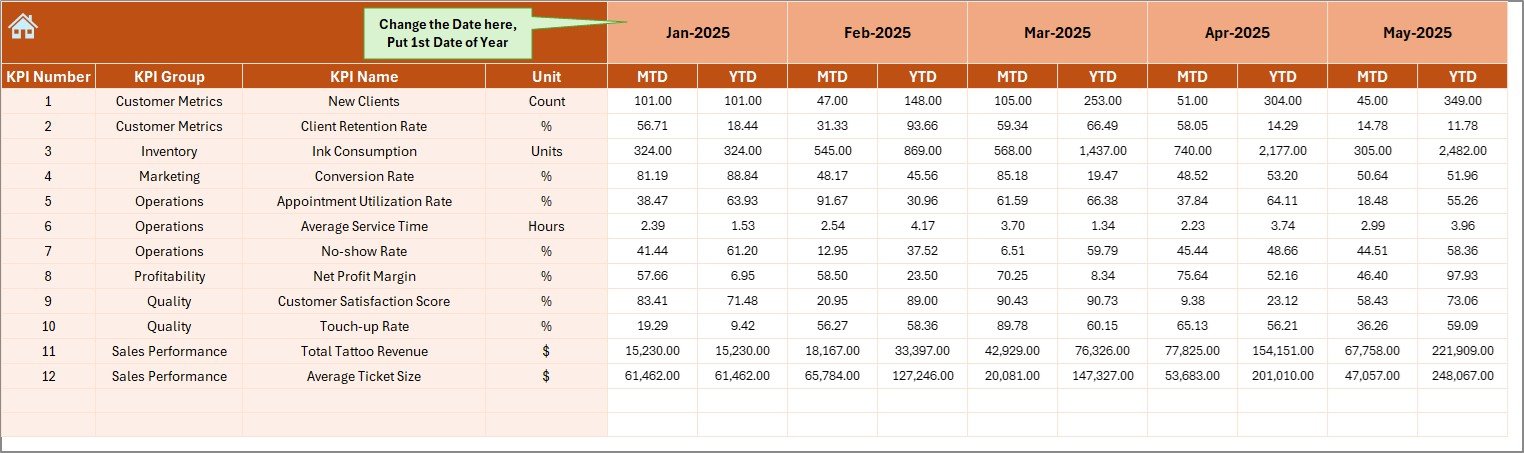
The Actual Numbers Input sheet serves as the primary data entry area.
Flexible Month Control
At cell E1, you can define the first month of the financial year. After that:
-
The entire model aligns automatically
-
Monthly calculations adjust correctly
-
Time-based analysis remains accurate
What Do You Enter Here?
You only need to input:
-
Monthly MTD actual values
-
YTD actual values
Because the template handles calculations automatically, data entry remains simple and fast.
5️⃣ Target Sheet – Performance Benchmark Setup
The Target sheet allows you to define performance goals for each KPI.
Here, you enter:
-
Monthly MTD targets
-
Monthly YTD targets
Once you update targets, the dashboard instantly recalculates variances.
Therefore, management can always compare actual performance against goals.
6️⃣ Previous Year Numbers Sheet – Historical Comparison
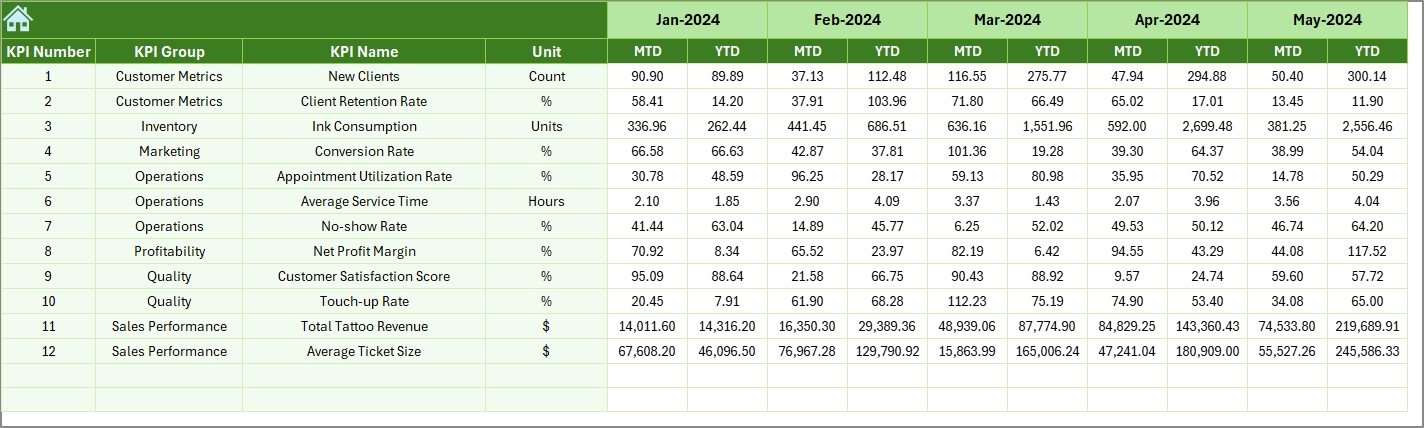
The Previous Year sheet helps you perform year-over-year analysis.
You must enter prior year data in the same structure as the current year.
Why This Matters
Year-over-year comparison helps you:
-
Measure true business growth
-
Identify seasonal patterns
-
Evaluate marketing effectiveness
-
Track long-term improvement
Because of this feature, your analysis becomes much more powerful.
Click to Purchases Tattoo Parlors KPI Dashboard in Excel
7️⃣ KPI Definition Sheet – The KPI Dictionary
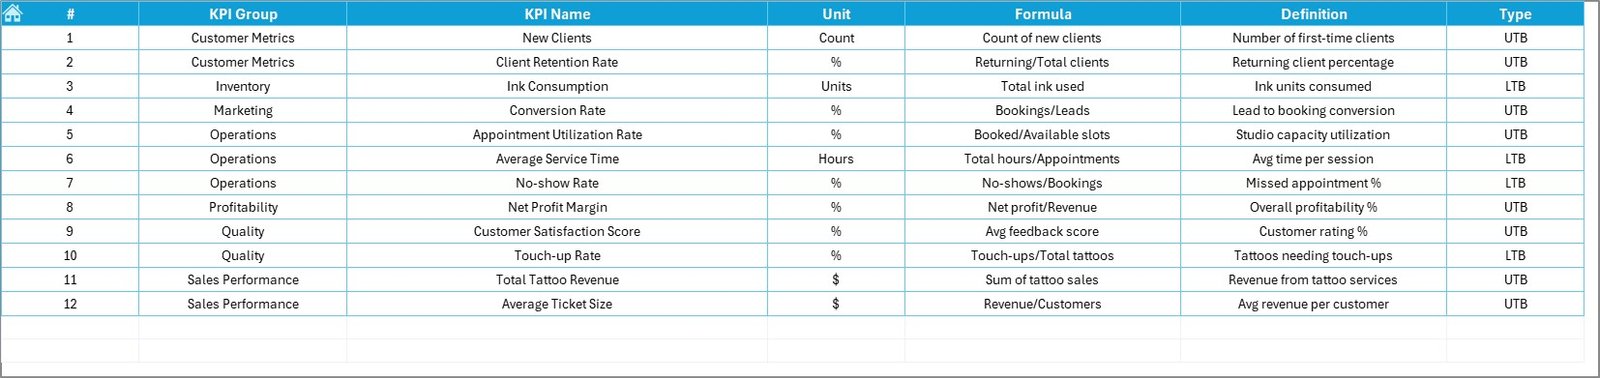
The KPI Definition sheet works as the brain of the entire dashboard.
Here, you maintain:
-
KPI Name
-
KPI Group
-
Unit
-
Formula
-
Definition
-
KPI Type (LTB or UTB)
This structured approach ensures consistency across the dashboard.
Moreover, new users can quickly understand every metric.
What KPIs Should Tattoo Parlors Track?
To maximize value, tattoo studios should monitor the following KPIs:
-
Total monthly revenue
-
Average tattoo value
-
Artist utilization rate
-
Appointment completion rate
-
Customer repeat rate
-
Walk-in conversion rate
-
Cancellation rate
-
Customer satisfaction score
-
Revenue per artist
-
Average session duration
When you track these metrics regularly, you gain full operational visibility.
Advantages of Tattoo Parlors KPI Dashboard in Excel
Implementing this dashboard offers multiple business benefits.
🚀 Improved Business Visibility
-
You see complete studio performance in one place
-
You identify trends instantly
-
You monitor monthly progress clearly
📊 Faster Decision-Making
-
You detect problems early
-
You act on data, not assumptions
-
You improve strategic planning
💰 Better Revenue Control
-
You track artist productivity
-
You monitor high-value services
-
You optimize pricing strategy
🎯 Goal Tracking Made Easy
-
You compare actual vs target automatically
-
You monitor YTD progress continuously
-
You keep teams accountable
🧠 Easy to Use
-
No advanced software required
-
Works inside Microsoft Excel
-
User-friendly navigation
Because of these advantages, tattoo studio owners can run their business more professionally.
Best Practices for the Tattoo Parlors KPI Dashboard in Excel
Click to Purchases Tattoo Parlors KPI Dashboard in Excel
To get maximum value, you should follow these best practices.
✅ Keep KPI Definitions Clear
Always write simple and precise KPI definitions. This step prevents confusion across teams.
✅ Update Data Regularly
Enter actual numbers weekly or monthly. Frequent updates ensure accurate insights.
✅ Set Realistic Targets
Avoid overly aggressive targets. Instead, use historical data to set achievable goals.
✅ Review Trends Monthly
Do not just check the dashboard occasionally. Instead, conduct a structured monthly review.
✅ Train Your Team
Ensure managers understand:
-
KPI meaning
-
Dashboard navigation
-
Data entry process
Proper training improves adoption significantly.
✅ Maintain Data Accuracy
Always validate input numbers before updating the dashboard. Clean data produces reliable insights.
Who Can Benefit from This Dashboard?
This Tattoo Parlors KPI Dashboard in Excel works perfectly for:
-
Tattoo studio owners
-
Multi-branch tattoo businesses
-
Studio managers
-
Operations teams
-
Business consultants
-
Franchise operators
Whether you run a small studio or a large chain, this tool scales easily.
How Does This Dashboard Improve Tattoo Studio Performance?
Let us look at the real business impact.
Before Using the Dashboard
-
Scattered data
-
Delayed reporting
-
Poor visibility
-
Reactive decisions
-
Missed revenue opportunities
After Using the Dashboard
-
Centralized reporting
-
Real-time insights
-
Clear performance tracking
-
Faster decision-making
-
Improved profitability
Clearly, the transformation can be significant.
Conclusion: Turn Your Tattoo Studio into a Data-Driven Business
Running a successful tattoo parlor requires both creativity and control. While artists focus on delivering amazing designs, studio owners must focus on performance, efficiency, and growth.
The Tattoo Parlors KPI Dashboard in Excel bridges this gap.
It brings structure to your data.
It brings clarity to your decisions.
And most importantly, it brings control to your business.
If you want to scale your tattoo studio professionally, this dashboard becomes an essential tool in your management toolkit.
Frequently Asked Questions (FAQs)
❓ What is a Tattoo Parlors KPI Dashboard in Excel?
It is a ready-to-use Excel tool that helps tattoo studios track, analyze, and visualize key business performance metrics in one centralized dashboard.
❓ Do I need advanced Excel skills to use this dashboard?
No. The dashboard uses a user-friendly design. Therefore, even beginners can operate it easily.
❓ Can I customize the KPIs?
Yes. You can modify the KPI Definition sheet and add or adjust KPIs based on your studio requirements.
❓ How often should I update the data?
You should update the Actual Numbers sheet monthly or weekly for the best results.
❓ Does the dashboard support year-over-year comparison?
Yes. The Previous Year sheet enables full PY vs Actual analysis for both MTD and YTD.
❓ Can this dashboard work for multiple tattoo studio branches?
Yes. With minor data adjustments, you can extend the model to handle multi-branch operations.
Visit our YouTube channel to learn step-by-step video tutorials