The textile industry operates in a highly competitive environment where efficiency, quality, cost control, and delivery timelines determine success. Especially in textile dyeing and finishing operations, even small inefficiencies can increase production costs, waste resources, and reduce customer satisfaction.
Traditionally, many textile factories track production data using manual registers or scattered spreadsheets. However, this approach creates delays, errors, and poor visibility into performance. As a result, managers struggle to identify issues early and improve operational efficiency.
Therefore, businesses now prefer a structured and automated monitoring system. This is where the Textile Dyeing and Finishing KPI Dashboard in Excel becomes extremely valuable.
This ready-to-use dashboard helps textile manufacturers monitor performance indicators, compare targets with actual results, analyze trends, and make faster decisions — all within a familiar Excel environment.
In this detailed guide, you will learn:
-
What a Textile Dyeing and Finishing KPI Dashboard is
-
Why textile businesses need it
-
Dashboard structure and features
-
Key KPIs to track
-
Advantages and best practices
-
Implementation steps
-
Frequently asked questions
What Is a Textile Dyeing and Finishing KPI Dashboard in Excel?
A Textile Dyeing and Finishing KPI Dashboard in Excel is a performance monitoring tool designed specifically for textile processing units. It converts operational data into meaningful visual insights using KPIs (Key Performance Indicators).
Instead of reviewing multiple reports, managers can analyze:
-
Production efficiency
-
Dyeing quality performance
-
Machine utilization
-
Chemical consumption
-
Water and energy usage
-
Delivery timelines
-
Rework and defect rates
Because Excel supports formulas, charts, conditional formatting, and automation, the dashboard updates automatically once users enter data.
As a result, teams gain real-time visibility without investing in expensive software systems.
Click to Purchases Textile Dyeing and Finishing KPI Dashboard in Excel
Why Is KPI Tracking Important in Textile Dyeing and Finishing?
Textile dyeing and finishing involve multiple complex processes such as bleaching, dyeing, washing, drying, and finishing treatments. Each stage affects final product quality and cost.
Without KPI tracking:
-
Production delays remain unnoticed
-
Resource wastage increases
-
Quality issues repeat frequently
-
Management decisions rely on assumptions
However, when organizations track KPIs regularly, they can quickly identify performance gaps and improve operations.
Moreover, KPI dashboards help align production teams with business goals.
Click to Purchases Textile Dyeing and Finishing KPI Dashboard in Excel
Key Features of Textile Dyeing and Finishing KPI Dashboard in Excel
This ready-to-use dashboard contains 7 structured worksheets, each serving a specific purpose.
1️⃣ Home Sheet – Easy Navigation Center
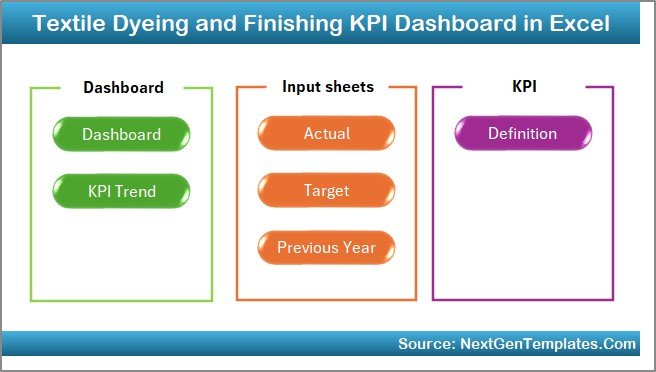
The Home sheet acts as an index page.
Key highlights:
-
Six navigation buttons
-
Quick access to all sheets
-
User-friendly interface
-
Simplified workflow
Therefore, users can move across dashboard pages without searching manually.
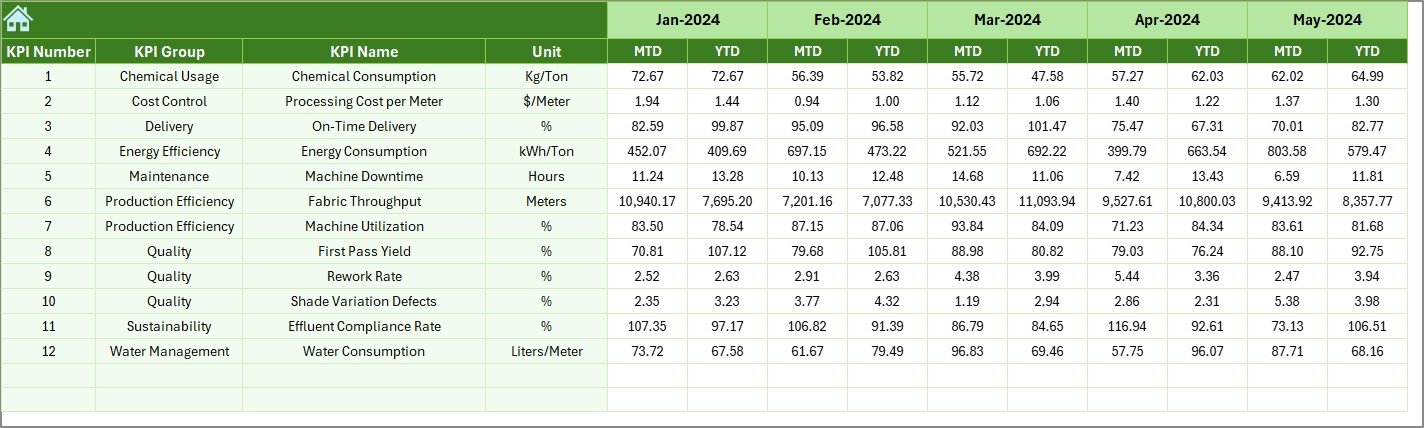
2️⃣ Dashboard Sheet – Central KPI Overview
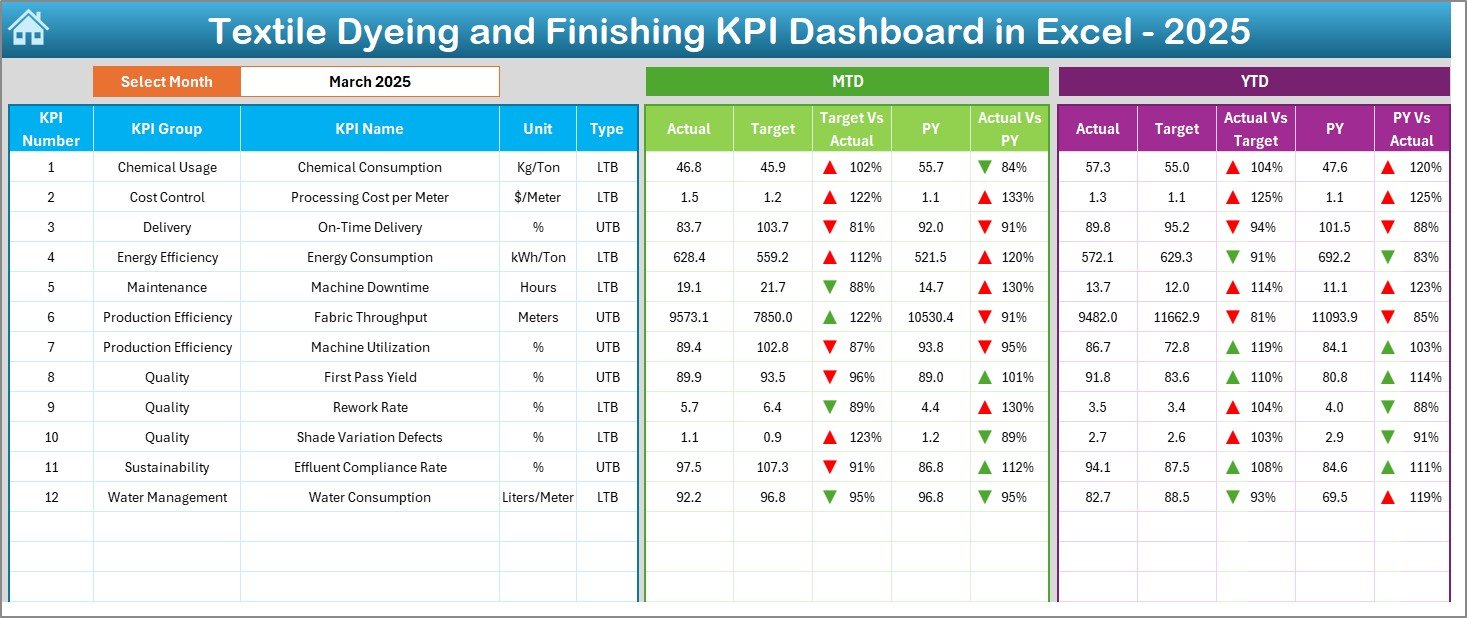
This sheet serves as the main performance dashboard.
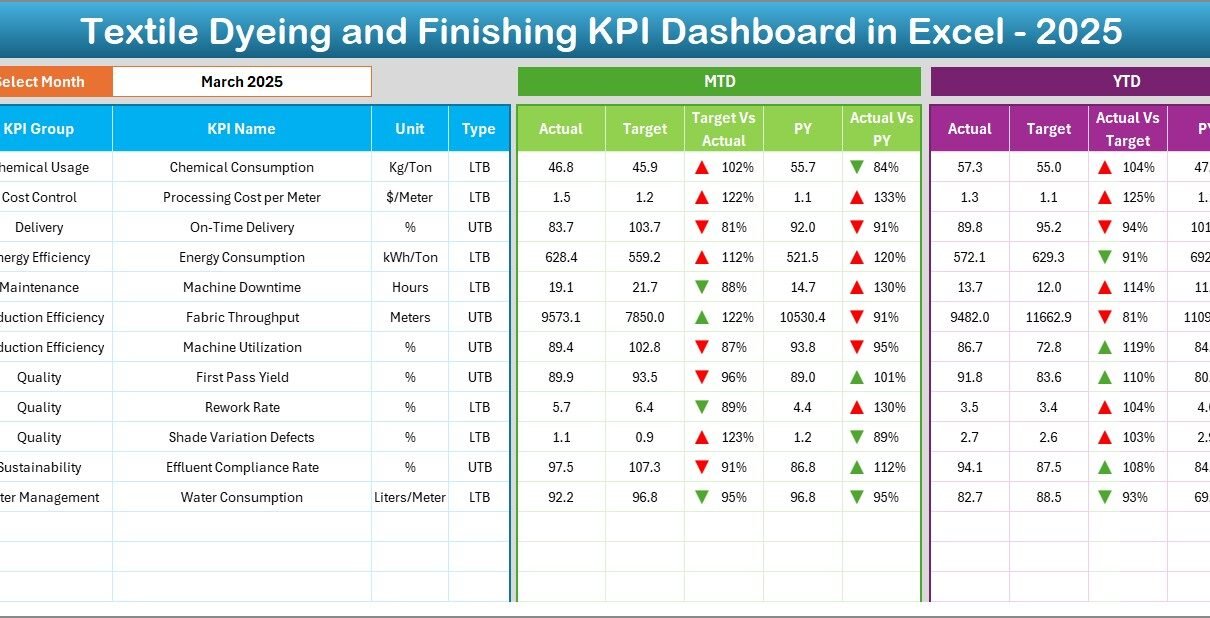
Dynamic Month Selection
Users can select the month from cell D3, and instantly:
-
All KPIs update automatically
-
Charts refresh dynamically
-
Performance comparisons adjust instantly
KPI Performance Metrics Displayed
The dashboard shows:
MTD (Month-To-Date):
-
Actual Values
-
Target Values
-
Previous Year Data
-
Target vs Actual comparison
-
Previous Year vs Actual comparison
YTD (Year-To-Date):
-
Actual Performance
-
Target Achievement
-
Previous Year Benchmark
Additionally, conditional formatting arrows visually indicate performance trends.
As a result, managers quickly understand whether performance improves or declines.
Click to Purchases Textile Dyeing and Finishing KPI Dashboard in Excel
3️⃣ KPI Trend Sheet – Performance Analysis Over Time
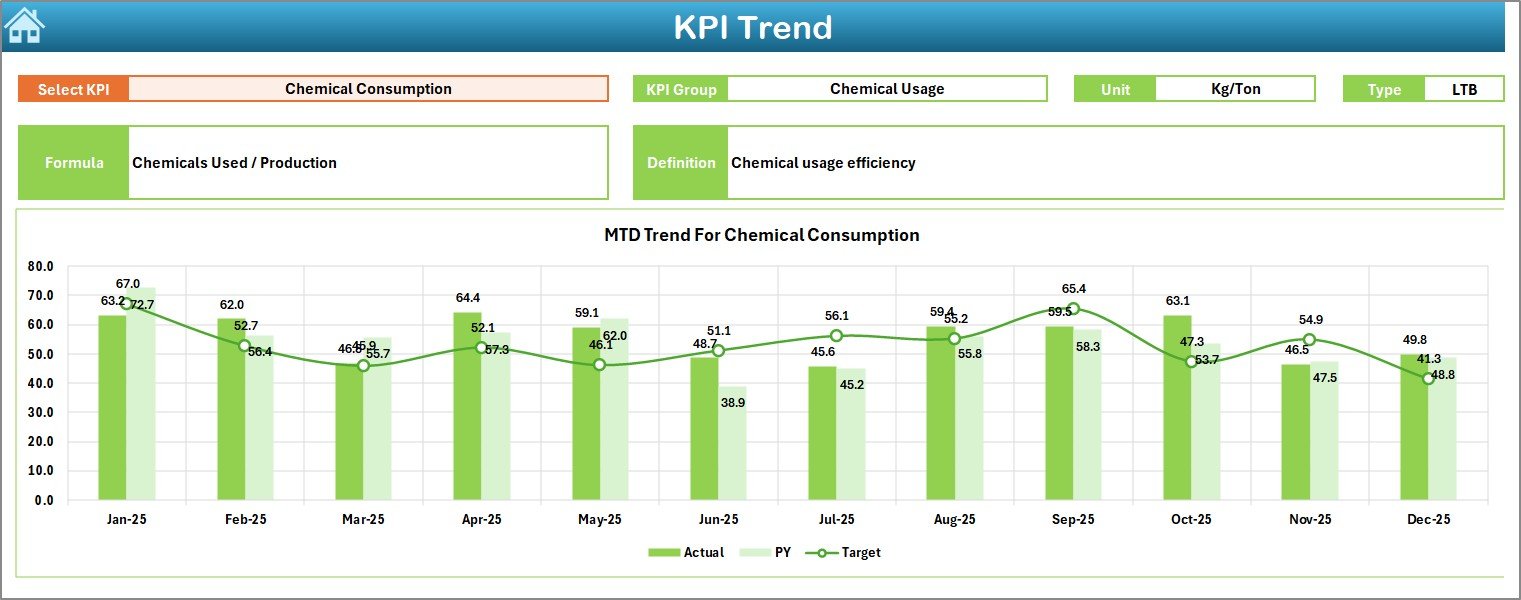
The KPI Trend sheet helps users analyze individual KPI behavior.
Users select a KPI from the dropdown in cell C3, and the dashboard displays:
-
KPI Group
-
Unit of Measurement
-
KPI Type (Higher is Better / Lower is Better)
-
KPI Formula
-
KPI Definition
Furthermore, the sheet includes:
-
MTD Trend Chart
-
YTD Trend Chart
-
Actual vs Target vs Previous Year comparison
Therefore, decision-makers can analyze patterns instead of relying on single-month results.
4️⃣ Actual Numbers Input Sheet – Data Entry Area
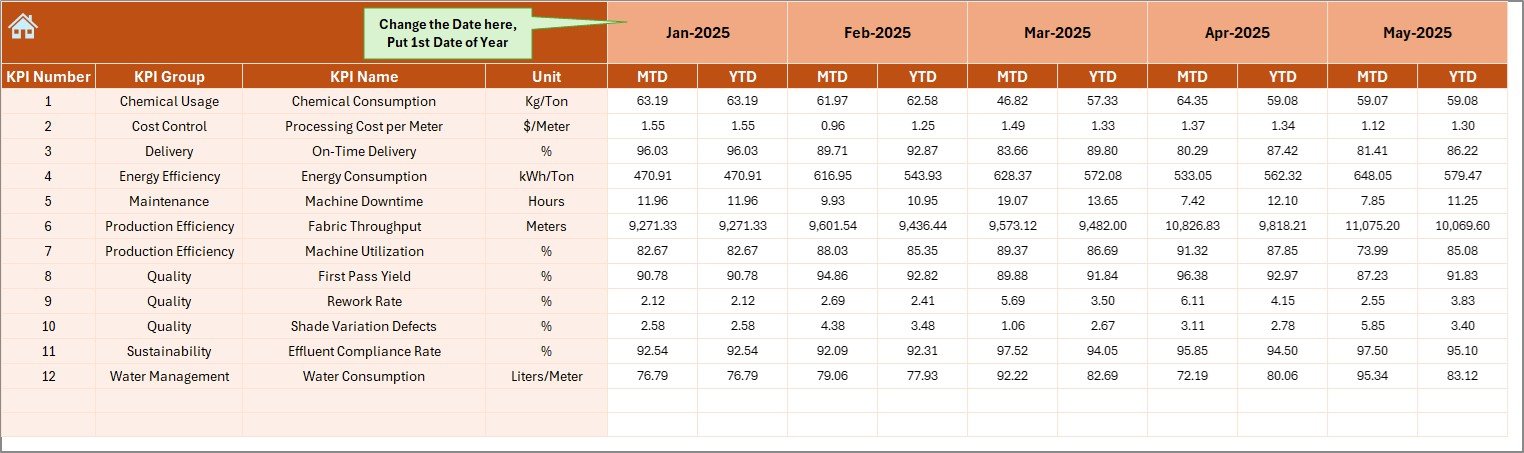
This sheet allows users to enter actual operational data.
How it works:
-
Select starting month in cell E1
-
Enter MTD and YTD values
-
Dashboard updates automatically
Because data entry remains centralized, teams reduce reporting errors.
Click to Purchases Textile Dyeing and Finishing KPI Dashboard in Excel
5️⃣ Target Sheet – Goal Planning
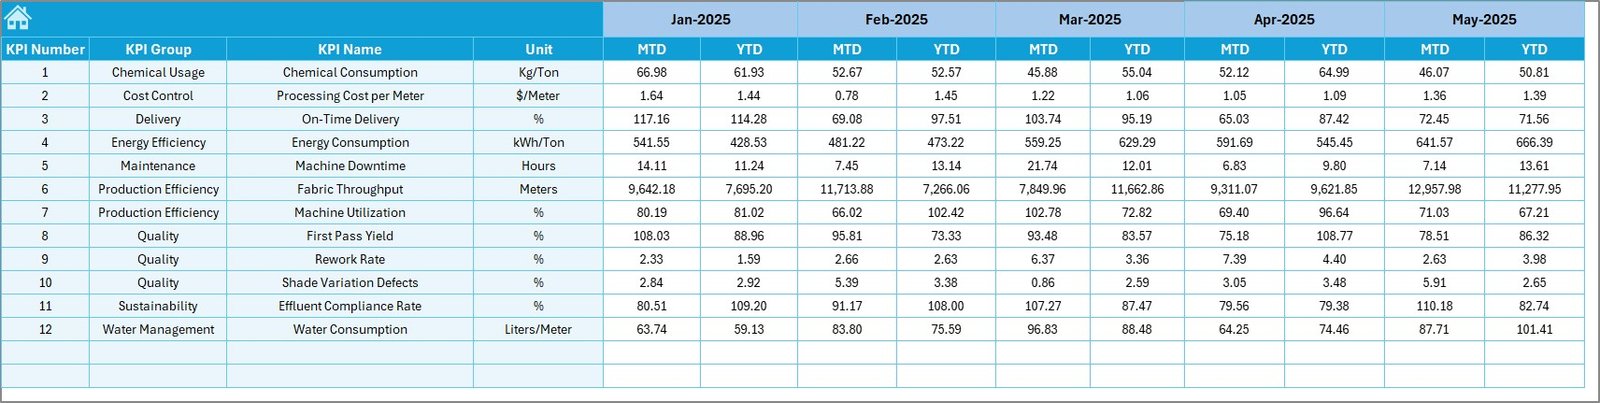
In this worksheet, users define monthly targets for each KPI.
You can input:
-
MTD Targets
-
YTD Targets
Consequently, management can compare planned performance with actual outcomes.
6️⃣ Previous Year Numbers Sheet – Historical Benchmarking
This sheet stores last year’s KPI values.
Historical comparison helps organizations:
-
Measure improvement
-
Identify seasonal trends
-
Set realistic targets
Therefore, performance evaluation becomes more meaningful.
Click to Purchases Textile Dyeing and Finishing KPI Dashboard in Excel
7️⃣ KPI Definition Sheet – KPI Documentation
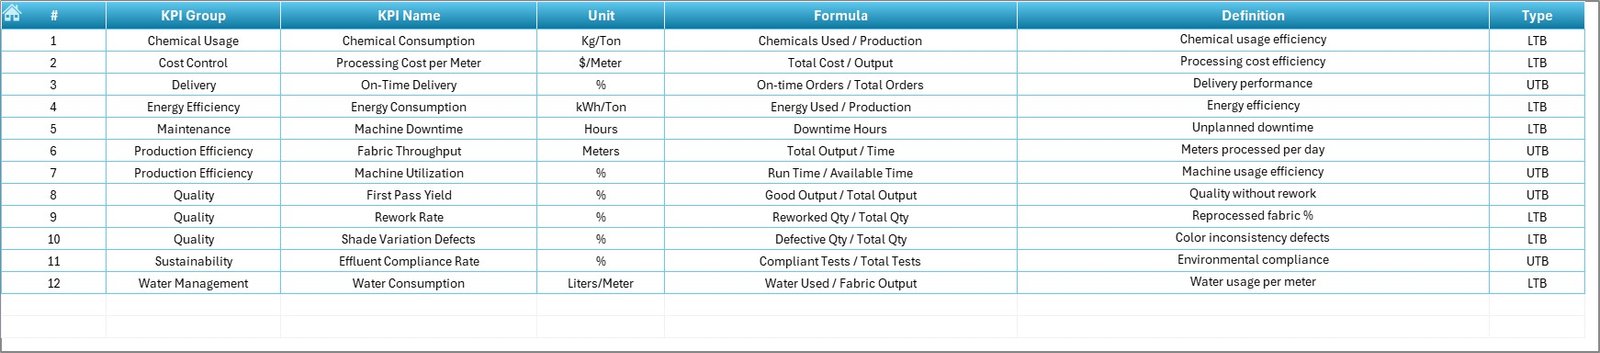
This sheet maintains KPI master information, including:
-
KPI Name
-
KPI Group
-
Unit
-
Formula
-
KPI Definition
Because all definitions stay documented, teams maintain consistency in reporting.
Which KPIs Should Textile Dyeing and Finishing Units Track?
A well-designed dashboard monitors both operational and quality indicators.
Production KPIs
-
Production Output (Kg/day)
-
Machine Utilization Rate
-
Batch Completion Time
-
Production Efficiency %
Quality KPIs
-
Shade Matching Accuracy
-
Reprocessing Rate
-
Defect Percentage
-
First Pass Yield
Resource Consumption KPIs
-
Water Consumption per Kg
-
Chemical Usage Efficiency
-
Energy Consumption
-
Steam Usage
Cost KPIs
-
Dyeing Cost per Unit
-
Labor Cost Efficiency
-
Chemical Cost Variance
Delivery KPIs
-
On-Time Delivery Rate
-
Order Completion Time
Tracking these KPIs ensures complete operational visibility.
How Does the Dashboard Improve Decision-Making?
The dashboard transforms raw data into insights.
For example:
-
Managers instantly identify underperforming departments.
-
Production teams adjust processes quickly.
-
Quality teams reduce defect recurrence.
-
Finance teams monitor cost efficiency.
Because decisions rely on data rather than assumptions, organizations achieve faster improvements.
Click to Purchases Textile Dyeing and Finishing KPI Dashboard in Excel
Advantages of Textile Dyeing and Finishing KPI Dashboard in Excel
✅ Centralized Performance Monitoring
All KPIs appear in one location, which eliminates multiple reports.
✅ Real-Time Insights
Once users update data, results refresh immediately.
✅ Easy to Use
Excel familiarity reduces training requirements.
✅ Better Quality Control
Teams identify quality issues early.
✅ Improved Resource Management
Managers monitor water, energy, and chemical usage efficiently.
✅ Historical Comparison
Previous year analysis supports strategic planning.
✅ Cost-Effective Solution
Companies avoid expensive ERP analytics tools.
How to Implement the Textile Dyeing KPI Dashboard Successfully?
Step 1: Define Business Goals
First, identify what the factory wants to improve:
-
Quality
-
Cost reduction
-
Productivity
-
Sustainability
Step 2: Select Relevant KPIs
Choose measurable KPIs aligned with objectives.
Step 3: Collect Accurate Data
Ensure supervisors enter correct values regularly.
Step 4: Set Targets
Define achievable performance goals.
Step 5: Review Monthly Performance
Conduct monthly KPI review meetings.
Step 6: Take Corrective Actions
Implement improvements based on dashboard insights.
Click to Purchases Textile Dyeing and Finishing KPI Dashboard in Excel
Best Practices for the Textile Dyeing and Finishing KPI Dashboard
To maximize dashboard benefits, follow these practices:
✔ Maintain Data Accuracy
Always validate input data before analysis.
✔ Update Data Regularly
Daily or weekly updates improve decision speed.
✔ Limit KPI Overload
Track only meaningful KPIs.
✔ Train Team Members
Ensure users understand KPI definitions.
✔ Use Visual Indicators
Colors and arrows help quick interpretation.
✔ Review Trends, Not Just Numbers
Focus on patterns instead of isolated results.
✔ Align KPIs with Business Strategy
Every KPI should support organizational goals.
How Does Excel Make KPI Monitoring Powerful?
Excel remains one of the most flexible business tools.
It allows:
-
Automated calculations
-
Dynamic dropdown selections
-
Conditional formatting
-
Pivot analysis
-
Trend visualization
-
Easy customization
Therefore, even small textile units can implement advanced analytics without IT complexity.
Click to Purchases Textile Dyeing and Finishing KPI Dashboard in Excel
Common Challenges in Textile KPI Tracking (And Solutions)
Challenge 1: Manual Reporting Delays
Solution: Use centralized input sheets.
Challenge 2: Inconsistent KPI Definitions
Solution: Maintain KPI Definition sheet.
Challenge 3: Lack of Historical Analysis
Solution: Track previous year data.
Challenge 4: Poor Visualization
Solution: Use dashboard charts and indicators.
Who Can Use This Dashboard?
This dashboard benefits multiple roles:
-
Textile Factory Owners
-
Production Managers
-
Dyeing Supervisors
-
Quality Control Teams
-
Operations Analysts
-
Industrial Engineers
Because the dashboard remains flexible, organizations of all sizes can adopt it.
Future Improvements You Can Add
Although the dashboard already provides strong analytics, you can enhance it further:
-
Power Query automation
-
Machine-wise analysis
-
Shift performance tracking
-
Cost forecasting models
-
Sustainability KPIs
-
Automated alerts
These additions help build a smart manufacturing environment.
Conclusion
The Textile Dyeing and Finishing KPI Dashboard in Excel provides a structured, practical, and powerful way to monitor textile operations. Instead of managing disconnected reports, organizations gain a centralized performance system that delivers clarity and actionable insights.
Moreover, the dashboard improves productivity, enhances quality control, and supports data-driven decision-making. Since Excel remains widely accessible, companies can implement this solution quickly without large investments.
Ultimately, businesses that measure performance consistently achieve better efficiency, reduced waste, and stronger profitability.
Click to Purchases Textile Dyeing and Finishing KPI Dashboard in Excel
Frequently Asked Questions (FAQs)
What is a Textile Dyeing KPI Dashboard?
A Textile Dyeing KPI Dashboard is an Excel-based tool that tracks production, quality, cost, and efficiency metrics using visual performance indicators.
Why should textile factories use KPI dashboards?
Factories use KPI dashboards to monitor performance, reduce waste, improve quality, and make faster operational decisions.
Can small textile businesses use this dashboard?
Yes. Since it runs in Excel, small and medium textile units can easily implement it without expensive software.
How often should KPIs be updated?
Ideally, teams should update KPI data daily or weekly to maintain accurate analysis.
What makes this dashboard different from regular spreadsheets?
Unlike standard spreadsheets, this dashboard provides automated calculations, visual comparisons, and trend analysis.
Can I customize KPIs in this dashboard?
Yes. You can add, remove, or modify KPIs using the KPI Definition sheet.
Does the dashboard support yearly comparisons?
Yes. It includes Previous Year data comparison for better performance evaluation.
Is Excel suitable for industrial KPI tracking?
Absolutely. Excel offers flexibility, automation, and visualization features suitable for operational analytics.
Click to Purchases Textile Dyeing and Finishing KPI Dashboard in Excel
Visit our YouTube channel to learn step-by-step video tutorials