The leather industry plays a vital role in global manufacturing. Companies process raw hides into finished leather products used in footwear, furniture, automotive interiors, garments, and accessories. However, leather processing involves multiple stages such as soaking, liming, tanning, dyeing, finishing, and quality inspection. Because each stage affects cost, quality, and production efficiency, businesses must continuously monitor performance.
Many leather processing units still rely on manual reports or scattered spreadsheets. As a result, managers struggle to track performance trends, compare targets, and identify operational problems quickly. Therefore, organizations now adopt data-driven solutions to manage production effectively.
A Leather Processing KPI Dashboard in Power BI provides a modern and structured way to track key performance indicators (KPIs) in real time. Instead of reviewing multiple reports, decision-makers can analyze performance from a single interactive dashboard.
In this comprehensive guide, you will learn everything about the Leather Processing KPI Dashboard in Power BI, including features, structure, benefits, implementation methods, best practices, and frequently asked questions.
Click to buy Leather Processing KPI Dashboard in Power BI
What Is a Leather Processing KPI Dashboard in Power BI?
A Leather Processing KPI Dashboard in Power BI is a ready-to-use analytical reporting solution designed to monitor leather manufacturing performance using measurable KPIs.
The dashboard collects data from an Excel data source and converts raw numbers into visual insights. Consequently, production managers, quality teams, and plant executives can evaluate operational efficiency instantly.
Instead of manually calculating results every month, the dashboard automatically compares:
- Actual vs Target performance
- Current Year vs Previous Year results
- Month-to-Date (MTD) performance
- Year-to-Date (YTD) performance
Because Power BI supports interactive visuals and dynamic filters, users can explore performance at multiple levels without technical complexity.
Why Do Leather Processing Companies Need KPI Dashboards?
Leather processing operations involve chemicals, labor, machines, and strict quality standards. Therefore, even small inefficiencies can increase costs or reduce product quality.
Without structured monitoring:
- Production delays remain unnoticed.
- Quality defects increase.
- Resource usage becomes inefficient.
- Management decisions rely on assumptions.
However, KPI dashboards solve these challenges by offering real-time visibility.
Key Reasons Businesses Adopt KPI Dashboards
- Improve production efficiency
- Reduce processing waste
- Monitor chemical consumption
- Track quality performance
- Compare operational trends
- Support faster decision-making
As a result, organizations shift from reactive management to proactive performance control.
How Does the Leather Processing KPI Dashboard Work?
The dashboard uses Excel as the data input layer and Power BI as the visualization layer. First, users enter KPI data into structured Excel sheets. Then Power BI processes the information automatically.
Data Flow Process
- Enter KPI data in Excel.
- Load data into Power BI.
- Apply calculations and measures.
- Generate visual dashboards.
- Analyze performance using slicers and charts.
Because the process remains simple, even non-technical users can maintain the system easily.
Key Features of Leather Processing KPI Dashboard in Power BI
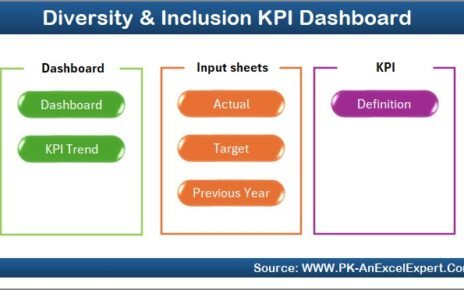
The dashboard contains three interactive pages, each designed for specific analysis purposes.
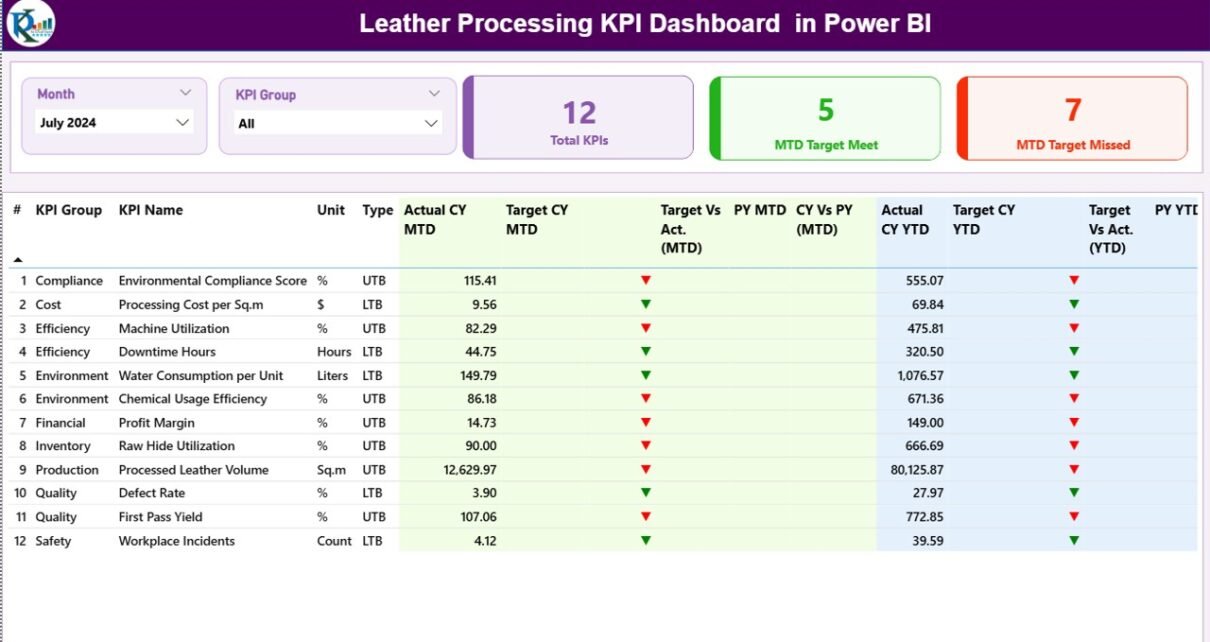
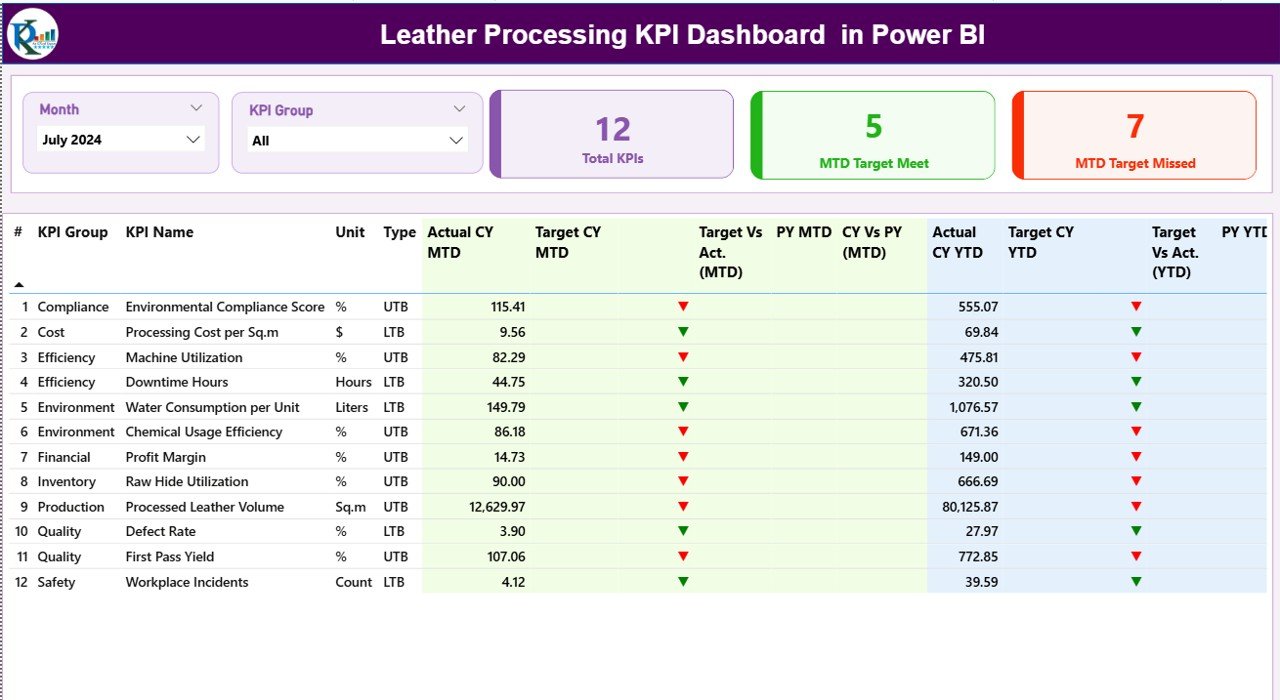
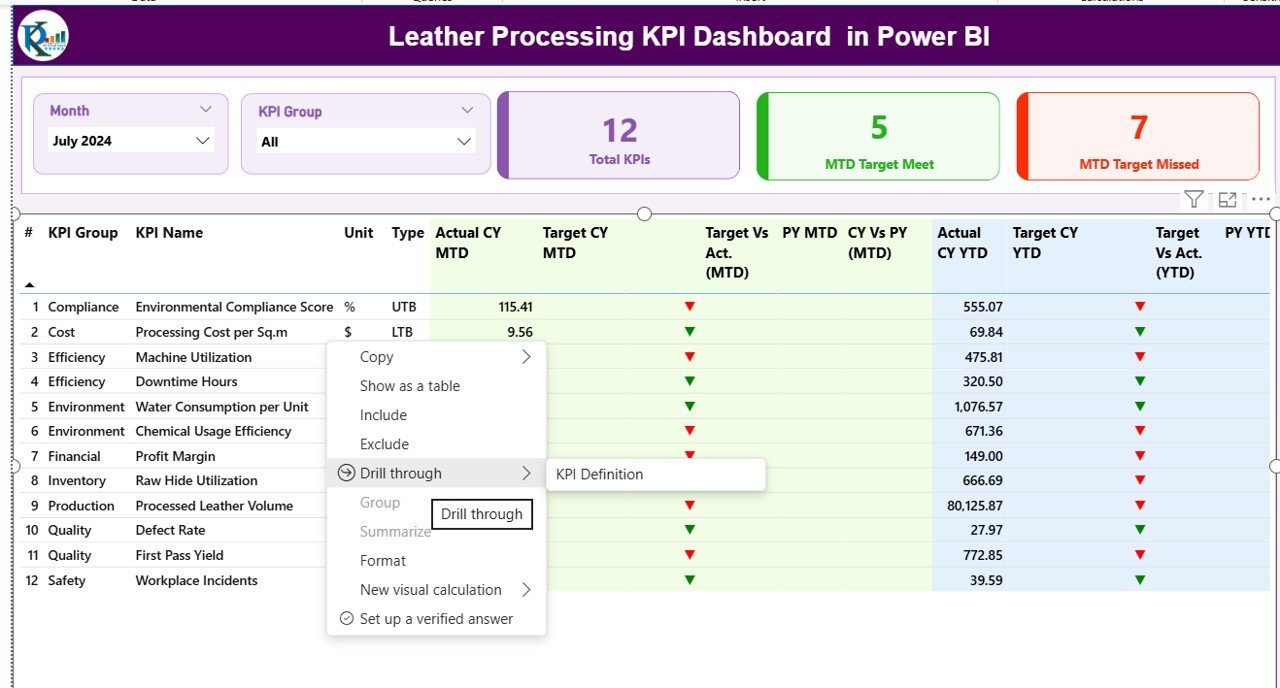
Summary Page – Central Performance Overview
The Summary Page acts as the main dashboard interface. It provides a quick overview of all KPIs.
Top Section Features
- Month slicer for period selection
- KPI Group slicer for category filtering
- Performance summary cards
KPI Cards Display
- Total KPIs Count
- MTD Target Meet Count
- MTD Target Missed Count
These cards immediately show operational health.
Detailed KPI Table
The dashboard displays structured KPI information including:
- KPI Number – Sequential KPI identifier
- KPI Group – KPI category
- KPI Name – Performance indicator name
- Unit – Measurement unit
- Type – LTB (Lower the Better) or UTB (Upper the Better)
Performance Metrics Included
- Actual CY MTD
- Target CY MTD
- MTD Status Icons (▲ Green / ▼ Red)
- Target vs Actual (MTD %)
- Previous Year MTD
- CY vs PY Comparison (MTD)
Additionally, the dashboard shows YTD performance:
- Actual CY YTD
- Target CY YTD
- YTD Status Indicators
- Target vs Actual (YTD %)
- Previous Year YTD
- CY vs PY Comparison (YTD)
Because all metrics appear in one table, managers can identify underperforming KPIs instantly.
Click to buy Leather Processing KPI Dashboard in Power BI
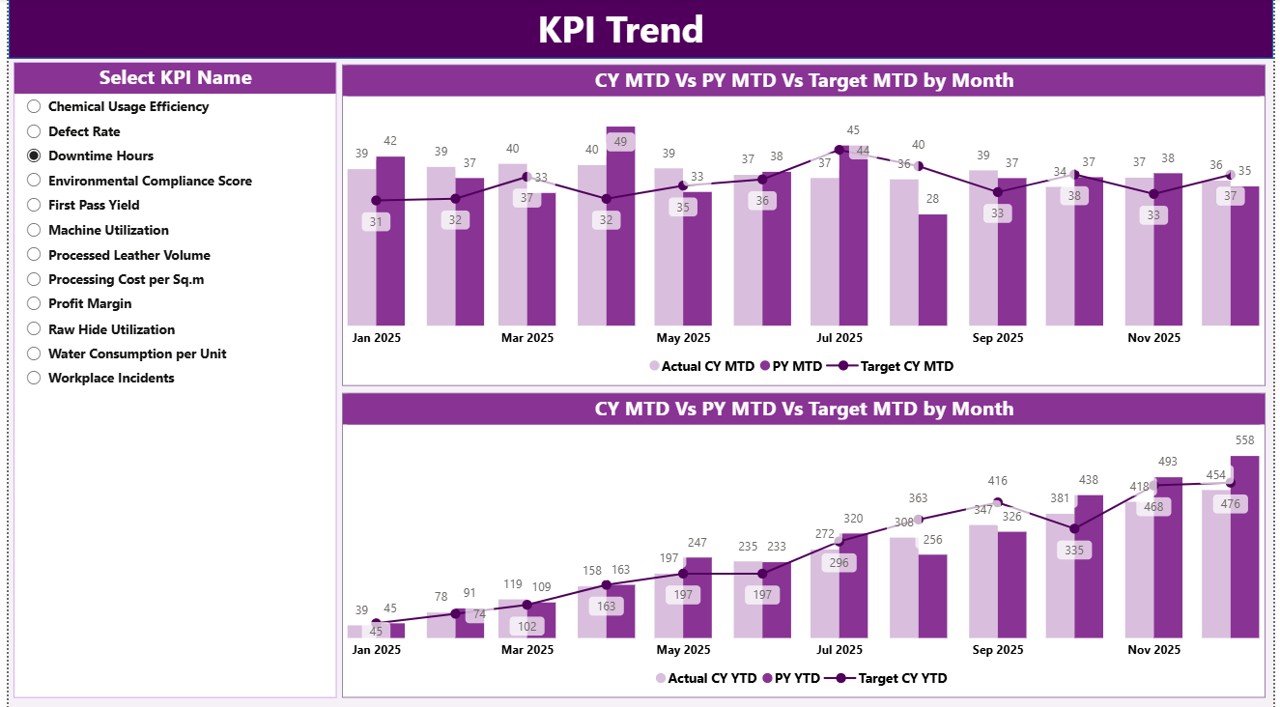
KPI Trend Page – Performance Over Time
While the summary page shows current status, the KPI Trend Page explains performance movement.
Key Components
- KPI Name slicer
- Two combo charts:
- MTD performance trends
- YTD performance trends
The charts compare:
- Current Year Actual
- Previous Year Actual
- Target Values
Therefore, teams understand whether performance improves or declines over time.
Click to buy Leather Processing KPI Dashboard in Power BI
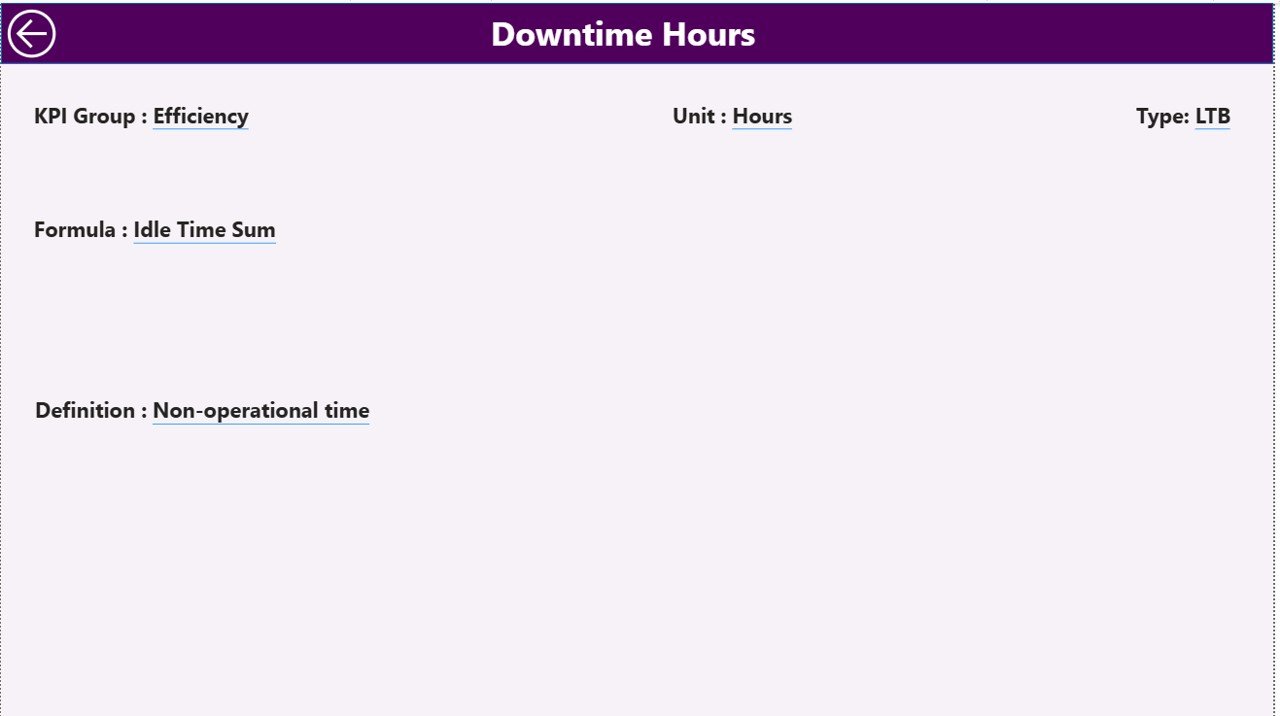
KPI Definition Page – Drill-Through Analysis
The KPI Definition Page works as a hidden drill-through page.
Users can click any KPI from the summary page and view:
- KPI Formula
- KPI Definition
- Measurement logic
- KPI Type classification
This feature ensures transparency because every KPI includes clear documentation.
Click to buy Leather Processing KPI Dashboard in Power BI
Excel Data Structure Used in the Dashboard
The dashboard uses an Excel file containing three worksheets.
Input_Actual Sheet
Users enter actual performance values here.
Required Fields
- KPI Name
- Month (First date of month)
- MTD Value
- YTD Value
Since data updates monthly, users only need to append new rows.
Click to buy Leather Processing KPI Dashboard in Power BI
Input_Target Sheet
This sheet stores target values.
Fields Include
- KPI Name
- Month
- MTD Target
- YTD Target
Because targets remain structured, comparisons become automatic.
KPI Definition Sheet
This sheet defines KPI metadata.
Columns Included
- KPI Number
- KPI Group
- KPI Name
- Unit
- Formula
- Definition
- Type (LTB / UTB)
As a result, dashboard calculations remain standardized.
What KPIs Can Be Tracked in Leather Processing?
A leather processing dashboard can track multiple operational areas.
Production KPIs
- Processing Output Volume
- Machine Utilization Rate
- Batch Completion Time
- Production Efficiency %
Quality KPIs
- Defect Rate
- Reprocessing Percentage
- Quality Acceptance Rate
Cost KPIs
- Chemical Consumption Cost
- Energy Usage per Batch
- Labor Cost per Unit
Environmental KPIs
- Water Consumption
- Waste Generation
- Effluent Treatment Efficiency
Therefore, management gains a complete operational view.
Advantages of Leather Processing KPI Dashboard in Power BI
Implementing this dashboard delivers measurable benefits.
- Real-Time Performance Visibility
Managers instantly understand operational status without waiting for reports.
- Data-Driven Decisions
Teams rely on measurable insights instead of assumptions.
- Improved Production Efficiency
Performance comparisons highlight bottlenecks quickly.
- Better Quality Control
Defect trends become visible early.
- Faster Reporting
Automatic calculations eliminate manual work.
- Historical Performance Analysis
Year-over-year comparisons support strategic planning.
- Standardized KPI Monitoring
Every department follows the same performance metrics.
How to Implement the Leather Processing KPI Dashboard?
Implementing the dashboard requires a structured approach.
Step 1: Identify KPIs
Select KPIs aligned with business goals.
Step 2: Prepare Excel Data
Create Actual, Target, and Definition sheets.
Step 3: Load Data into Power BI
Connect Excel as the data source.
Step 4: Create Measures
Define MTD and YTD calculations.
Step 5: Design Visuals
Build summary tables and charts.
Step 6: Publish Dashboard
Share reports across departments.
Because Power BI automates updates, maintenance remains simple.
Best Practices for the Leather Processing KPI Dashboard
Following best practices ensures long-term success.
Define Clear KPIs
Avoid vague metrics. Always define measurable indicators.
Maintain Data Accuracy
Validate Excel entries regularly.
Update Data Consistently
Use monthly update schedules.
Use KPI Groups
Categorize KPIs for easier analysis.
Monitor Trends Instead of Single Values
Trend analysis reveals real problems.
Limit Dashboard Complexity
Keep visuals simple and focused.
Train Users
Ensure teams understand KPI meanings.
Common Challenges and How to Solve Them
Challenge: Inconsistent Data Entry
Solution: Use standardized templates.
Challenge: Too Many KPIs
Solution: Focus on critical performance indicators.
Challenge: Lack of User Adoption
Solution: Provide training sessions.
Challenge: Delayed Updates
Solution: Assign data ownership responsibilities.
Future Scope of KPI Dashboards in Leather Manufacturing
The leather industry increasingly adopts digital transformation.
Future dashboards may include:
- IoT machine integration
- Real-time production sensors
- AI-based performance prediction
- Automated alerts
- Sustainability tracking analytics
Therefore, KPI dashboards will evolve into intelligent decision systems.
Why Power BI Is Ideal for KPI Monitoring?
Power BI offers several advantages over traditional reporting tools.
- Interactive visuals
- Drill-through analysis
- Automatic refresh
- Easy Excel integration
- Cloud sharing capability
- Scalable analytics
Because of these features, Power BI suits manufacturing environments perfectly.
Conclusion
The Leather Processing KPI Dashboard in Power BI transforms how leather manufacturing companies monitor performance. Instead of managing complex spreadsheets, organizations gain a centralized, visual, and interactive performance system.
The dashboard combines Excel data entry with Power BI analytics, allowing businesses to track MTD and YTD performance, compare historical results, and identify operational gaps quickly. Moreover, managers can drill into KPI definitions, analyze trends, and take corrective actions faster.
As competition increases and operational efficiency becomes critical, data-driven KPI monitoring no longer remains optional. Companies that adopt KPI dashboards improve productivity, quality control, and strategic decision-making significantly.
Therefore, implementing a Leather Processing KPI Dashboard represents a powerful step toward modern manufacturing analytics.
Frequently Asked Questions (FAQs)
What is a KPI dashboard in leather processing?
A KPI dashboard tracks measurable performance indicators related to production, quality, and cost in leather manufacturing.
Why should leather factories use Power BI?
Power BI provides interactive analytics, automatic calculations, and easy visualization of operational data.
Can beginners use this dashboard?
Yes. Users only need to update Excel sheets, and Power BI updates visuals automatically.
What data source does the dashboard use?
The dashboard uses structured Excel worksheets for Actual, Target, and KPI Definition data.
What does LTB and UTB mean?
LTB means Lower the Better, while UTB means Upper the Better performance indicators.
How often should KPI data be updated?
Most organizations update data monthly, although weekly updates also work.
Can the dashboard track multiple departments?
Yes. KPI groups allow analysis across production, quality, cost, and environmental areas.
Is coding required to use this dashboard?
No advanced coding is required. Basic Power BI usage is sufficient.
Visit our YouTube channel to learn step-by-step video tutorials
Watch the step-by-step video tutorial:
Click to buy Leather Processing KPI Dashboard in Power BI