In today’s data-driven business environment, organizations rely heavily on data analytics to make smarter decisions, improve operational efficiency, and gain competitive advantages. Companies collect massive volumes of data every day. However, many teams struggle to measure whether their analytics efforts actually deliver results.
Without structured performance tracking, analytics initiatives lose direction. Consequently, teams fail to align insights with business goals. Therefore, organizations increasingly adopt KPI scorecards to evaluate analytics performance clearly and consistently.
The Data Analytics KPI Scorecard in Excel provides a practical and powerful solution that helps businesses track analytics performance using measurable Key Performance Indicators (KPIs) in a simple and interactive format.
In this comprehensive guide, you will learn everything about the Data Analytics KPI Scorecard in Excel, including its structure, features, benefits, implementation strategy, best practices, and frequently asked questions.
Click to Purchases Data Analytics KPI Scorecard in Excel
What Is a Data Analytics KPI Scorecard in Excel?
A Data Analytics KPI Scorecard in Excel is a ready-to-use performance management template designed to monitor analytics-related KPIs using structured data and automated calculations.
Instead of reviewing scattered reports, analysts and managers can evaluate performance through a centralized scorecard. As a result, organizations gain clear visibility into analytics effectiveness.
Moreover, Excel allows flexible customization, easy data updates, and automated visual indicators. Therefore, teams can implement the scorecard quickly without complex software.
Why Do Organizations Need a Data Analytics KPI Scorecard?
Data analytics teams often focus on dashboards, reports, and models. However, they sometimes overlook performance measurement.
Without KPIs, organizations cannot answer important questions such as:
-
Are analytics projects delivering value?
-
Are reports used effectively?
-
Is data quality improving?
-
Are insights driving decisions?
Because of these challenges, KPI scorecards become essential tools.
Key Benefits of KPI Tracking in Analytics
-
Align analytics with business objectives
-
Monitor performance continuously
-
Improve decision-making speed
-
Identify improvement opportunities
-
Increase accountability across teams
Therefore, KPI scorecards ensure analytics efforts produce measurable outcomes.
Click to Purchases Data Analytics KPI Scorecard in Excel
What Problems Does the Scorecard Solve?
Many analytics teams rely on manual tracking methods. Although spreadsheets exist, they often lack structure.
Common issues include:
-
Inconsistent KPI definitions
-
Manual performance calculations
-
Difficulty tracking trends
-
Lack of visual performance indicators
-
Delayed reporting updates
The Data Analytics KPI Scorecard in Excel solves these problems by creating a standardized performance monitoring framework.
Click to Purchases Data Analytics KPI Scorecard in Excel
Key Features of the Data Analytics KPI Scorecard in Excel
This ready-to-use template contains four structured worksheets, each serving a specific purpose.
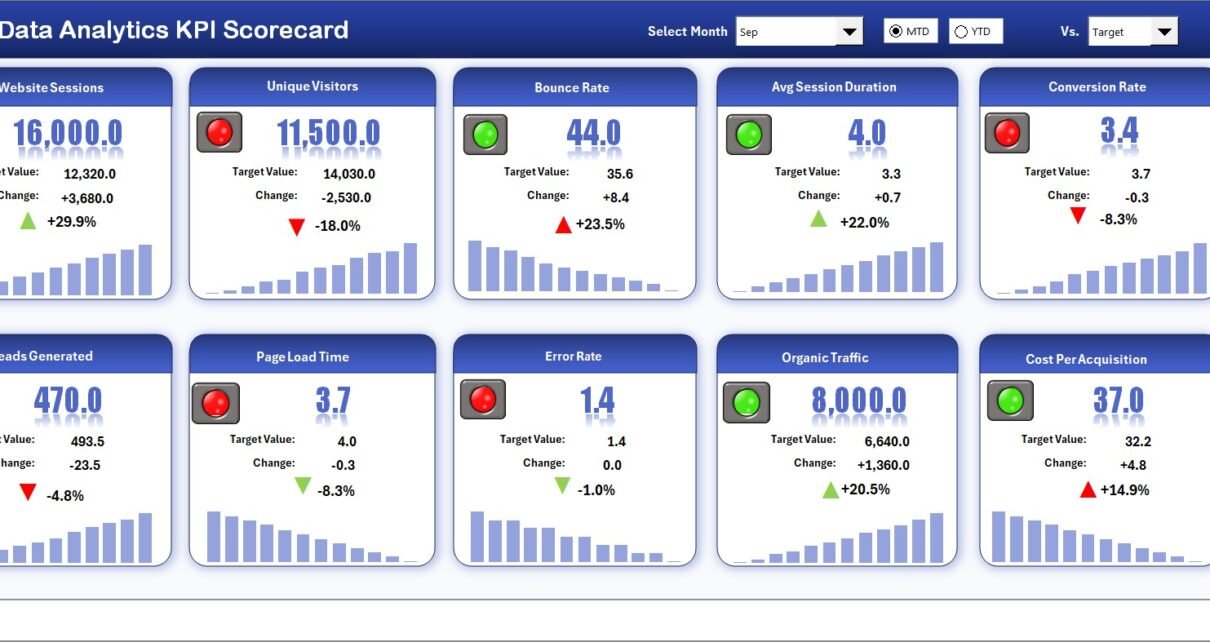
1️⃣ Scorecard Sheet – Central KPI Performance Interface
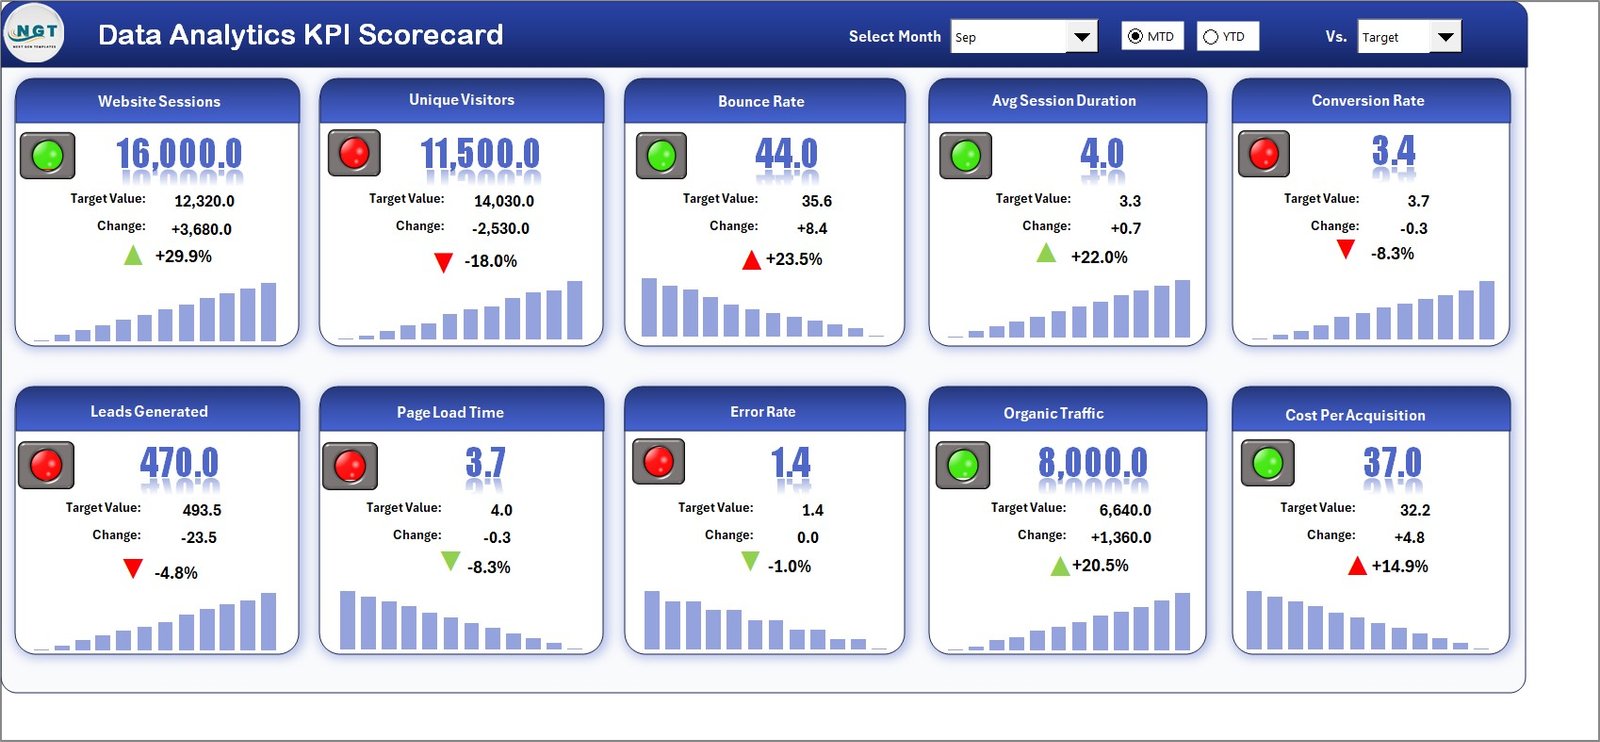
The Scorecard Sheet acts as the main dashboard where users review KPI performance.
Key Features
Dropdown Menus
Users can select:
-
Month
-
MTD (Month-To-Date)
-
YTD (Year-To-Date)
As soon as selections change, the scorecard updates automatically.
Actual vs Target Comparison
The sheet compares:
-
Actual KPI performance
-
Target values
Therefore, users immediately understand performance status.
Visual Indicators
Conditional formatting displays color-coded indicators that highlight:
-
Performance achieved
-
Performance below target
-
Performance improvement trends
Comprehensive KPI Overview
The scorecard presents all KPI information in one location, including MTD and YTD comparisons.
As a result, decision-makers gain instant visibility.
Click to Purchases Data Analytics KPI Scorecard in Excel
2️⃣ KPI Trend Sheet – Performance Trend Analysis
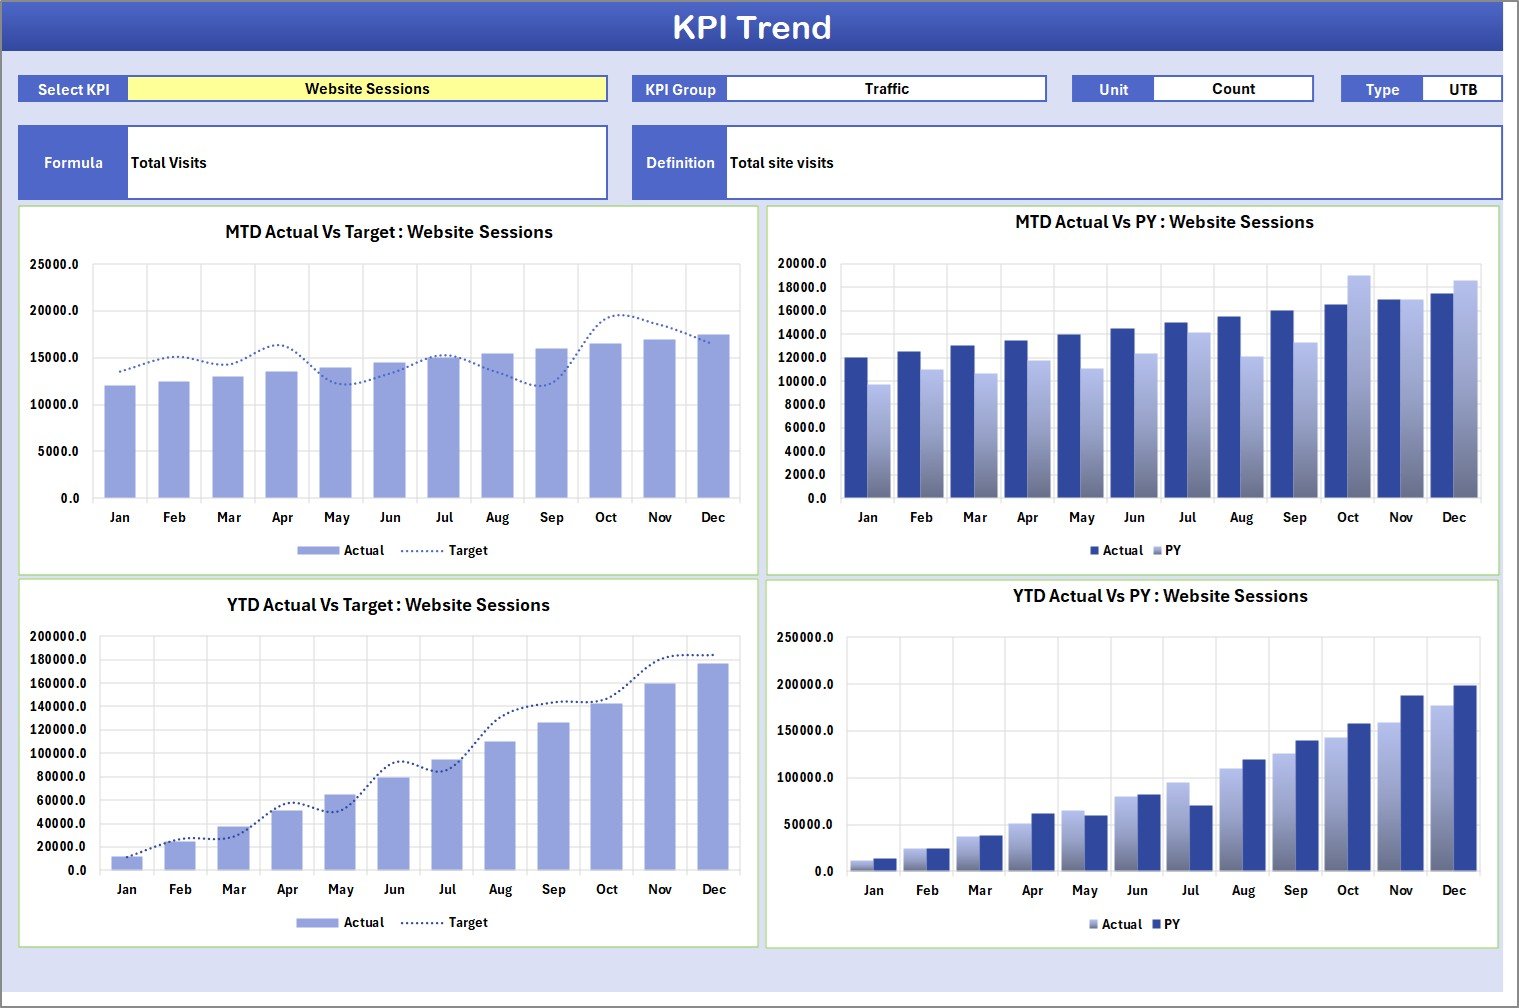
The KPI Trend Sheet allows detailed KPI analysis over time.
Users select a KPI from the dropdown in cell C3, and the system updates automatically.
Information Displayed
-
KPI Group
-
KPI Unit
-
KPI Type (Lower the Better or Upper the Better)
-
KPI Formula
-
KPI Definition
Additionally, trend charts display:
-
MTD performance trends
-
YTD performance trends
-
Actual vs Target vs Previous Year comparisons
Because trends appear visually, users quickly identify performance patterns.
Click to Purchases Data Analytics KPI Scorecard in Excel
3️⃣ Input Data Sheet – Central Data Entry Area
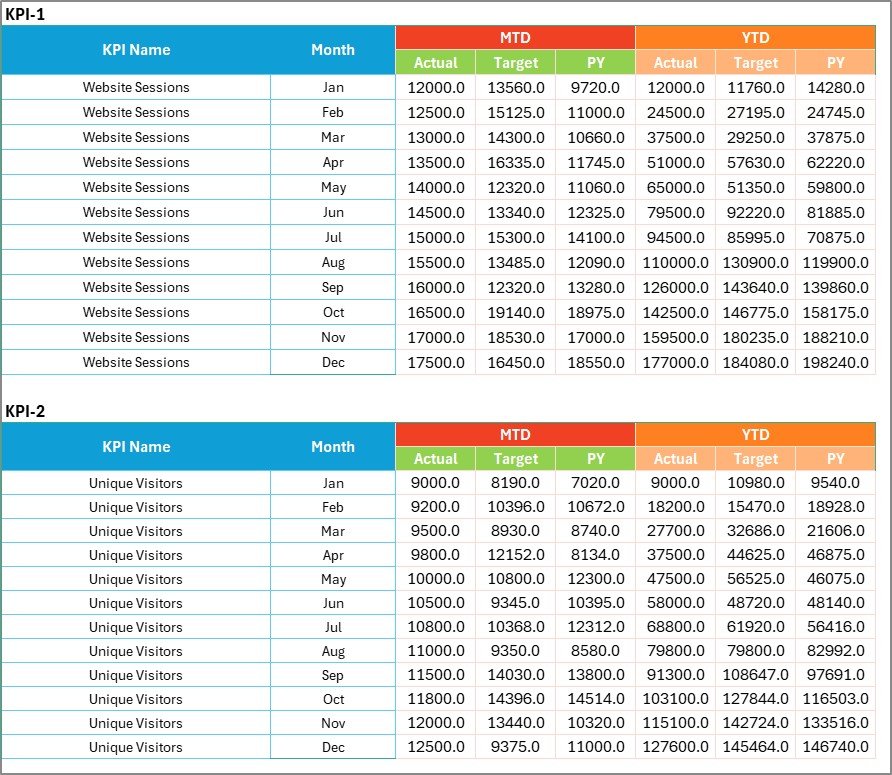
The Input Data Sheet is where users enter all KPI data.
Data Entry Functions
-
Enter actual KPI values
-
Record target numbers
-
Update performance metrics regularly
Since the sheet connects directly to the scorecard, updates reflect instantly across reports.
Therefore, the template always stays current.
Click to Purchases Data Analytics KPI Scorecard in Excel
4️⃣ KPI Definition Sheet – KPI Documentation Hub
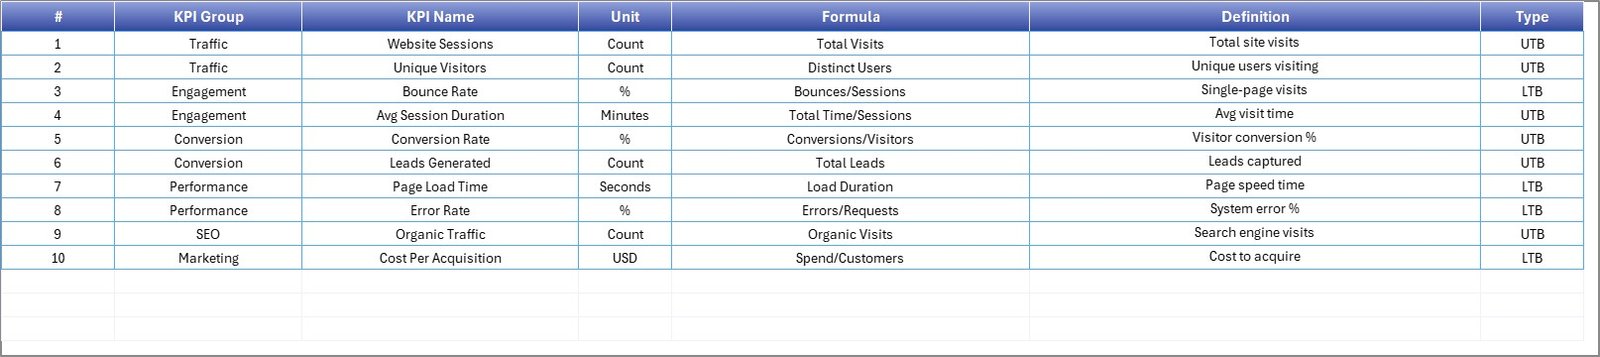
The KPI Definition Sheet stores detailed KPI information.
Users enter:
-
KPI Name
-
KPI Group
-
Unit of Measurement
-
Formula
-
KPI Definition
Centralized definitions ensure consistency across analytics teams.
Click to Purchases Data Analytics KPI Scorecard in Excel
Which KPIs Can Be Used in a Data Analytics Scorecard?
Organizations can customize KPIs depending on analytics goals.
Common Data Analytics KPIs
-
Report Usage Rate
-
Dashboard Adoption Rate
-
Data Accuracy Percentage
-
Query Response Time
-
Data Refresh Success Rate
-
Analytics Project Completion Rate
-
Insight Adoption Rate
-
Data Quality Score
-
User Satisfaction Score
-
Automated Report Ratio
Tracking these metrics ensures analytics maturity.
How Does the KPI Scorecard Improve Decision-Making?
Data alone does not create value. However, structured insights drive action.
The scorecard helps leaders:
-
Evaluate analytics ROI
-
Identify underperforming areas
-
Improve reporting efficiency
-
Align analytics strategy with business goals
Consequently, organizations make faster and smarter decisions.
Click to Purchases Data Analytics KPI Scorecard in Excel
Advantages of Data Analytics KPI Scorecard in Excel
✅ Centralized Performance Monitoring
All analytics KPIs remain in one structured location.
✅ Easy Implementation
Excel familiarity reduces learning time.
✅ Automated Performance Tracking
Formulas calculate results automatically.
✅ Visual Performance Indicators
Color coding simplifies analysis.
✅ Flexible Customization
Organizations adapt KPIs easily.
✅ Cost-Effective Solution
No expensive analytics platforms required.
How to Implement the Data Analytics KPI Scorecard?
Follow these steps for successful deployment:
-
Define analytics KPIs aligned with business goals
-
Enter KPI definitions into the Definition sheet
-
Set target values
-
Input actual performance data regularly
-
Review trends monthly
-
Conduct performance review meetings
Consistency ensures meaningful insights.
Best Practices for the Data Analytics KPI Scorecard
✔ Define Clear KPIs
Avoid vague or unclear performance measures.
✔ Update Data Frequently
Regular updates maintain accuracy.
✔ Focus on Actionable Metrics
Track KPIs that influence decisions.
✔ Monitor Trends Over Time
Analyze improvement patterns rather than single values.
✔ Standardize Definitions
Ensure all stakeholders interpret KPIs consistently.
✔ Train Users
Help teams understand how to interpret results.
Click to Purchases Data Analytics KPI Scorecard in Excel
How Does This Scorecard Support Analytics Maturity?
Analytics maturity grows when organizations measure performance consistently.
Because the scorecard tracks improvement over time, teams can:
-
Identify performance gaps
-
Improve data governance
-
Enhance reporting processes
-
Increase insight adoption
Over time, analytics becomes a strategic business asset.
Who Should Use This KPI Scorecard?
This template benefits multiple roles:
-
Data Analysts
-
Business Intelligence Teams
-
Analytics Managers
-
Operations Leaders
-
Executives
-
Data Governance Teams
Both small and large organizations can implement it successfully.
Why Use Excel for KPI Scorecards?
Although advanced BI tools exist, Excel remains highly practical.
Excel Advantages
-
Widely available
-
Easy to customize
-
Fast implementation
-
Flexible data handling
-
Low learning curve
Therefore, Excel provides an accessible analytics performance solution.
Click to Purchases Data Analytics KPI Scorecard in Excel
Common Mistakes to Avoid When Using KPI Scorecards
Avoid these common issues:
-
Tracking too many KPIs
-
Ignoring data updates
-
Setting unrealistic targets
-
Poor KPI documentation
-
Lack of performance reviews
Avoiding these mistakes improves scorecard effectiveness.
Future of Data Analytics KPI Monitoring
As analytics evolves, KPI scorecards will integrate with:
-
Automated data pipelines
-
AI-driven analytics tools
-
Real-time dashboards
-
Predictive analytics models
However, structured KPI measurement will always remain essential.
Conclusion
The Data Analytics KPI Scorecard in Excel provides a simple yet powerful way to measure analytics performance. Instead of relying on disconnected reports, organizations gain structured visibility into KPI outcomes and trends.
Because the scorecard combines automation, visualization, and flexibility, teams improve accountability and decision-making. Moreover, Excel’s accessibility allows organizations to adopt performance monitoring quickly.
Companies that measure analytics performance consistently achieve stronger data-driven success.
Click to Purchases Data Analytics KPI Scorecard in Excel
Frequently Asked Questions (FAQs)
What is a Data Analytics KPI Scorecard?
It is a structured Excel template that tracks analytics performance using measurable KPIs and visual indicators.
Can I customize KPIs in this scorecard?
Yes. You can easily modify KPIs through the KPI Definition sheet.
How often should the scorecard be updated?
Most organizations update KPIs monthly, although weekly updates also work.
Do I need advanced Excel skills?
No. The template uses dropdown menus and structured input sheets, making it beginner-friendly.
Can this scorecard track historical trends?
Yes. The KPI Trend sheet displays MTD and YTD performance trends.
Is this suitable for small businesses?
Yes. Small and medium businesses benefit greatly because implementation remains simple.
Why are visual indicators important?
Visual indicators allow users to understand performance status instantly without complex analysis.
Click to Purchases Data Analytics KPI Scorecard in Excel
Visit our YouTube channel to learn step-by-step video tutorials