The renewable energy industry continues to expand rapidly. Among all clean energy sources, geothermal energy stands out because it provides stable, continuous, and environmentally friendly power generation. However, managing geothermal plants requires constant monitoring, accurate reporting, and performance evaluation. Without structured analytics, organizations struggle to track efficiency, control operational costs, and optimize energy output.
Therefore, companies increasingly rely on data-driven performance tracking systems. One powerful solution is the Geothermal Energy KPI Dashboard in Excel — a ready-to-use analytical tool designed to monitor geothermal plant performance using measurable Key Performance Indicators (KPIs).
In this comprehensive guide, you will learn what a Geothermal Energy KPI Dashboard is, why it matters, how it works, which KPIs you should track, and how organizations can improve operational performance using Excel-based analytics.
Click to Purchases Geothermal Energy KPI Dashboard in Excel
What Is a Geothermal Energy KPI Dashboard in Excel?
A Geothermal Energy KPI Dashboard in Excel is an interactive performance monitoring system that helps energy companies track operational, technical, environmental, and financial KPIs in one centralized platform.
Instead of reviewing multiple reports, plant managers can monitor performance metrics from a single dashboard. As a result, decision-makers identify problems faster, compare targets with actual performance, and improve operational efficiency.
Moreover, Excel provides flexibility, automation, and ease of use. Therefore, organizations can implement advanced analytics without investing in expensive software.
The dashboard combines:
-
Monthly performance tracking
-
Year-to-date analysis
-
Target vs Actual comparison
-
Previous year benchmarking
-
KPI trend monitoring
-
Structured data input system
Consequently, geothermal operators gain complete visibility into plant performance.
Click to Purchases Geothermal Energy KPI Dashboard in Excel
Why Is KPI Tracking Important in Geothermal Energy Projects?
Geothermal plants operate continuously. However, even small inefficiencies can reduce energy output and increase operational costs. Therefore, performance tracking becomes essential.
Key reasons KPI monitoring matters:
-
Helps optimize energy production efficiency
-
Improves equipment reliability
-
Reduces downtime risks
-
Supports sustainability reporting
-
Enhances financial planning
-
Enables data-driven decisions
Furthermore, renewable energy investors demand measurable performance metrics. Hence, KPI dashboards play a crucial role in reporting and compliance.
What Problems Do Energy Companies Face Without KPI Dashboards?
Many geothermal facilities still rely on manual spreadsheets. Although basic reporting exists, several challenges arise.
Common operational challenges:
-
Scattered data sources
-
Manual reporting delays
-
Lack of real-time insights
-
Difficult performance comparison
-
Poor historical tracking
-
Limited decision visibility
As a result, managers react late to operational issues. However, a centralized Excel dashboard solves these problems effectively.
Click to Purchases Geothermal Energy KPI Dashboard in Excel
Key Features of the Geothermal Energy KPI Dashboard in Excel
The dashboard includes 7 structured worksheets, each designed for a specific analytical purpose. Together, they create a complete performance management system.
1. Home Sheet – Central Navigation Hub
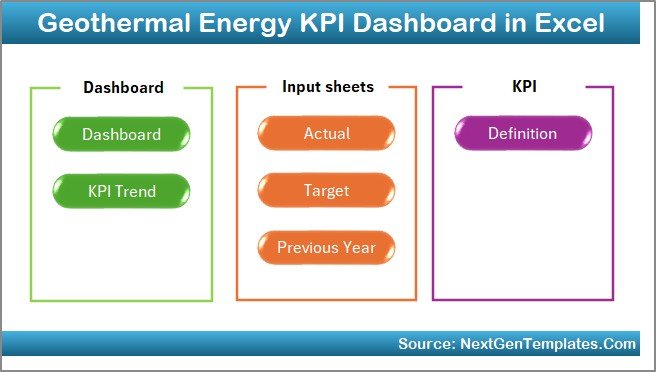
The Home Sheet works as an index page.
It includes six navigation buttons that allow users to jump directly to different worksheets. Therefore, users save time while navigating the dashboard.
Key benefits:
-
Easy navigation
-
User-friendly interface
-
Structured workflow
-
Quick access to analysis pages
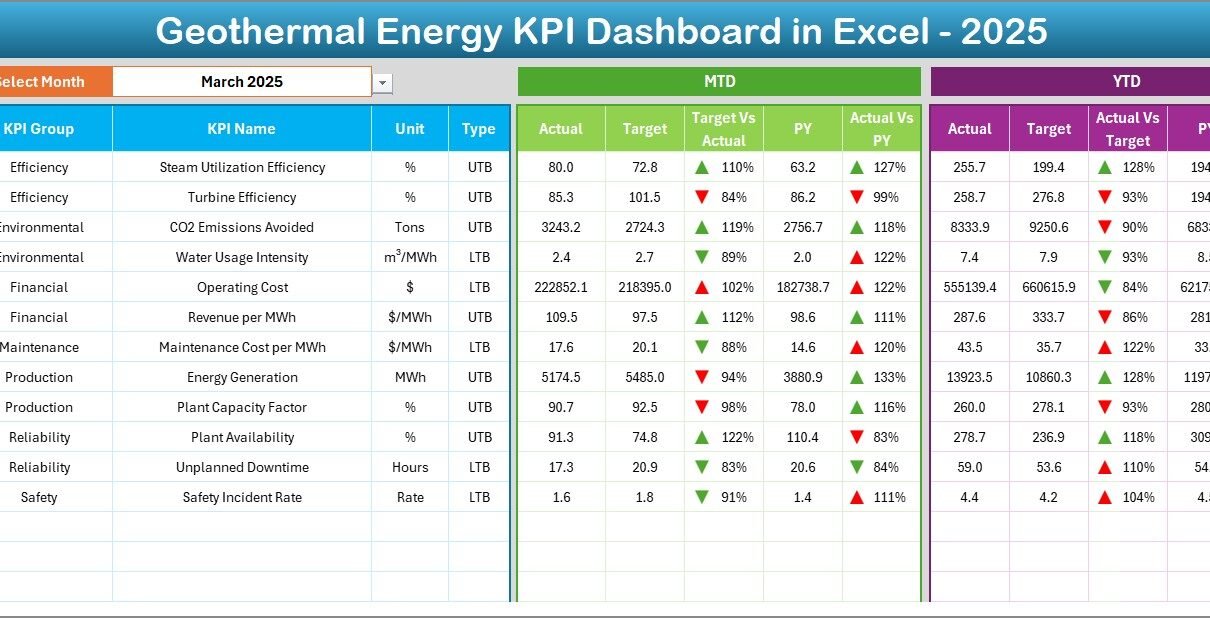
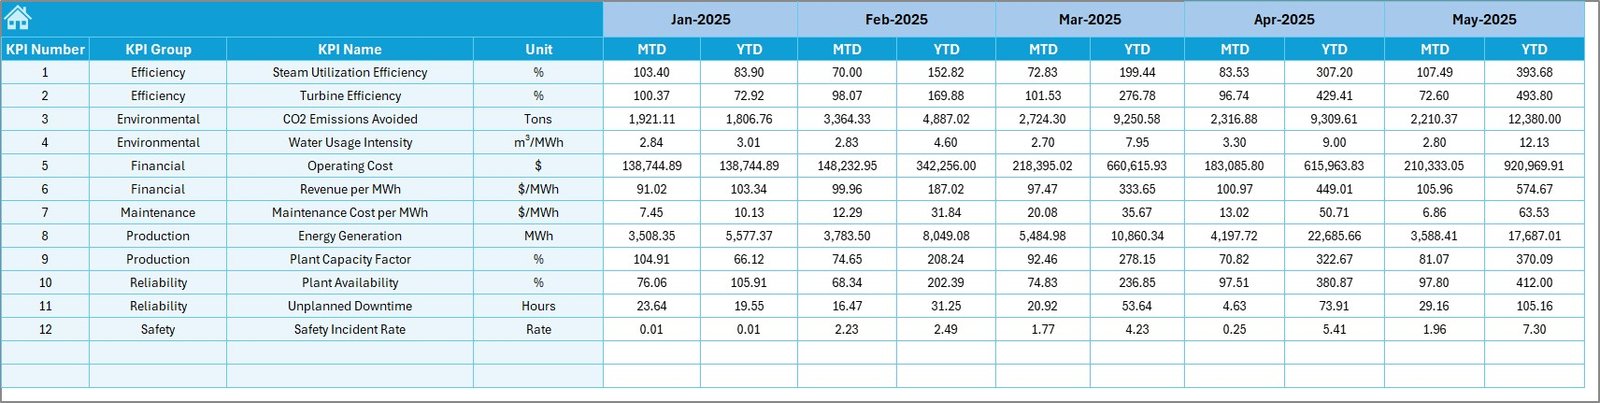
2. Dashboard Sheet – Main Performance Overview
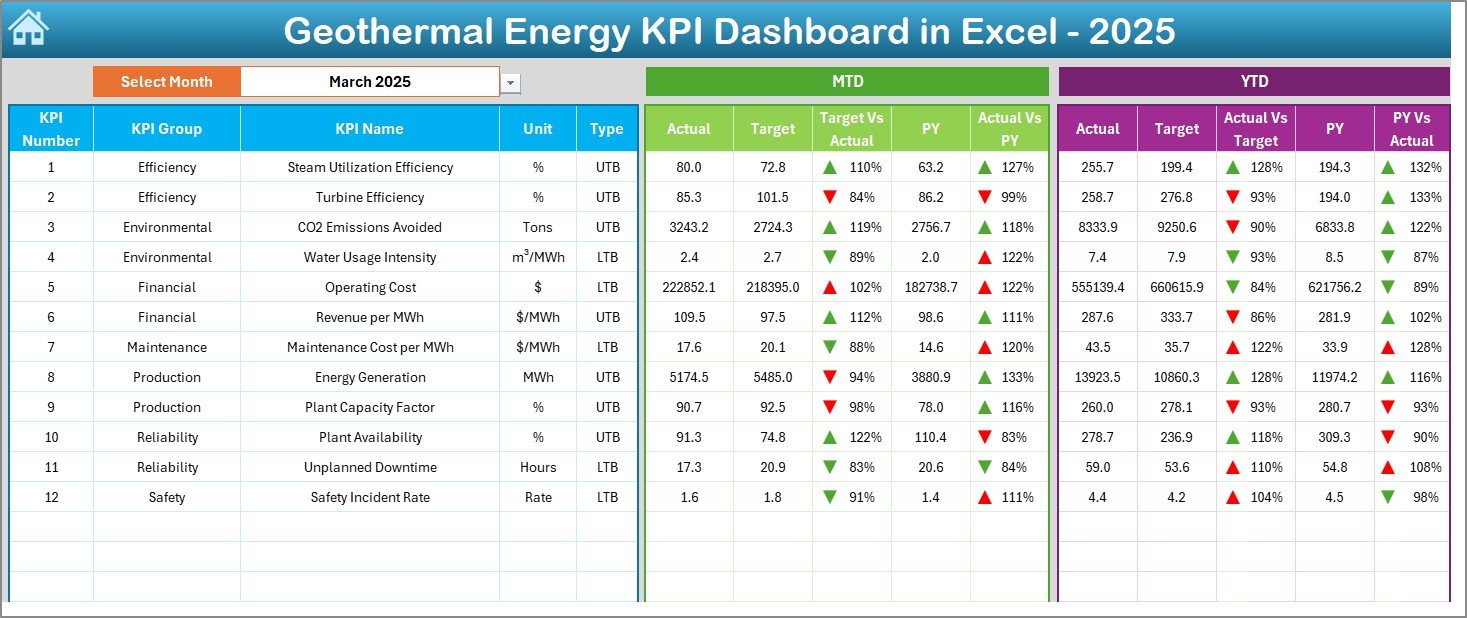
The Dashboard Sheet acts as the core analytical page.
Here, users can select a month from the dropdown located in cell D3. Immediately, the entire dashboard updates automatically.
Performance metrics displayed:
-
MTD (Month-To-Date) Actual values
-
Target values
-
Previous Year performance
-
Target vs Actual comparison
-
Previous Year vs Actual comparison
-
Conditional formatting indicators
Additionally, up/down arrows visually show performance direction. Therefore, managers quickly understand whether KPIs improve or decline.
The dashboard also displays:
-
YTD Actual data
-
YTD Target data
-
YTD Previous Year comparison
Consequently, both short-term and long-term performance remain visible.
Click to Purchases Geothermal Energy KPI Dashboard in Excel
3. KPI Trend Sheet – Performance Analysis Over Time
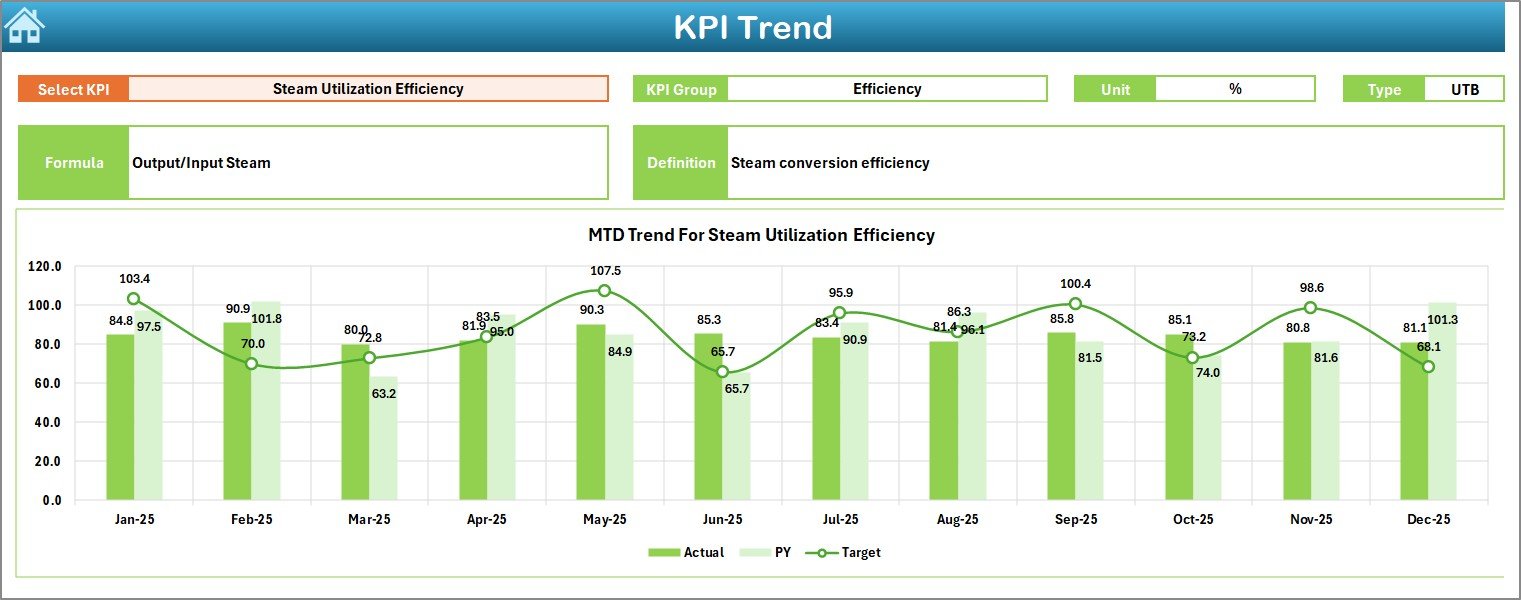
The KPI Trend Sheet allows deeper analysis.
Users select a KPI from the dropdown in cell C3, and the dashboard instantly displays detailed information.
Information shown:
-
KPI Group
-
KPI Unit
-
KPI Type (Lower is Better / Higher is Better)
-
KPI Formula
-
KPI Definition
Moreover, trend charts display:
-
MTD performance trends
-
YTD performance trends
-
Actual vs Target vs Previous Year comparisons
Therefore, managers can easily analyze performance patterns over time.
Click to Purchases Geothermal Energy KPI Dashboard in Excel
4. Actual Numbers Input Sheet – Data Entry System
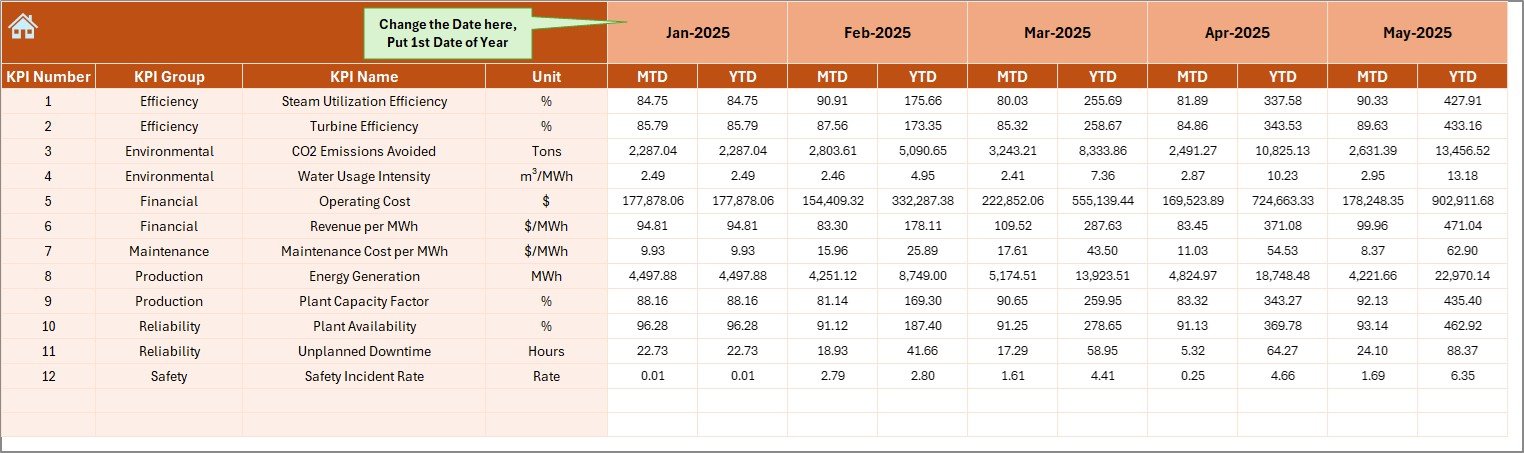
This sheet allows users to enter actual performance numbers.
Users only need to:
-
Select the starting month in cell E1
-
Enter monthly MTD and YTD actual values
Because of structured inputs, calculations update automatically throughout the dashboard.
As a result:
-
Manual calculations reduce significantly
-
Errors decrease
-
Reporting becomes faster
5. Target Sheet – KPI Goal Planning
The Target Sheet defines performance expectations.
Users enter:
-
Monthly targets
-
MTD targets
-
YTD targets
Since targets drive performance measurement, this sheet ensures accurate benchmarking.
Click to Purchases Geothermal Energy KPI Dashboard in Excel
6. Previous Year Numbers Sheet – Historical Comparison
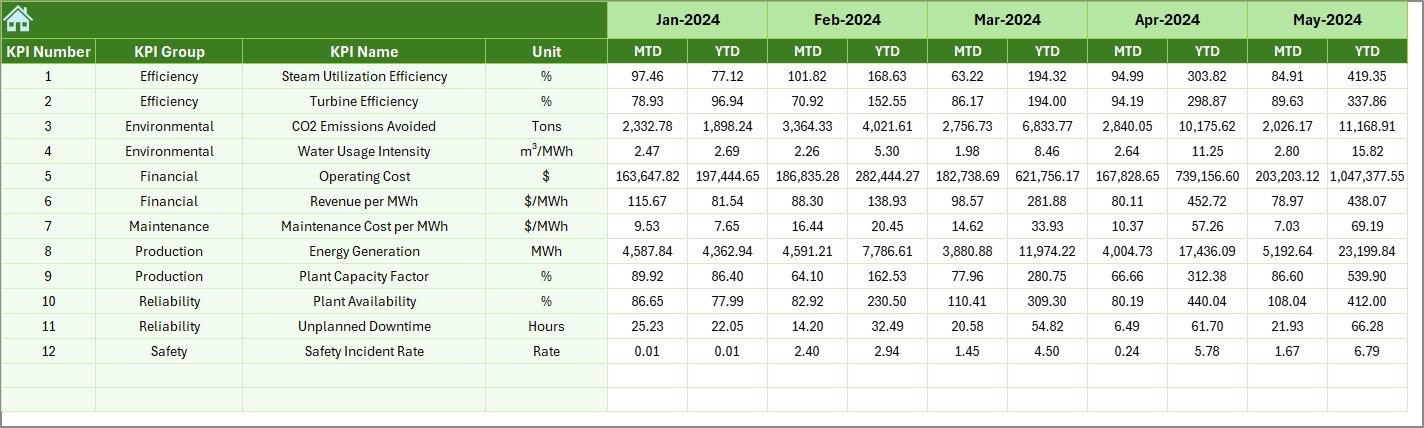
Historical data plays a major role in energy performance analysis.
In this sheet, users enter last year’s KPI numbers. The dashboard then compares current performance with past performance automatically.
Therefore, organizations can:
-
Identify growth trends
-
Evaluate improvement strategies
-
Forecast future performance
7. KPI Definition Sheet – KPI Documentation Center
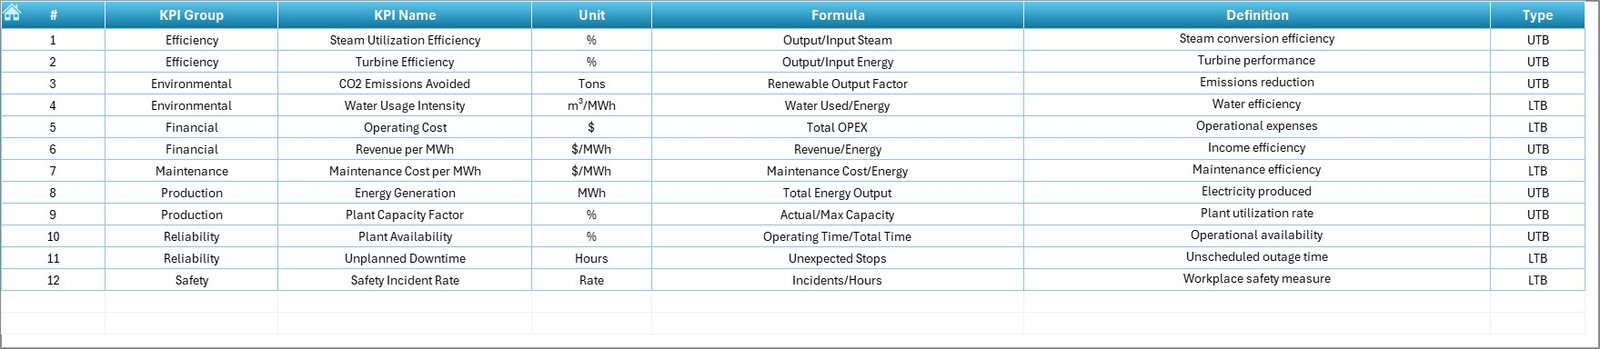
This sheet serves as the knowledge base.
Users define:
-
KPI Name
-
KPI Group
-
Measurement Unit
-
KPI Formula
-
KPI Definition
Consequently, every stakeholder understands KPI meaning clearly. This improves reporting consistency across departments.
Click to Purchases Geothermal Energy KPI Dashboard in Excel
Which KPIs Should You Track in Geothermal Energy Operations?
A geothermal dashboard typically tracks multiple KPI categories.
Operational KPIs
-
Energy generation output (MWh)
-
Plant availability
-
Capacity utilization rate
-
Downtime hours
-
Equipment efficiency
Financial KPIs
-
Cost per MWh
-
Operational expenditure
-
Revenue per unit energy
-
Maintenance cost ratio
Environmental KPIs
-
Carbon emission reduction
-
Water usage efficiency
-
Sustainability compliance score
Maintenance KPIs
-
Mean time between failures
-
Maintenance response time
-
Equipment reliability index
Tracking these KPIs ensures balanced performance monitoring.
How Does the Dashboard Improve Decision-Making?
Data visualization transforms raw numbers into actionable insights.
For example:
-
Managers quickly detect underperforming KPIs.
-
Engineers identify equipment inefficiencies.
-
Executives track financial outcomes.
-
Sustainability teams monitor environmental goals.
Therefore, decisions become proactive instead of reactive.
Click to Purchases Geothermal Energy KPI Dashboard in Excel
Advantages of Geothermal Energy KPI Dashboard in Excel
Using this dashboard provides multiple benefits.
✅ Centralized Performance Monitoring
All KPIs remain available in one location.
✅ Easy Monthly Tracking
Users switch months instantly using dropdown selection.
✅ Visual Performance Indicators
Conditional formatting simplifies analysis.
✅ Historical Comparison
Previous year benchmarking improves planning.
✅ Cost-Effective Solution
Excel eliminates expensive software investments.
✅ User-Friendly Interface
Even non-technical users can operate the dashboard.
✅ Faster Reporting
Automated calculations reduce manual work.
Click to Purchases Geothermal Energy KPI Dashboard in Excel
How to Use the Geothermal Energy KPI Dashboard Step by Step?
Step 1: Define KPIs
Enter KPI definitions in the KPI Definition sheet.
Step 2: Enter Targets
Input monthly targets in the Target Sheet.
Step 3: Add Previous Year Data
Enter historical numbers for comparison.
Step 4: Input Actual Data
Update actual performance monthly.
Step 5: Select Month
Choose month from dashboard dropdown.
Step 6: Analyze Trends
Use KPI Trend Sheet for performance evaluation.
Click to Purchases Geothermal Energy KPI Dashboard in Excel
Best Practices for the Geothermal Energy KPI Dashboard
To maximize dashboard effectiveness, follow these best practices.
✔ Maintain Data Accuracy
Always verify input data before updating.
✔ Update Data Regularly
Monthly updates ensure reliable insights.
✔ Focus on Actionable KPIs
Track metrics linked directly to performance goals.
✔ Use Standard KPI Definitions
Avoid confusion across departments.
✔ Monitor Trends Instead of Single Values
Trends reveal performance direction better.
✔ Train Team Members
Ensure users understand dashboard functionality.
✔ Review KPIs Periodically
Adjust KPIs according to operational changes.
How Does Excel Help Renewable Energy Analytics?
Excel remains powerful because:
-
It supports formulas and automation.
-
It integrates charts easily.
-
It allows customization.
-
It works without specialized BI tools.
Moreover, Excel dashboards require minimal technical setup. Therefore, small and large energy companies both benefit.
Click to Purchases Geothermal Energy KPI Dashboard in Excel
Who Can Benefit from This Dashboard?
The dashboard supports multiple stakeholders.
Energy Plant Managers
Monitor daily and monthly performance.
Operations Engineers
Track efficiency and downtime metrics.
Financial Analysts
Analyze cost and revenue KPIs.
Sustainability Officers
Monitor environmental targets.
Renewable Energy Consultants
Provide performance reports to clients.
Click to Purchases Geothermal Energy KPI Dashboard in Excel
Why Choose Excel Instead of Complex BI Tools?
Although advanced BI tools exist, Excel offers unique advantages.
-
Faster deployment
-
Lower cost
-
Easy customization
-
Familiar interface
-
Offline accessibility
Therefore, Excel remains ideal for operational KPI monitoring.
Future of KPI Dashboards in Geothermal Energy
As renewable energy adoption increases, performance analytics will become even more important.
Future dashboards may include:
-
Automated data integration
-
IoT sensor connectivity
-
Predictive analytics
-
AI-based performance forecasting
However, Excel dashboards already provide a strong foundation for structured analytics.
Conclusion
The Geothermal Energy KPI Dashboard in Excel provides a practical and powerful solution for monitoring renewable energy performance. Instead of relying on scattered reports, organizations gain a centralized system that tracks operational, financial, and environmental KPIs efficiently.
Moreover, the dashboard simplifies data entry, automates calculations, and visualizes trends clearly. As a result, decision-makers improve plant performance, reduce operational risks, and enhance sustainability outcomes.
Therefore, whether you manage a geothermal plant, analyze renewable energy performance, or oversee sustainability initiatives, this dashboard helps transform raw data into meaningful insights.
Click to Purchases Geothermal Energy KPI Dashboard in Excel
Frequently Asked Questions (FAQs)
What is a KPI dashboard in geothermal energy?
A KPI dashboard tracks operational and financial performance metrics of geothermal plants using measurable indicators.
Why should geothermal companies use Excel dashboards?
Excel dashboards provide affordable, flexible, and easy-to-use performance monitoring without complex software.
Can beginners use this dashboard?
Yes. The dashboard includes structured sheets and simple navigation, making it beginner-friendly.
How often should KPI data be updated?
Organizations should update KPI data monthly for accurate analysis.
Does the dashboard support historical comparison?
Yes. It compares current performance with previous year data automatically.
Can KPIs be customized?
Absolutely. Users can modify KPI definitions and formulas based on operational needs.
Is this dashboard suitable for other renewable energy sectors?
Yes. The structure can adapt to solar, wind, and hydro energy performance tracking.
Click to Purchases Geothermal Energy KPI Dashboard in Excel
Visit our YouTube channel to learn step-by-step video tutorials