Consumer electronics companies handle thousands of service requests every month. Customers expect fast repairs, quick responses, and high-quality service experiences. However, managing service data manually creates confusion, delays decision-making, and reduces customer satisfaction.
Therefore, organizations now prefer structured dashboards that provide real-time insights into service operations. One powerful solution is the Consumer Electronics Service Dashboard in Excel — a ready-to-use analytical tool designed to monitor service performance, customer satisfaction, service costs, and revenue in one centralized platform.
In this comprehensive guide, you will learn everything about the Consumer Electronics Service Dashboard in Excel, including its structure, features, benefits, analysis capabilities, best practices, and frequently asked questions. Moreover, you will understand how this dashboard transforms raw service data into actionable business insights.
Click to Purchases Consumer Electronics Service Dashboard in Excel
What Is a Consumer Electronics Service Dashboard in Excel?
A Consumer Electronics Service Dashboard in Excel is an interactive reporting system that tracks and analyzes after-sales service operations using charts, KPIs, slicers, and automated calculations.
Instead of reviewing multiple spreadsheets, managers analyze all service metrics from a single dashboard interface. As a result, teams identify problems faster, improve service efficiency, and increase customer satisfaction.
This dashboard helps organizations:
-
Monitor service requests and completion rates
-
Track customer satisfaction levels
-
Analyze service costs and revenue
-
Evaluate performance by product category and service type
-
Measure resolution time efficiency
-
Identify high-priority service issues
Consequently, decision-makers gain clarity and control over service operations.
Why Is Service Performance Tracking Important in Consumer Electronics?
Consumer electronics products require ongoing maintenance and repair services. Customers judge brands not only by product quality but also by service experience.
Without proper monitoring:
-
Service delays increase
-
Costs rise unexpectedly
-
Customer complaints grow
-
Revenue opportunities decline
However, when companies use structured dashboards, they can quickly detect operational gaps and improve service delivery.
Therefore, service analytics becomes a competitive advantage.
Key Features of the Consumer Electronics Service Dashboard in Excel
Click to Purchases Consumer Electronics Service Dashboard in Excel
This dashboard comes as a ready-to-use Excel file designed for easy navigation and powerful analysis.
Page Navigator
The Page Navigator, located on the left side, allows users to switch between analytical pages instantly. Because of this feature, users move across reports without searching through worksheets.
Additionally, it improves user experience and saves time during analysis.
Dashboard Structure: 5 Powerful Analytical Pages
The dashboard includes five interactive pages, each focusing on a specific service performance dimension.
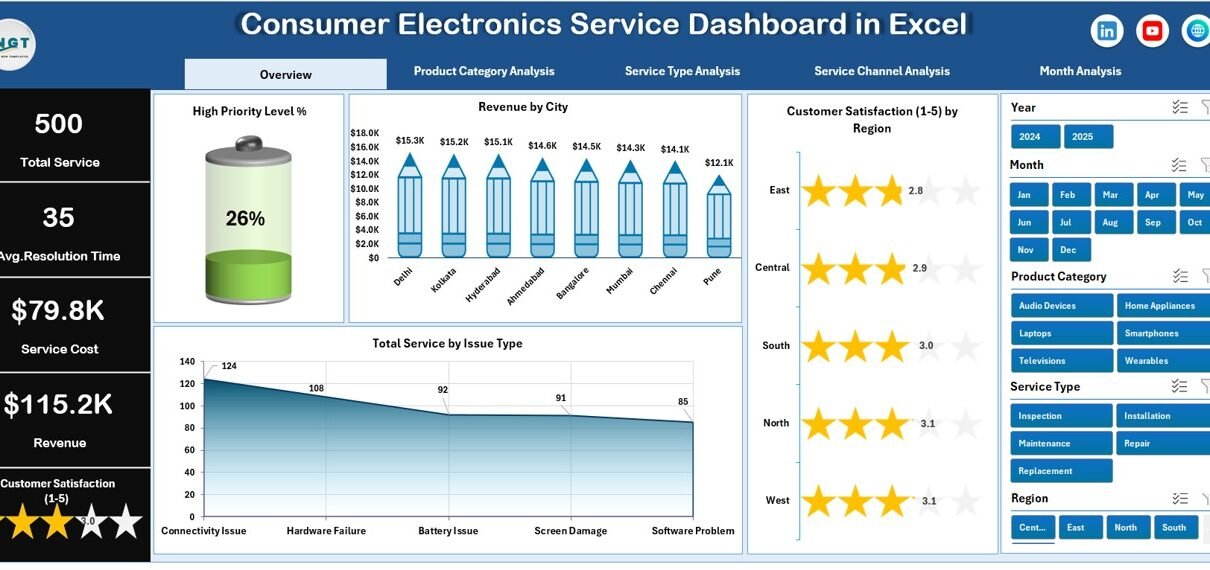
1. Overview Page – Complete Service Performance Snapshot
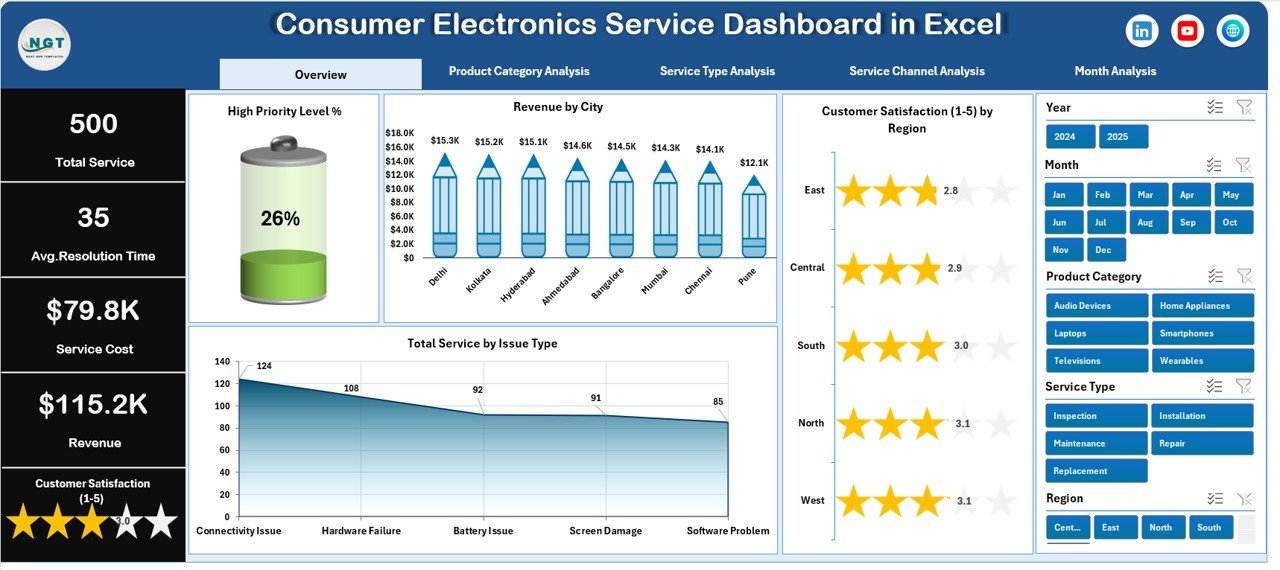
The Overview Page works as the main dashboard screen. It provides a quick summary of overall service operations.
Key Elements
-
Right-side slicers for dynamic filtering
-
Four KPI cards showing important metrics
-
Four analytical charts
Charts Included
-
High Priority Level %
-
Revenue by City
-
Customer Satisfaction by Region
-
Total Service by Issue Type
Because this page summarizes all major KPIs, managers quickly understand business performance without deep analysis.
Moreover, executives use this page for daily monitoring and performance reviews.
2. Product Category Analysis – Which Products Need More Service?
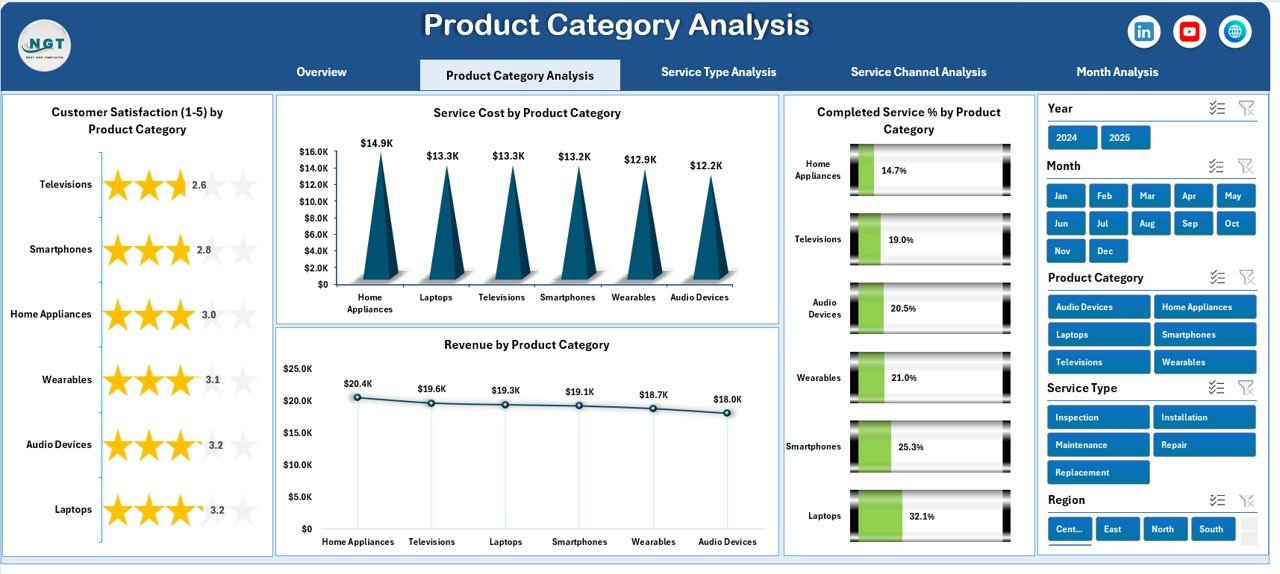
Different electronics categories show different service patterns. Therefore, analyzing product-wise performance becomes essential.
Charts Available
-
Customer Satisfaction by Product Category
-
Service Cost by Product Category
-
Completed Service % by Product Category
-
Revenue by Product Category
This page helps businesses identify:
-
Products causing frequent service issues
-
High-cost product categories
-
Revenue-generating product segments
As a result, companies improve product quality and optimize service strategies.
3. Service Type Analysis – Understanding Service Operations
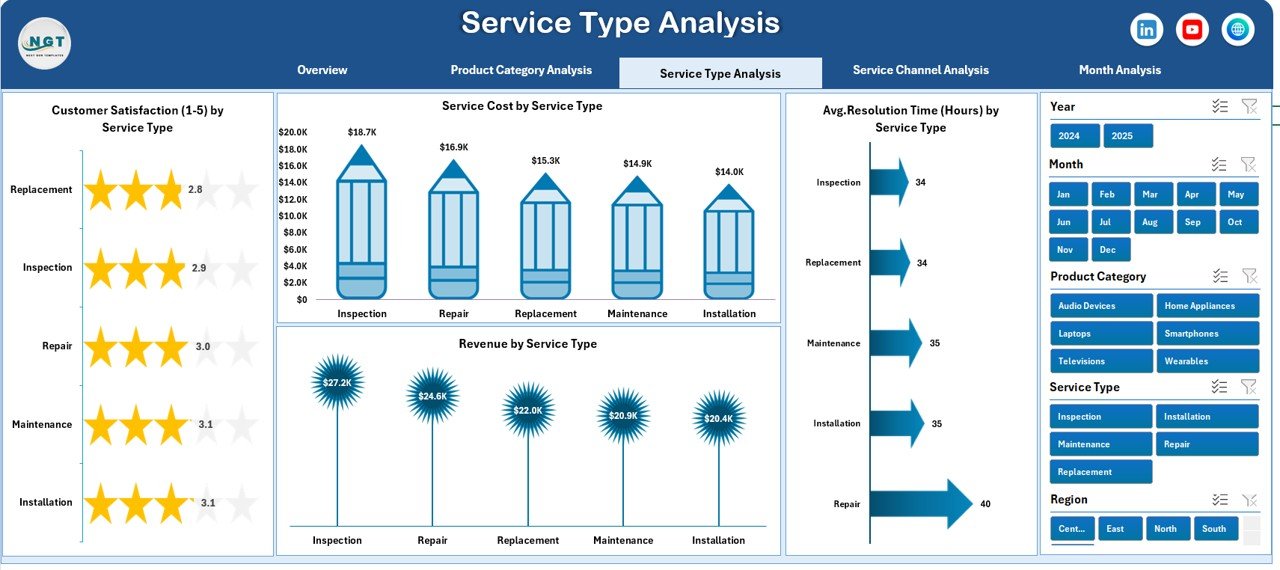
Service centers perform multiple service types such as repair, installation, maintenance, and replacement. Each service type impacts cost and customer experience differently.
Charts Included
-
Customer Satisfaction by Service Type
-
Service Cost by Service Type
-
Average Resolution Time by Service Type
-
Revenue by Service Type
Because managers compare service performance easily, they allocate resources more efficiently.
Furthermore, teams reduce resolution time by identifying slow service categories.
Click to Purchases Consumer Electronics Service Dashboard in Excel
4. Service Channel Analysis – Which Channel Performs Best?
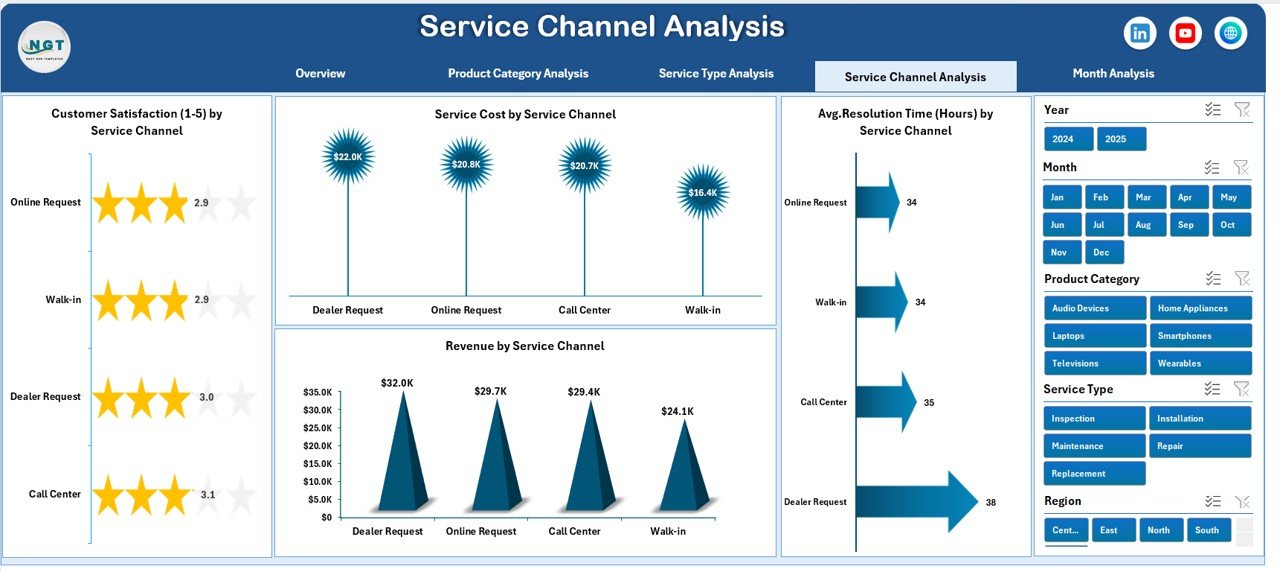
Customers request service through multiple channels such as:
-
Online requests
-
Call centers
-
Service centers
-
Partner vendors
Therefore, tracking channel performance becomes necessary.
Charts Included
-
Customer Satisfaction by Service Channel
-
Service Cost by Service Channel
-
Average Resolution Time by Service Channel
-
Revenue by Service Channel
This analysis reveals which channels deliver faster service and higher satisfaction.
Consequently, companies invest more in high-performing channels.
5. Month Analysis – Tracking Trends Over Time
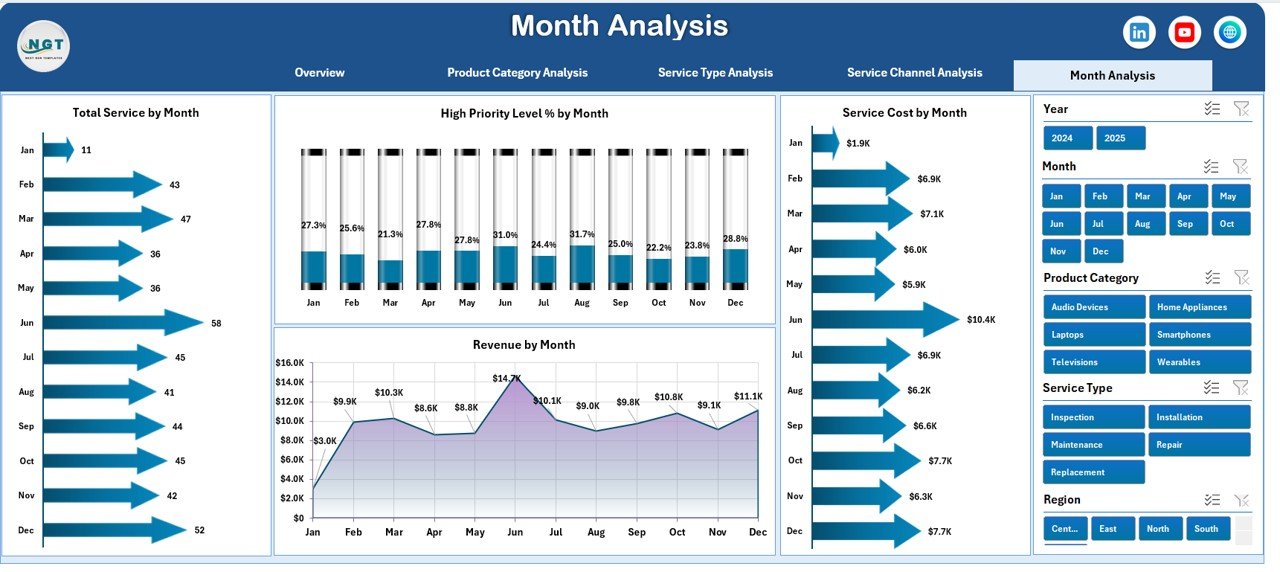
Trend analysis helps businesses understand seasonal patterns and operational performance.
Charts Included
-
High Priority Level by Month
-
Service Cost by Month
-
Total Service by Month
-
Revenue by Month
Because monthly tracking shows performance changes, management predicts demand and prepares resources accordingly.
Supporting Components of the Dashboard
Support Sheet
The Support Sheet manages backend calculations, helper formulas, and intermediate data structures. Although users rarely interact with it, this sheet ensures smooth dashboard performance.
Data Sheet
The Data Sheet stores all service records such as:
-
Service ID
-
Product Category
-
Service Type
-
Service Channel
-
City and Region
-
Cost and Revenue
-
Customer Satisfaction Score
-
Resolution Time
-
Priority Level
-
Service Date
Once users update this sheet, the dashboard automatically refreshes all charts.
Advantages of Consumer Electronics Service Dashboard in Excel
✅ Centralized Data Management
All service data stays in one place, which improves visibility and reduces errors.
✅ Faster Decision-Making
Managers analyze performance instantly instead of compiling manual reports.
✅ Improved Customer Satisfaction
Businesses quickly identify service delays and fix operational issues.
✅ Cost Optimization
Companies monitor service costs and reduce unnecessary expenses.
✅ Performance Transparency
Teams clearly understand targets and performance results.
✅ Easy Customization
Excel allows organizations to modify KPIs based on business needs.
How Does This Dashboard Improve Business Performance?
This dashboard transforms operational data into strategic insights.
For example:
-
Managers detect regions with low satisfaction scores.
-
Service heads monitor resolution time efficiency.
-
Finance teams analyze revenue trends.
-
Product teams identify defect-prone categories.
Therefore, every department benefits from shared analytics.
Who Can Use the Consumer Electronics Service Dashboard?
This dashboard suits multiple professionals:
-
Service Managers
-
Customer Support Teams
-
Operations Managers
-
Electronics Manufacturers
-
Repair Service Providers
-
Business Analysts
-
Franchise Service Networks
Because Excel remains widely accessible, even non-technical users can operate the dashboard easily.
How to Use the Consumer Electronics Service Dashboard in Excel?
Step 1: Enter Data
Add service records into the Data Sheet.
Step 2: Refresh Dashboard
Update pivot tables or refresh calculations.
Step 3: Apply Filters
Use slicers to analyze specific regions, products, or time periods.
Step 4: Analyze Insights
Review charts and KPI cards.
Step 5: Take Action
Improve operations based on insights.
Best Practices for the Consumer Electronics Service Dashboard in Excel
Maintain Clean Data
Always use consistent naming formats and accurate entries.
Update Data Regularly
Frequent updates ensure reliable insights.
Use Standard KPIs
Define measurable service indicators.
Monitor Trends Monthly
Trend analysis helps in forecasting demand.
Train Team Members
Ensure employees understand dashboard usage.
Review KPIs Weekly
Regular monitoring prevents operational delays.
Common Challenges and How to Overcome Them
Data Inconsistency
Create validation rules in Excel.
Slow Reporting
Automate calculations using formulas.
Lack of Insights
Focus on actionable KPIs instead of excessive metrics.
User Adoption Issues
Provide simple training and documentation.
Future Scope of Service Dashboards in Consumer Electronics
Click to Purchases Consumer Electronics Service Dashboard in Excel
As technology evolves, dashboards will integrate with:
-
IoT-enabled devices
-
AI-based service predictions
-
Automated ticket systems
-
Real-time cloud analytics
However, Excel dashboards remain highly valuable due to flexibility and affordability.
Why Choose Excel for Service Analytics?
Many organizations prefer Excel because:
-
It requires no additional software investment.
-
Users already understand Excel basics.
-
Customization becomes easy.
-
Data integration remains flexible.
Therefore, Excel continues to serve as a powerful analytics platform.
Conclusion
The Consumer Electronics Service Dashboard in Excel provides a smart and structured way to monitor service operations, customer satisfaction, costs, and revenue performance.
Instead of relying on scattered reports, businesses gain a centralized analytical system that improves decision-making and operational efficiency. Moreover, interactive charts and slicers allow users to explore insights quickly and accurately.
As customer expectations continue to rise, companies must adopt data-driven service management. Therefore, implementing this dashboard helps organizations deliver faster service, reduce costs, and build stronger customer relationships.
Ultimately, this dashboard transforms service management from reactive operations into proactive performance optimization.
Frequently Asked Questions (FAQs)
1. What is a Consumer Electronics Service Dashboard in Excel?
It is an interactive Excel-based tool that tracks service performance, costs, customer satisfaction, and operational metrics.
2. Can beginners use this dashboard?
Yes. The dashboard uses simple Excel features, so beginners can operate it easily.
3. Does the dashboard update automatically?
Yes. Once data updates in the Data Sheet, charts refresh after recalculation or pivot refresh.
4. Can I customize KPIs?
Absolutely. Users can modify KPIs based on business requirements.
5. Is this dashboard suitable for small businesses?
Yes. Both small and large organizations benefit from structured service analytics.
6. What data do I need to use this dashboard?
You need service records including product details, service type, cost, satisfaction score, and dates.
7. How often should I update the dashboard?
You should update it daily or weekly depending on service volume.
Visit our YouTube channel to learn step-by-step video tutorials