Cloud computing has transformed how organizations manage IT infrastructure. Businesses now rely on cloud platforms for storage, computing power, applications, and data management. However, as cloud adoption grows, managing costs, monitoring performance, and ensuring security become increasingly complex.
Without structured analytics, companies struggle to understand cloud usage patterns, control expenses, and optimize resource allocation. Therefore, organizations increasingly use Power BI dashboards to gain real-time visibility into cloud operations.
The Cloud Computing Dashboard in Power BI provides a powerful, ready-to-use analytics solution that helps organizations monitor cloud costs, storage usage, availability, and security performance using interactive visual reports.
In this comprehensive guide, you will learn how this dashboard works, its features, benefits, best practices, and how businesses can improve cloud management through data-driven insights.
Click to Purchases Cloud Computing Dashboard in Power BI
What Is a Cloud Computing Dashboard in Power BI?
A Cloud Computing Dashboard in Power BI is an interactive business intelligence tool designed to monitor cloud infrastructure performance, usage, and financial metrics through dynamic visualizations.
Instead of analyzing multiple reports from different cloud providers, users view all critical KPIs in one centralized dashboard.
As a result:
-
IT teams track cloud expenses efficiently.
-
Managers analyze usage trends.
-
Security teams monitor incidents.
-
Executives make informed strategic decisions.
Moreover, Power BI enables real-time filtering, interactive analysis, and professional reporting.
Why Do Organizations Need a Cloud Computing Dashboard?
Cloud environments generate large volumes of operational data. However, without proper monitoring tools, businesses often face serious challenges.
Common Cloud Management Challenges
-
Unexpected cloud cost increases
-
Lack of budget visibility
-
Inefficient resource utilization
-
Poor availability tracking
-
Security monitoring gaps
-
Difficulty analyzing multi-region deployments
Therefore, a structured dashboard becomes essential for effective cloud governance.
Click to Purchases Cloud Computing Dashboard in Power BI
Key Features of Cloud Computing Dashboard in Power BI
This Power BI dashboard contains five analytical pages, each focusing on a different aspect of cloud performance monitoring.
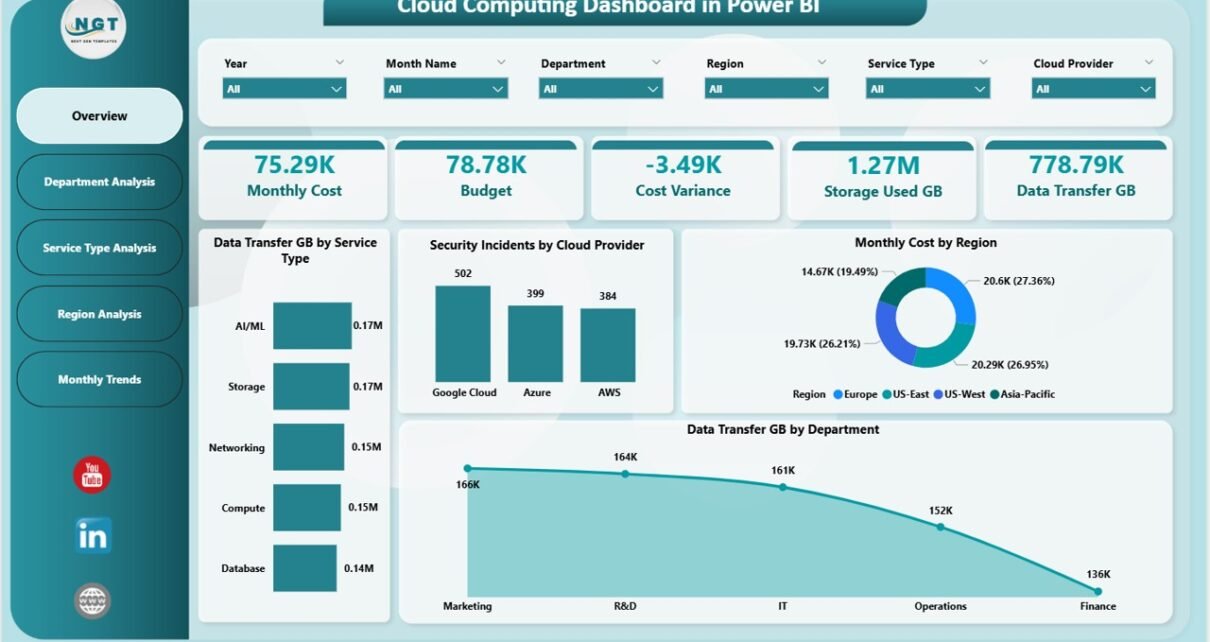
1. Overview Page – Central Cloud Performance Summary
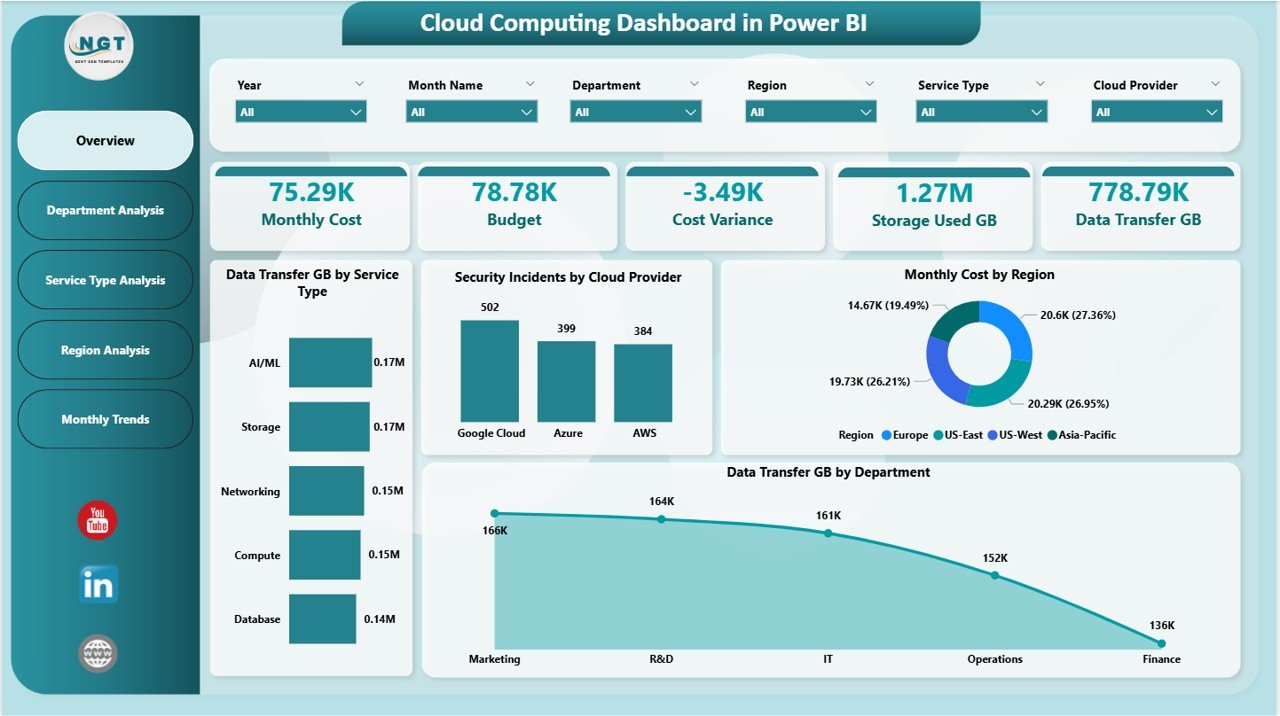
The Overview Page serves as the main dashboard.
Users can apply slicers (filters) to analyze data dynamically.
KPI Cards Displayed
The dashboard shows five key performance indicators:
-
Monthly Cost – Total cloud spending
-
Budget – Allocated cloud budget
-
Cost Variance – Difference between budget and actual cost
-
Storage Used (GB) – Total storage consumption
-
Data Transfer (GB) – Network data usage
These KPI cards provide an instant overview of cloud health and financial performance.
Charts on Overview Page
The page includes four visual charts:
Data Transfer GB by Service Type
Shows how different cloud services consume network bandwidth.
Security Incidents by Cloud Provider
Helps identify providers experiencing higher security issues.
Monthly Cost by Region
Displays spending distribution across geographic locations.
Data Transfer GB by Department
Highlights departmental usage patterns.
Therefore, decision-makers quickly identify cost drivers.
Click to Purchases Cloud Computing Dashboard in Power BI
2. Department Analysis Page – Department-Level Insights
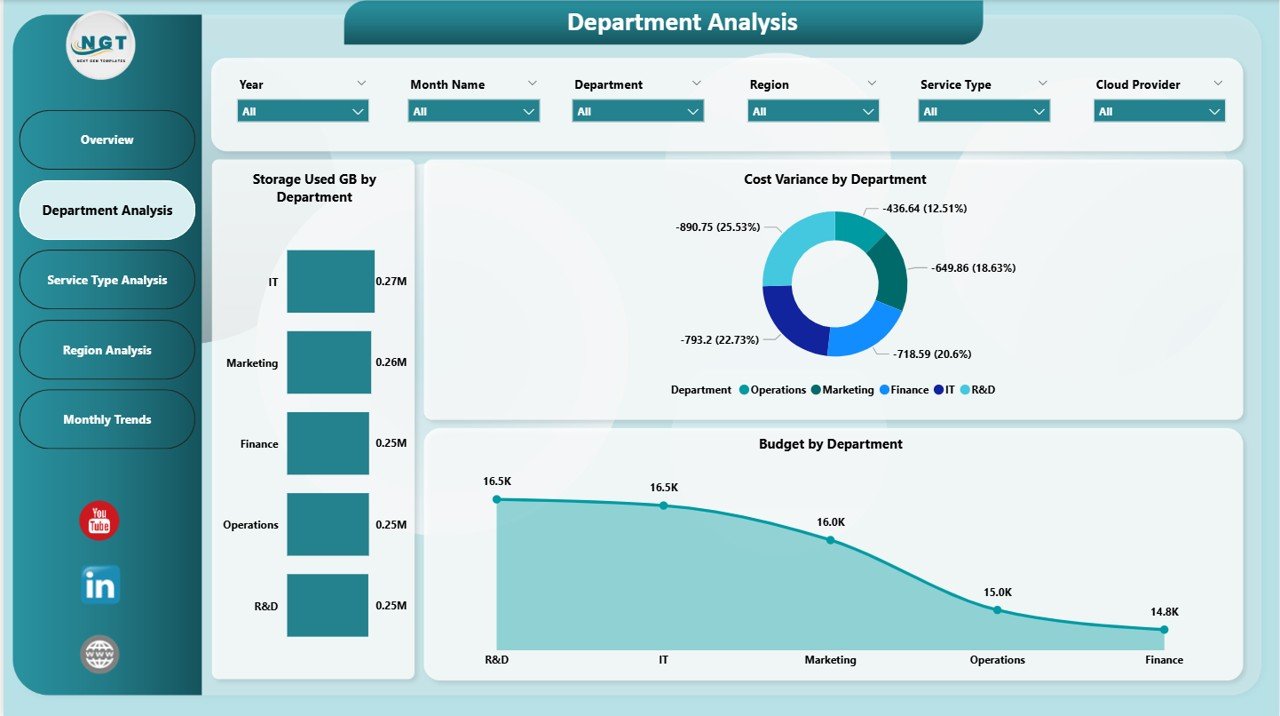
The Department Analysis Page focuses on resource usage across departments.
Charts Included
-
Storage Used GB by Department
-
Cost Variance by Department
-
Budget by Department
This analysis helps organizations understand which departments consume the most resources.
Consequently, managers allocate budgets more effectively.
Click to Purchases Cloud Computing Dashboard in Power BI
3. Service Type Analysis Page – Service Performance Monitoring
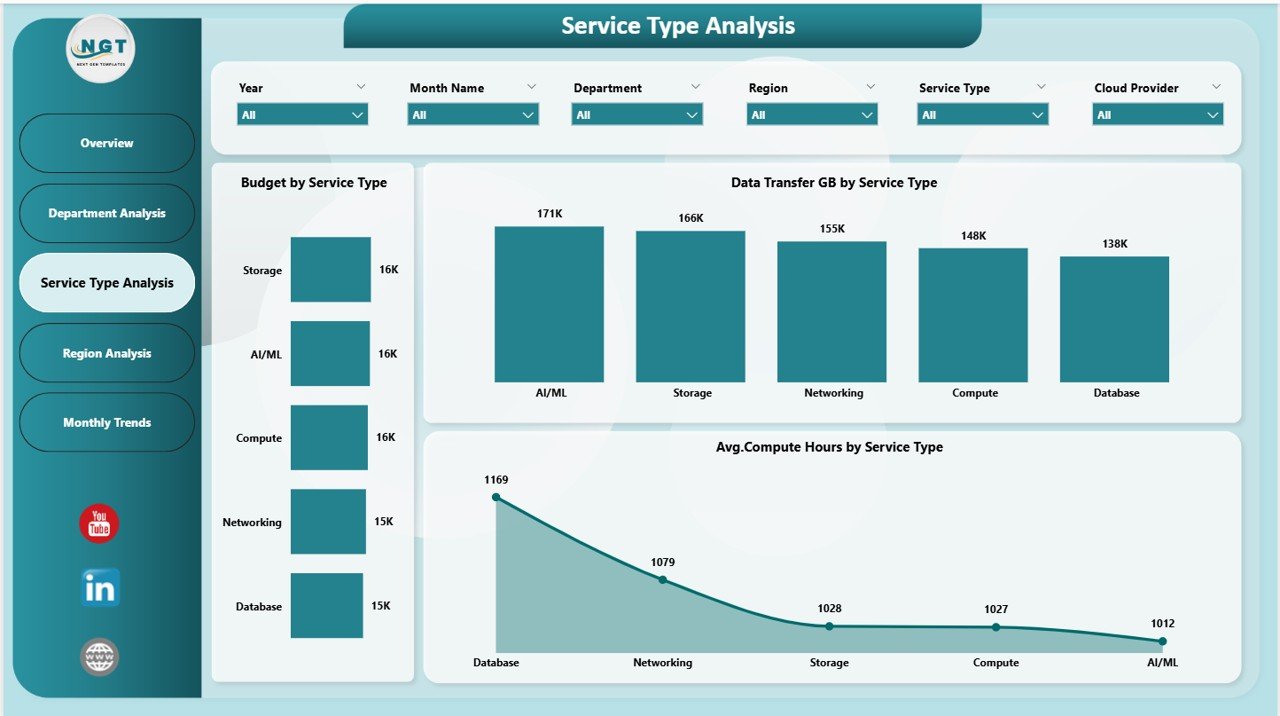
Cloud services vary significantly in cost and performance. Therefore, analyzing service-level metrics becomes critical.
Charts Included
-
Budget by Service Type
-
Data Transfer GB by Service Type
-
Average Compute Hours by Service Type
These visuals help teams evaluate service efficiency and optimize workloads.
4. Region Analysis Page – Geographic Cloud Insights
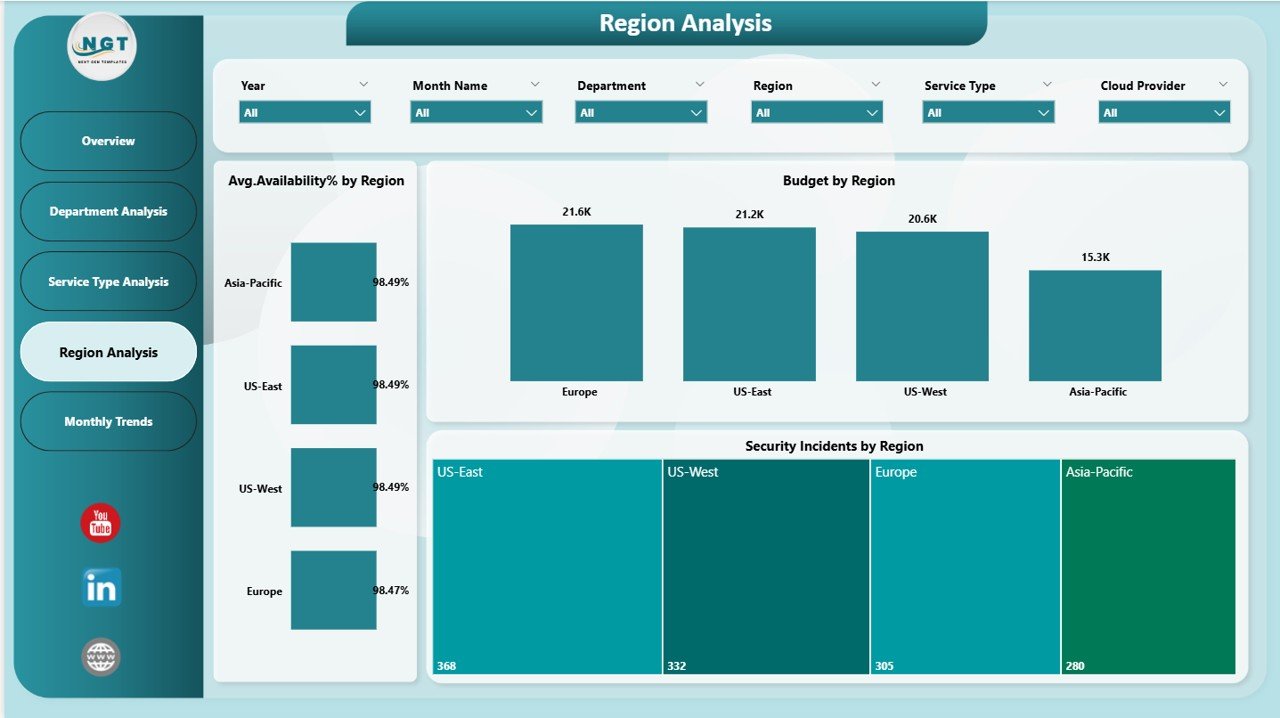
Cloud infrastructure often spans multiple regions.
The Region Analysis Page helps monitor regional performance.
Charts Included
-
Budget by Region
-
Average Availability % by Region
-
Security Incidents by Region
This analysis allows organizations to compare regional reliability and security risks.
As a result, IT leaders make better deployment decisions.
Click to Purchases Cloud Computing Dashboard in Power BI
5. Monthly Trends Page – Time-Based Performance Analysis
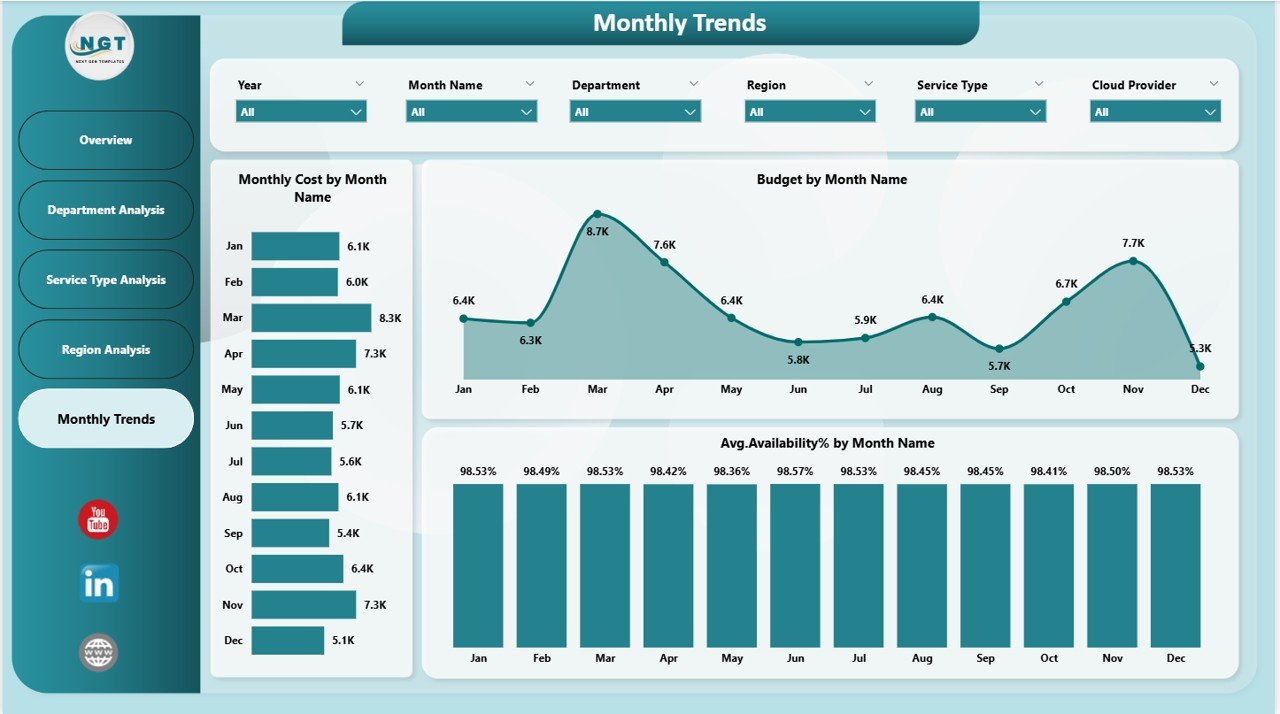
The Monthly Trends Page focuses on performance trends over time.
Charts Included
-
Budget by Month Name
-
Average Availability % by Month
-
Monthly Cost by Month
Trend analysis helps organizations identify seasonal cost patterns and performance fluctuations.
Therefore, forecasting becomes more accurate.
How Does the Dashboard Improve Cloud Cost Management?
Cloud costs often grow unnoticed. However, visualization changes how organizations manage spending.
The dashboard enables users to:
-
Track budget vs actual expenses
-
Identify high-cost services
-
Monitor departmental consumption
-
Detect cost anomalies early
-
Optimize resource allocation
Consequently, organizations reduce unnecessary spending.
Click to Purchases Cloud Computing Dashboard in Power BI
Advantages of Cloud Computing Dashboard in Power BI
✅ Centralized Cloud Monitoring
All metrics appear in one dashboard.
✅ Interactive Analysis
Users filter data dynamically using slicers.
✅ Cost Optimization Insights
Identify overspending areas quickly.
✅ Performance Visibility
Monitor availability and usage trends.
✅ Security Monitoring
Track incidents across providers and regions.
✅ Professional Reporting
Power BI visuals enhance presentation quality.
✅ Scalable Analytics
Supports growing cloud environments.
How to Use the Cloud Computing Dashboard?
Step 1: Load Data into Power BI
Import cloud usage and cost data.
Step 2: Refresh Dataset
Update visuals with latest data.
Step 3: Use Slicers
Filter by department, service, or region.
Step 4: Analyze KPI Cards
Review overall performance indicators.
Step 5: Explore Analysis Pages
Investigate department, service, and region insights.
Step 6: Monitor Trends
Use Monthly Trends page for forecasting.
Click to Purchases Cloud Computing Dashboard in Power BI
Best Practices for the Cloud Computing Dashboard
To maximize dashboard value, follow these practices.
✔ Update Data Regularly
Frequent updates ensure accurate analysis.
✔ Define Clear Budget Targets
Establish spending benchmarks.
✔ Monitor Cost Variance Weekly
Detect issues early.
✔ Optimize High Usage Services
Review compute-heavy workloads.
✔ Track Availability Metrics
Ensure service reliability.
✔ Review Security Incidents
Strengthen cloud governance.
✔ Share Insights Across Teams
Encourage data-driven culture.
Who Should Use This Dashboard?
This dashboard benefits multiple stakeholders.
Cloud Administrators
Monitor infrastructure performance.
IT Managers
Control costs and optimize resources.
Finance Teams
Track cloud spending vs budget.
Security Teams
Analyze incident patterns.
Executives
Gain strategic performance insights.
Click to Purchases Cloud Computing Dashboard in Power BI
Why Choose Power BI for Cloud Analytics?
Power BI provides several advantages:
-
Interactive visualizations
-
Real-time analytics
-
Easy integration with cloud data
-
Advanced filtering options
-
Professional reporting dashboards
Therefore, organizations achieve better cloud visibility without complex tools.
How Does Cloud Analytics Support Digital Transformation?
Cloud analytics enables organizations to:
-
Improve operational efficiency
-
Reduce infrastructure costs
-
Enhance service reliability
-
Strengthen cybersecurity awareness
-
Support data-driven innovation
Thus, dashboards play a central role in digital transformation strategies.
Click to Purchases Cloud Computing Dashboard in Power BI
Future of Cloud Computing Dashboards
Cloud analytics will continue evolving with technologies such as:
-
AI-driven cost optimization
-
Predictive workload management
-
Automated anomaly detection
-
Multi-cloud monitoring platforms
-
Real-time operational intelligence
However, Power BI dashboards already provide strong analytical capabilities today.
Conclusion
The Cloud Computing Dashboard in Power BI offers a comprehensive solution for monitoring cloud performance, costs, availability, and security metrics. By combining interactive visuals with structured analytics, organizations gain complete visibility into cloud operations.
Moreover, departments, services, and regions can be analyzed independently, enabling smarter decision-making and improved cost control. As businesses continue adopting cloud technologies, dashboards like this become essential tools for efficient IT management.
Therefore, organizations seeking better cloud governance and performance optimization should adopt a structured Power BI dashboard approach.
Click to Purchases Cloud Computing Dashboard in Power BI
Frequently Asked Questions (FAQs)
What is a Cloud Computing Dashboard?
It is a Power BI dashboard used to monitor cloud costs, usage, availability, and performance metrics.
Can this dashboard support multiple cloud providers?
Yes. It can analyze data from AWS, Azure, Google Cloud, or hybrid environments.
How often should data be refreshed?
Organizations typically refresh data daily or weekly.
Does the dashboard help reduce cloud costs?
Yes. It identifies cost variance and high usage areas.
Can beginners use this dashboard?
Yes. Power BI visuals make analysis easy to understand.
Is the dashboard customizable?
Absolutely. Users can modify visuals and KPIs based on requirements.
Click to Purchases Cloud Computing Dashboard in Power BI
Visit our YouTube channel to learn step-by-step video tutorials