Managing thrift stores requires balancing affordability, customer satisfaction, inventory turnover, and operational efficiency. However, many thrift store owners still rely on manual spreadsheets or disconnected reports to monitor performance. As a result, decision-making becomes slow, trends remain hidden, and revenue opportunities get missed.
Therefore, modern thrift businesses increasingly adopt data-driven dashboards to simplify analysis and improve visibility. One powerful solution is the Thrift Stores Dashboard in Power BI — a ready-to-use analytics system designed to transform raw retail data into meaningful insights.
In this comprehensive guide, you will learn everything about the Thrift Stores Dashboard in Power BI, including its features, dashboard pages, benefits, best practices, and frequently asked questions. Moreover, you will discover how this dashboard helps thrift store managers improve profitability and customer experience simultaneously.
Click to Purchases Thrift Stores Dashboard in Power BI
What Is a Thrift Stores Dashboard in Power BI?
A Thrift Stores Dashboard in Power BI is an interactive business intelligence solution that helps thrift store owners and retail managers track sales performance, customer ratings, product categories, item conditions, regional performance, and monthly trends using visual reports.
Instead of reviewing multiple spreadsheets, users analyze all business metrics in one centralized dashboard. Consequently, managers quickly identify high-performing categories, understand customer behavior, and make faster business decisions.
This dashboard allows organizations to:
-
Monitor revenue and transactions in real time
-
Analyze customer ratings and satisfaction levels
-
Track item condition performance
-
Compare regional store results
-
Evaluate monthly sales trends
-
Improve discount and pricing strategies
Why Do Thrift Stores Need a Power BI Dashboard?
Thrift stores operate differently from traditional retail businesses. Since inventory comes from donations and second-hand sourcing, product quality and pricing vary significantly. Therefore, managers must continuously analyze multiple factors.
Without structured analytics:
-
Revenue trends remain unclear
-
Popular product categories stay unidentified
-
Customer preferences go unnoticed
-
Discount strategies become ineffective
However, when businesses use Power BI dashboards, they gain instant visibility into operations. As a result, they improve planning, optimize inventory, and increase customer satisfaction.
How Does Power BI Transform Thrift Store Data?
Power BI converts raw Excel or database data into interactive visuals. Instead of manually calculating totals, users simply select filters and instantly view results.
For example:
-
Select a region to see local performance
-
Choose a month to analyze seasonal trends
-
Filter by item condition to evaluate quality impact
-
Compare product categories for revenue contribution
Because Power BI updates visuals dynamically, decision-makers always work with accurate insights.
Key Features of the Thrift Stores Dashboard in Power BI
The Thrift Stores Dashboard includes five powerful report pages, each designed to answer specific business questions.
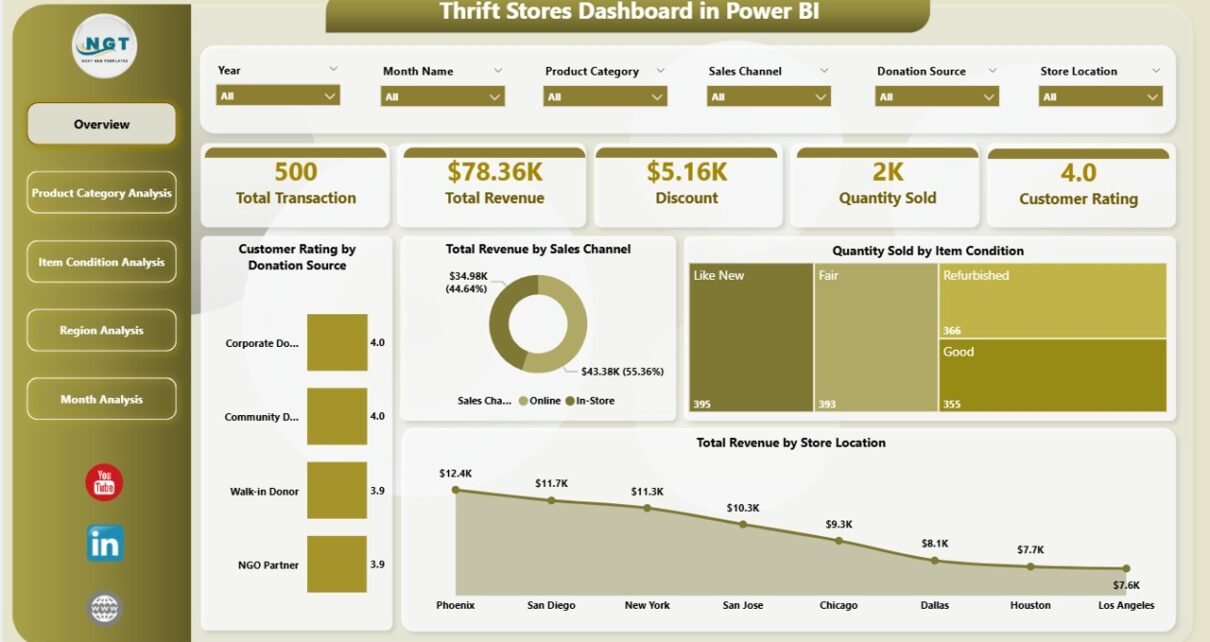
1. Overview Page – What Is Happening in the Business?
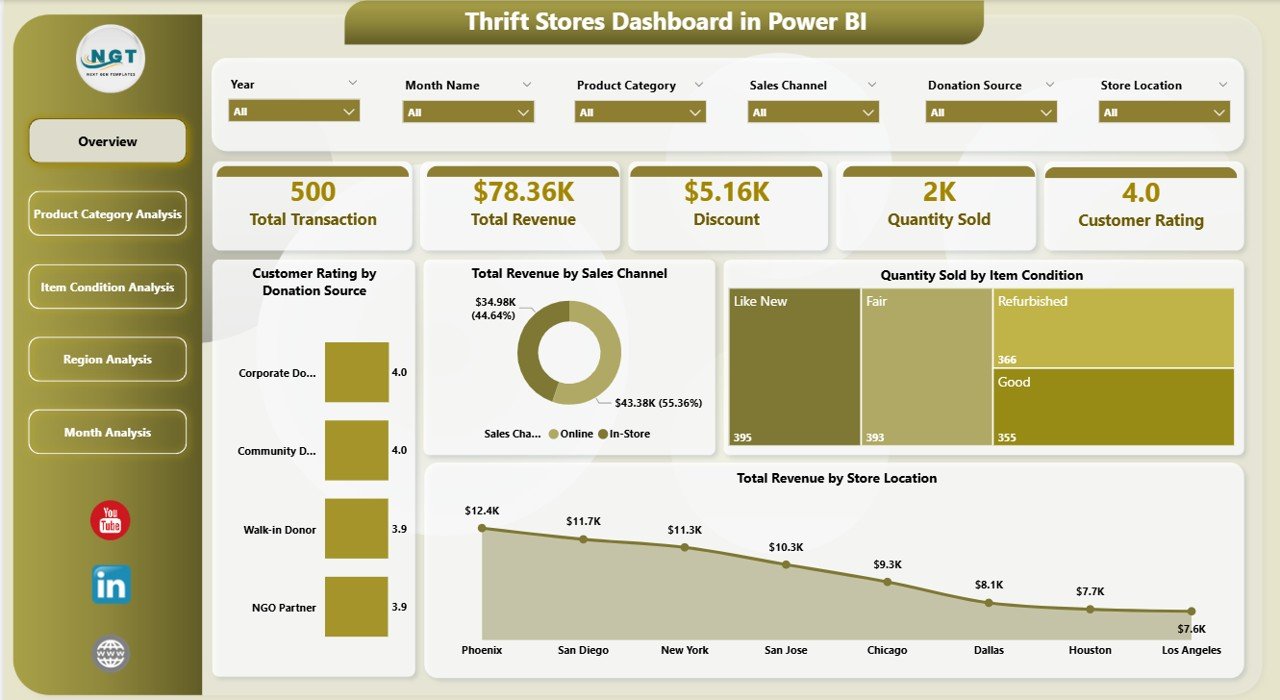
The Overview Page acts as the central command center of the dashboard. Here, users quickly understand overall performance.
Key Highlights
-
Interactive slicers for dynamic filtering
-
Summary cards showing key performance indicators
-
Easy navigation to detailed analysis pages
-
Click to Purchases Thrift Stores Dashboard in Power BI
KPI Cards Available
-
Customer Rating by Donation Source
-
Total Revenue by Sales Channel
-
Quantity Sold by Item Condition
-
Total Revenue by Store Location
-
Additional performance insights through visuals
Because this page presents summarized metrics, managers immediately understand business health.
2. Product Category Analysis – Which Products Perform Best?
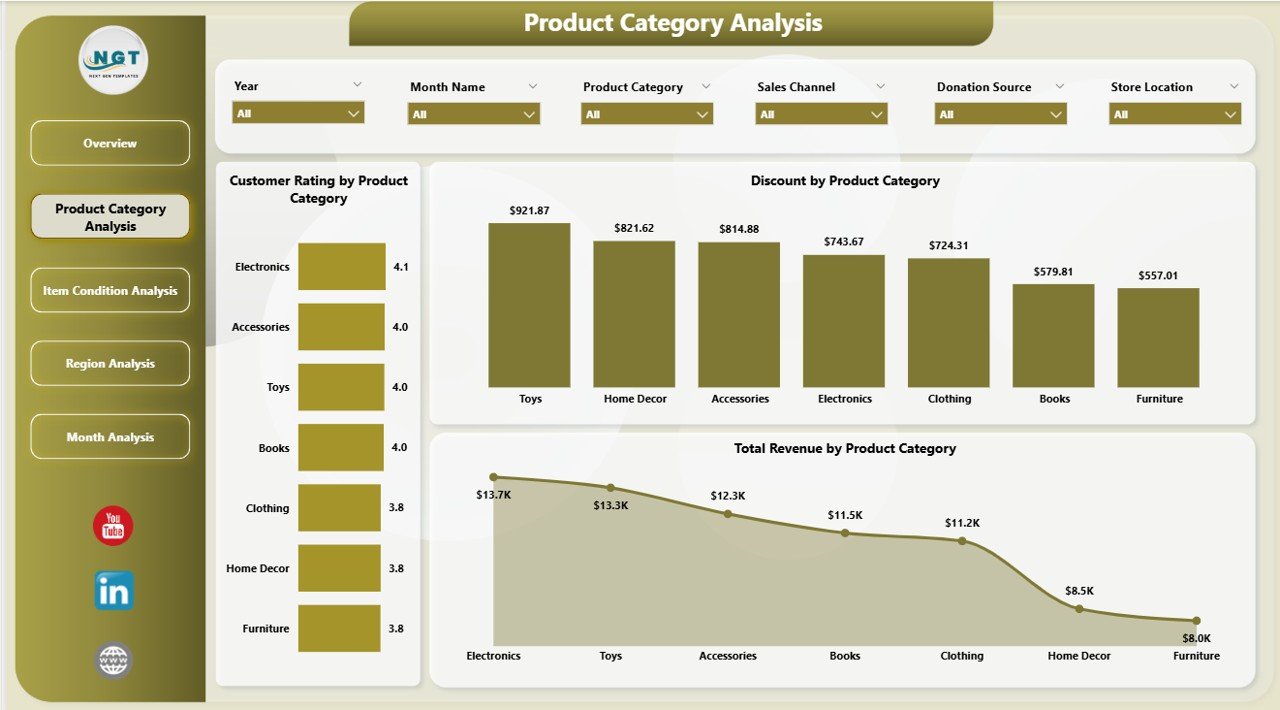
Product category analysis helps thrift stores understand customer demand patterns. Since thrift inventory varies widely, category insights become essential.
Charts Included
-
Customer Rating by Product Category
-
Total Revenue by Product Category
-
Discount by Product Category
Why This Page Matters
-
Identifies best-selling categories
-
Highlights low-performing product groups
-
Helps optimize pricing and promotions
For instance, if clothing generates higher ratings but lower revenue, managers can adjust pricing strategies accordingly.
3. Item Condition Analysis – Does Product Quality Affect Sales?
Unlike traditional retail, thrift stores sell items in different conditions such as new, gently used, or refurbished. Therefore, analyzing item condition becomes critical.
Charts Available
-
Customer Rating by Item Condition
-
Total Revenue by Item Condition
-
Total Transactions by Item Condition
Insights You Can Gain
-
Which condition attracts customers most
-
How quality impacts revenue
-
Whether discounts influence purchasing decisions
Consequently, stores can balance affordability and quality effectively.
4. Region Analysis – Which Locations Perform Better?
Click to Purchases Thrift Stores Dashboard in Power BI
Thrift stores often operate across multiple regions or branches. Therefore, regional analysis helps managers compare store performance.
Charts Included
-
Customer Rating by Region
-
Total Revenue by Region
-
Total Transactions by Region
Business Value
-
Identifies high-performing regions
-
Detects underperforming locations
-
Supports location-based marketing strategies
As a result, management allocates resources more efficiently.
5. Month Analysis – How Do Sales Change Over Time?
Retail performance changes throughout the year due to seasons, holidays, and donation cycles. Therefore, monthly analysis becomes essential.
Charts Available
-
Discount by Month
-
Total Revenue by Month
-
Total Transactions by Month
Benefits of Monthly Tracking
-
Detect seasonal buying patterns
-
Plan promotional campaigns
-
Forecast future revenue trends
Because trends appear visually, managers make proactive decisions instead of reactive ones.
What Data Is Required for the Thrift Stores Dashboard?
To run this dashboard successfully, users typically maintain data in Excel or database format.
Common Data Fields
-
Transaction Date
-
Store Location
-
Product Category
-
Item Condition
-
Sales Channel
-
Revenue Amount
-
Discount Applied
-
Customer Rating
-
Donation Source
-
Transaction Count
Clean and structured data ensures accurate dashboard performance.
How to Use the Thrift Stores Dashboard in Power BI?
Using this dashboard remains simple even for beginners.
Step-by-Step Process
-
Import data into Power BI.
-
Connect the dataset to the dashboard model.
-
Refresh the data.
-
Use slicers to filter information.
-
Analyze visuals and KPIs.
-
Export insights or share reports.
Since Power BI provides interactive navigation, users explore insights without technical expertise.
Advantages of Thrift Stores Dashboard in Power BI
Click to Purchases Thrift Stores Dashboard in Power BI
Organizations gain multiple benefits when they implement this dashboard.
✅ Improved Decision-Making
Managers access real-time insights, which helps them make faster decisions.
✅ Better Inventory Planning
Category and condition analysis help optimize stock management.
✅ Enhanced Customer Satisfaction
Customer rating analysis highlights improvement areas.
✅ Increased Revenue Visibility
Revenue tracking across channels ensures financial clarity.
✅ Time Savings
Automation eliminates manual reporting work.
✅ Interactive Reporting
Users explore data dynamically instead of reading static reports.
Opportunities for Improvement Using the Dashboard
Although the dashboard already provides powerful insights, businesses can enhance results further.
-
Integrate POS systems for live data updates
-
Add profit margin analysis
-
Track donation volume trends
-
Include employee performance metrics
-
Add predictive analytics models
These improvements strengthen long-term strategic planning.
Best Practices for the Thrift Stores Dashboard in Power BI
To achieve maximum value, organizations should follow proven practices.
Maintain Clean Data
Always standardize categories and naming conventions.
Update Data Regularly
Frequent refresh ensures accurate insights.
Use Meaningful Filters
Create slicers that align with business decisions.
Monitor KPIs Consistently
Review dashboards weekly or monthly.
Train Team Members
Ensure staff understand dashboard insights.
Customize Based on Business Needs
Modify visuals according to operational goals.
Who Can Benefit from This Dashboard?
This dashboard serves multiple stakeholders.
-
Thrift Store Owners
-
Retail Managers
-
Operations Teams
-
Marketing Analysts
-
Financial Controllers
-
Multi-Store Retail Chains
Because the dashboard simplifies analytics, both small stores and large organizations benefit equally.
How Does This Dashboard Improve Retail Strategy?
The dashboard directly supports strategic planning.
For example:
-
Managers identify high-demand categories quickly.
-
Marketing teams run targeted promotions.
-
Operations teams manage inventory efficiently.
-
Executives evaluate regional profitability.
Therefore, businesses move toward data-driven retail management.
Common Challenges Solved by the Dashboard
Many thrift stores struggle with operational visibility. Fortunately, this dashboard solves several issues.
Challenge → Solution
-
Scattered data → Centralized reporting
-
Manual calculations → Automated analytics
-
Unclear trends → Visual insights
-
Slow reporting → Instant dashboards
-
Poor forecasting → Trend analysis
As a result, management gains clarity and confidence.
Why Choose Power BI for Thrift Store Analytics?
Click to Purchases Thrift Stores Dashboard in Power BI
Power BI stands out because it combines simplicity with advanced analytics.
Key Reasons
-
Interactive visualizations
-
Real-time data refresh
-
Easy Excel integration
-
Secure sharing options
-
Scalable reporting system
Moreover, Power BI allows businesses to expand analytics as they grow.
Future Scope of Thrift Store Analytics
Retail analytics continues evolving rapidly. Therefore, thrift stores can adopt advanced features such as:
-
AI-based demand forecasting
-
Customer behavior prediction
-
Automated alerts for low performance
-
Mobile dashboard monitoring
Businesses that adopt analytics early gain competitive advantages.
Conclusion
The Thrift Stores Dashboard in Power BI provides a powerful and practical solution for modern thrift retail management. Instead of relying on manual reports, businesses analyze performance through interactive visuals and real-time insights.
Because the dashboard covers overview metrics, product categories, item conditions, regions, and monthly trends, managers gain a complete understanding of operations. Consequently, they improve decision-making, increase revenue opportunities, and enhance customer satisfaction.
In today’s competitive retail environment, data-driven management no longer remains optional. Instead, it becomes essential for sustainable growth. Therefore, implementing a structured Power BI dashboard represents a smart investment for any thrift store business.
Frequently Asked Questions (FAQs)
1. What is a Thrift Stores Dashboard in Power BI used for?
It helps thrift store managers track revenue, customer ratings, transactions, and performance trends using interactive visuals.
2. Do I need advanced Power BI skills to use this dashboard?
No. The dashboard uses user-friendly slicers and visuals, so beginners can easily operate it.
3. Can I connect Excel data to this dashboard?
Yes. Power BI integrates seamlessly with Excel files.
4. How often should I update the dashboard data?
You should refresh data daily, weekly, or monthly depending on business needs.
5. Can this dashboard work for multiple store locations?
Yes. Regional analysis allows comparison across multiple branches.
6. Is this dashboard customizable?
Absolutely. Users can modify visuals, KPIs, and filters based on requirements.
7. Does the dashboard help improve profitability?
Yes. By identifying trends and performance gaps, businesses make smarter financial decisions.
Visit our YouTube channel to learn step-by-step video tutorials