Tunnel engineering projects require precise planning, strict safety monitoring, and continuous performance tracking. Engineers, project managers, and infrastructure authorities must monitor dozens of operational metrics every day. However, many organizations still rely on scattered spreadsheets and manual reports to analyze project performance.
As a result, decision-makers struggle to identify operational issues quickly. They also face difficulty comparing targets with actual performance or tracking long-term trends.
Therefore, organizations increasingly adopt Power BI dashboards to monitor engineering performance in real time. One powerful solution is the Tunnel Engineering KPI Dashboard in Power BI.
This interactive dashboard helps project managers analyze tunnel construction performance, compare targets with actual results, monitor monthly trends, and improve operational decision-making.
Instead of reviewing multiple reports, decision-makers can analyze all tunnel engineering KPIs in one centralized and interactive dashboard.
In this guide, you will learn everything about the Tunnel Engineering KPI Dashboard in Power BI, including its features, benefits, implementation practices, and frequently asked questions.
Click to buy Tunnel Engineering KPI Dashboard in Power BI
What is a Tunnel Engineering KPI Dashboard in Power BI?
A Tunnel Engineering KPI Dashboard in Power BI is a structured performance monitoring tool that tracks key indicators related to tunnel construction, engineering efficiency, project timelines, and safety performance.
Tunnel engineering involves complex operations such as:
- Tunnel excavation progress monitoring
- Safety compliance tracking
- Equipment utilization monitoring
- Structural stability monitoring
- Cost control and budget tracking
- Construction schedule monitoring
Because these activities generate large volumes of data, engineers need a powerful analytics platform to interpret the information effectively.
Power BI provides interactive visualizations that allow teams to:
- Track engineering KPIs in real time
- Compare actual performance against targets
- Identify performance trends quickly
- Improve operational decision-making
As a result, the Tunnel Engineering KPI Dashboard in Power BI becomes an essential tool for infrastructure organizations and engineering teams.
Why Do Tunnel Engineering Projects Need KPI Dashboards?
Tunnel construction projects operate under strict timelines and safety standards. Even a small delay or operational issue can lead to serious consequences.
Therefore, organizations must monitor performance indicators continuously.
A KPI dashboard helps project teams maintain full visibility over project performance.
Key reasons why tunnel engineering projects need KPI dashboards
- Monitor project performance
Managers can track excavation progress, equipment efficiency, and safety performance using real-time dashboards.
- Identify operational issues early
Dashboards highlight deviations from targets quickly. As a result, teams can solve problems before they become serious.
- Improve decision making
Instead of analyzing multiple reports, managers can evaluate performance instantly using visual dashboards.
- Track safety performance
Tunnel construction involves high safety risks. Therefore, teams must monitor safety KPIs continuously.
- Improve communication
Dashboards allow project managers, engineers, and executives to review performance metrics using a single system.
Key Features of the Tunnel Engineering KPI Dashboard in Power BI
The Tunnel Engineering KPI Dashboard in Power BI is a ready-to-use analytical tool. The dashboard captures data in an Excel file and visualizes it using Power BI.
This dashboard contains three main pages.
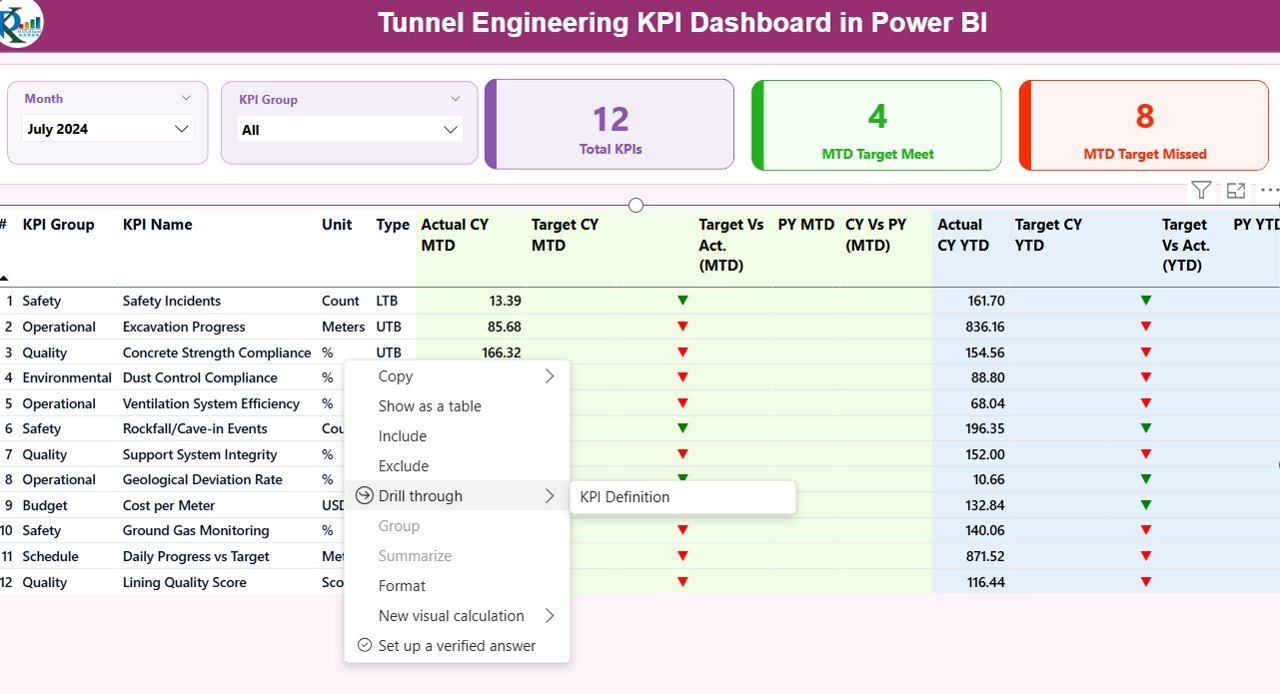
Summary Page – The Main Dashboard View
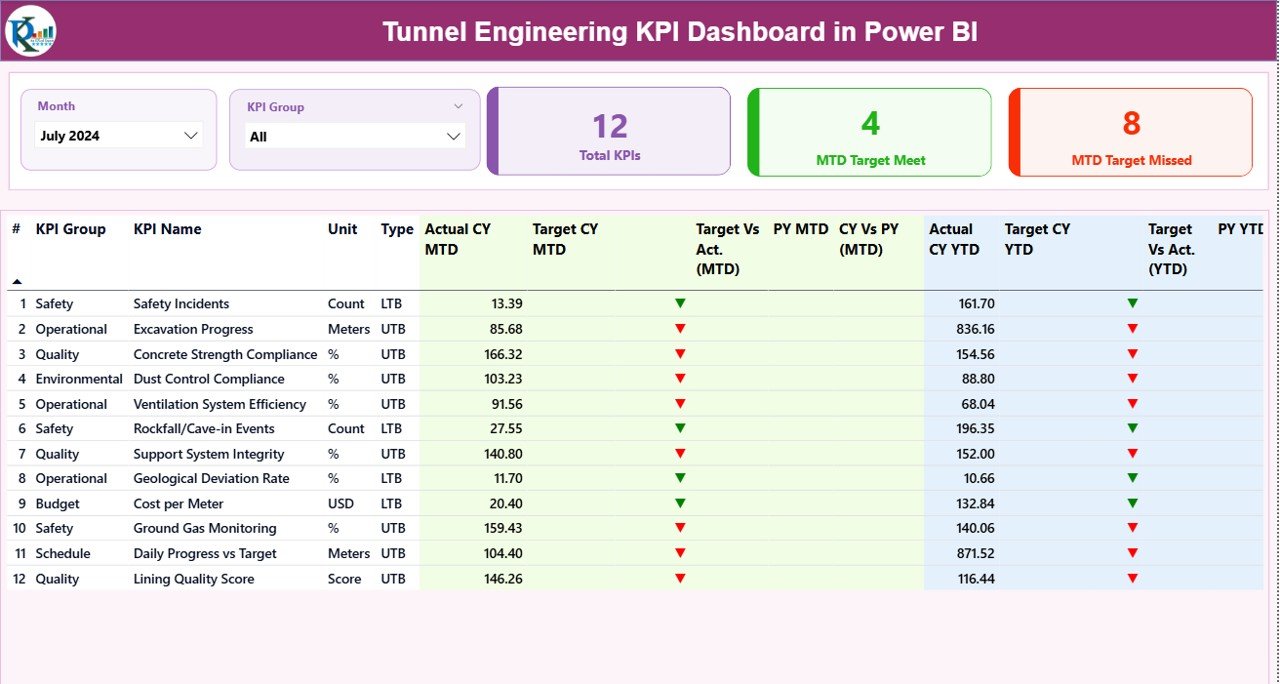
The Summary Page serves as the central monitoring interface of the dashboard. Here, users can view the overall performance of all tunnel engineering KPIs.
Dashboard Controls
At the top of the dashboard, users can select filters using:
- Month slicer
- KPI Group slicer
These slicers allow users to analyze KPI performance for a specific month or category.
KPI Overview Cards
The dashboard displays three KPI summary cards:
- Total KPIs Count – Total number of KPIs tracked
- MTD Target Meet Count – Number of KPIs meeting targets
- MTD Target Missed Count – Number of KPIs missing targets
These cards provide a quick overview of overall performance.
Detailed KPI Table
Below the summary cards, the dashboard displays a detailed KPI table containing the following information.
KPI Number
- Represents the sequence number of the KPI.
KPI Group
- Displays the category of the KPI such as Safety, Productivity, Equipment, or Financial.
KPI Name
- Shows the name of the performance indicator.
Unit
- Displays the measurement unit of the KPI.
Type
- Indicates KPI type:
- LTB – Lower the Better
- UTB – Upper the Better
- Monthly Performance Metrics (MTD)
The dashboard tracks Month-To-Date performance using several metrics.
Actual CY MTD
- Displays the actual KPI value for the current month.
Target CY MTD
- Shows the target KPI value for the current month.
MTD Icon
- Displays visual indicators:
- Green icon = KPI performing well
- Red icon = KPI below target
Target vs Actual (MTD)
- Percentage comparison between actual performance and target.
Formula:
Actual MTD ÷ Target MTD
PY MTD
- Shows the KPI value for the same month in the previous year.
CY vs PY (MTD)
- Compares current month performance with previous year performance.
Formula:
Current Year MTD ÷ Previous Year MTD
Year-To-Date Performance Metrics (YTD)
The dashboard also monitors long-term performance using Year-To-Date metrics.
Actual CY YTD
- Current year accumulated KPI value.
Target CY YTD
- Target KPI value for the current year.
YTD Icon
- Visual indicator showing performance against the YTD target.
Target vs Actual (YTD)
Formula:
Actual YTD ÷ Target YTD
PY YTD
- Previous year KPI value for the same period.
CY vs PY (YTD)
Formula:
Current Year YTD ÷ Previous Year YTD
These indicators allow managers to evaluate both short-term and long-term performance.
Click to buy Tunnel Engineering KPI Dashboard in Power BI
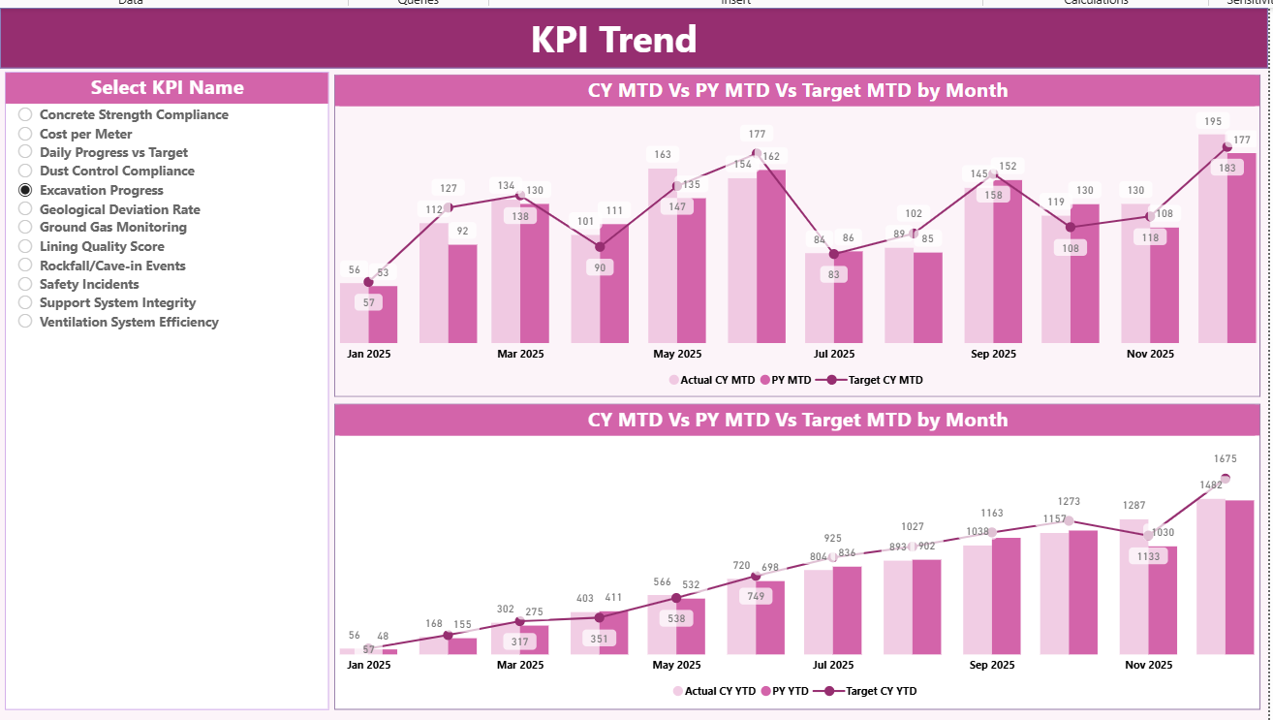
KPI Trend Page
The KPI Trend Page provides visual insights into KPI performance over time.
On this page, users can select a KPI using the KPI Name slicer.
Once users select a KPI, the dashboard displays two combo charts:
MTD Performance Trend
This chart compares:
- Current Year Actual
- Previous Year Actual
- Target Values
YTD Performance Trend
This chart shows long-term KPI performance.
Users can quickly analyze trends, seasonal patterns, and performance improvements.
Because of these visual comparisons, managers can easily identify whether performance improves or declines over time.
Click to buy Tunnel Engineering KPI Dashboard in Power BI
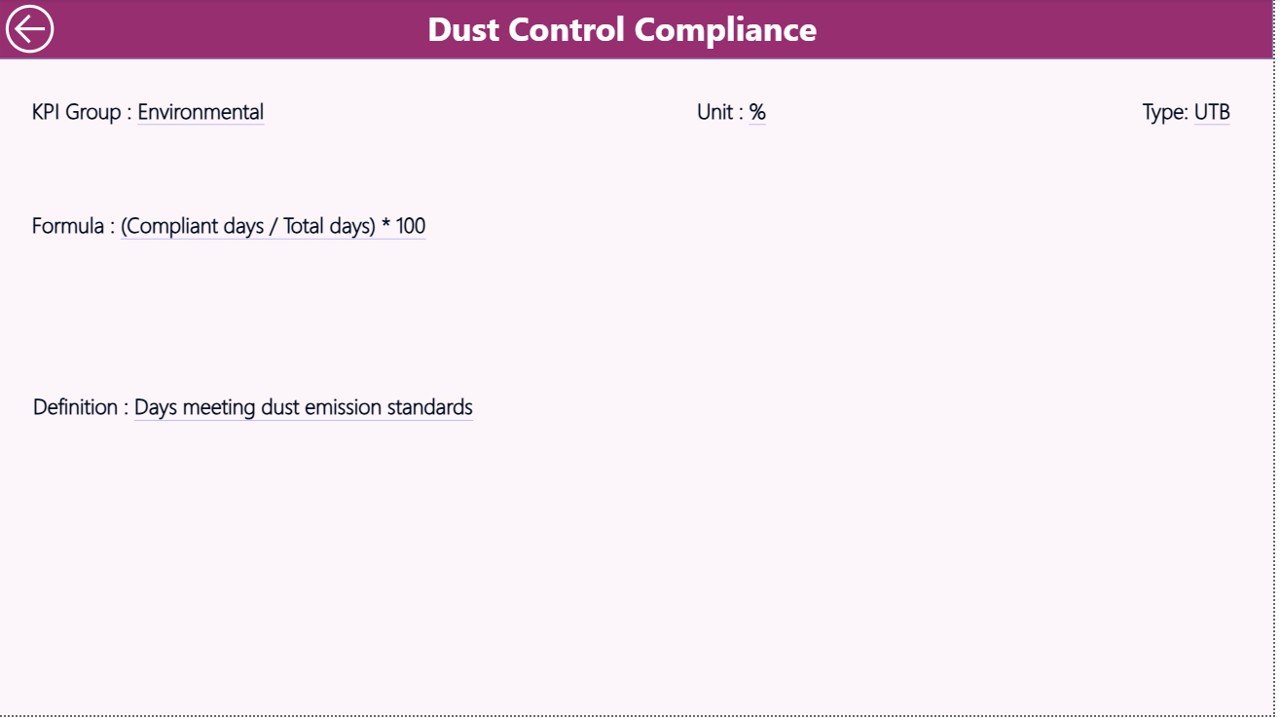
KPI Definition Page
The KPI Definition Page acts as a drill-through page.
This page remains hidden by default.
However, users can access it from the Summary Page using the drill-through feature.
Here, users can view detailed KPI information such as:
- KPI Formula
- KPI Definition
- KPI Unit
- KPI Type
- KPI Group
This page helps engineers and analysts understand how each KPI works.
To return to the main dashboard, users can click the Back button located in the top-left corner.
Click to buy Tunnel Engineering KPI Dashboard in Power BI
Excel Data Source for the Dashboard
The Tunnel Engineering KPI Dashboard in Power BI uses an Excel file as the data source.
The Excel file contains three worksheets.
Input_Actual Sheet
This worksheet stores the actual KPI performance data.
Users must enter the following fields:
- KPI Name
- Month (first date of the month)
- MTD value
- YTD value
Power BI automatically reads this data and updates the dashboard visuals.
Click to buy Tunnel Engineering KPI Dashboard in Power BI
Input_Target Sheet
This worksheet contains target KPI values.
Users must enter:
- KPI Name
- Month
- Target MTD value
- Target YTD value
Once users update the target values, the dashboard recalculates the KPI comparisons automatically.
KPI Definition Sheet
This worksheet stores the KPI master data.
It includes:
- KPI Number
- KPI Group
- KPI Name
- Unit of measurement
- Formula
- KPI definition
- KPI Type (LTB or UTB)
Because this sheet defines all KPIs, it plays a critical role in maintaining dashboard accuracy.
Advantages of Tunnel Engineering KPI Dashboard in Power BI
Organizations gain several benefits from implementing this dashboard.
- Centralized performance monitoring
All KPIs appear in one dashboard. As a result, teams can monitor project performance without switching between multiple reports.
- Faster decision making
Interactive visualizations allow managers to analyze performance instantly.
- Improved project transparency
Stakeholders can clearly see how the project performs against targets.
- Better trend analysis
Trend charts help teams understand performance changes over time.
- Enhanced safety monitoring
Safety KPIs allow engineers to detect safety risks early.
- Increased operational efficiency
Data-driven insights help teams optimize resources and reduce project delays.
- Easy data integration
The dashboard connects easily with Excel data sources.
Best Practices for the Tunnel Engineering KPI Dashboard in Power BI
To get the best results from the dashboard, organizations should follow several best practices.
Define clear KPIs
Teams must define clear and measurable KPIs before building dashboards.
Maintain accurate data
Accurate data improves dashboard reliability. Therefore, teams must update Excel files regularly.
Use standardized KPI definitions
Standardized KPI definitions ensure that all teams interpret performance metrics consistently.
Monitor KPIs regularly
Project managers should review dashboard metrics daily or weekly.
Use automated data refresh
Power BI supports scheduled refresh. Therefore, teams should automate data updates.
Train users properly
Teams should understand how to use filters, slicers, and drill-through features.
Review dashboard design periodically
Organizations should improve dashboard design based on user feedback.
Practical Use Cases of Tunnel Engineering KPI Dashboards
Several organizations use KPI dashboards in tunnel engineering.
Infrastructure Authorities
Government agencies monitor large tunnel construction projects.
Construction Companies
Contractors track project progress, equipment performance, and workforce productivity.
Engineering Consultants
Consultants evaluate construction performance and recommend improvements.
Project Management Teams
Project managers analyze KPIs to ensure projects remain on schedule.
Safety Departments
Safety teams track accident rates, compliance levels, and risk indicators.
Conclusion
Tunnel engineering projects require precise monitoring and strong data-driven decision making. However, traditional reporting methods often create delays and confusion.
The Tunnel Engineering KPI Dashboard in Power BI provides a powerful solution for monitoring project performance.
This dashboard centralizes all KPI information in one interactive platform. It allows engineers, managers, and stakeholders to analyze project metrics quickly and make informed decisions.
Because the dashboard uses Power BI’s interactive visualization capabilities, organizations can track trends, compare targets, and monitor safety performance effectively.
As infrastructure projects continue to grow in complexity, dashboards like this will become essential tools for successful project management.
Frequently Asked Questions (FAQs)
What is a Tunnel Engineering KPI Dashboard?
A Tunnel Engineering KPI Dashboard tracks key performance indicators related to tunnel construction projects. It helps managers monitor performance, track progress, and compare targets with actual results.
Why do engineers use Power BI for KPI dashboards?
Power BI provides powerful data visualization tools, interactive dashboards, and real-time analytics. Therefore, engineers use it to analyze project performance efficiently.
What data sources does the dashboard use?
The dashboard uses an Excel file containing three worksheets: Actual Data, Target Data, and KPI Definitions.
What are MTD and YTD KPIs?
- MTD (Month-To-Date) shows KPI performance for the current month.
- YTD (Year-To-Date) shows cumulative KPI performance for the entire year.
What does LTB and UTB mean?
- LTB – Lower the Better (example: accident rate)
- UTB – Upper the Better (example: productivity rate)
Can organizations customize this dashboard?
Yes. Organizations can add new KPIs, modify targets, and connect additional data sources.
Who should use this dashboard?
Project managers, engineers, infrastructure authorities, and construction companies can use this dashboard to monitor tunnel engineering performance.
Visit our YouTube channel to learn step-by-step video tutorials
Click to buy Tunnel Engineering KPI Dashboard in Power BI