E-logistics startups operate in a fast-paced and highly competitive environment. Every day, they manage deliveries, track vehicle movement, monitor operational costs, and measure customer satisfaction. At the same time, they must ensure that orders reach customers on time while maintaining service quality and profitability.
However, many e-logistics startups still rely on scattered spreadsheets, manual reports, and disconnected systems. As a result, teams struggle to track performance clearly. Managers often find it difficult to understand which delivery type performs best, which vehicle generates the most revenue, or which operations team controls costs efficiently.
Therefore, startups need a clear and structured system to monitor their logistics performance.
This is where the E-logistics Startups Dashboard in Excel becomes extremely valuable.
Click to Purchases E-logistics Startups Dashboard in Excel
An Excel dashboard allows logistics startups to track deliveries, analyze revenue, monitor costs, and evaluate customer satisfaction in one centralized place. Instead of reviewing multiple reports, decision-makers can analyze all operational data through interactive charts and visual insights.
In this article, you will learn:
-
What an E-logistics Startups Dashboard in Excel is
-
Why logistics startups need a dashboard
-
Key features of the Excel dashboard template
-
Important logistics performance metrics
-
Advantages of using an Excel dashboard
-
Best practices for implementing logistics dashboards
-
Frequently asked questions about logistics dashboards
Let’s explore how this powerful tool helps logistics startups improve operational performance and business growth.
What Is an E-logistics Startups Dashboard in Excel?
An E-logistics Startups Dashboard in Excel is an interactive analytics tool that tracks logistics operations and business performance using charts, metrics, and visual indicators.
The dashboard collects logistics data such as:
-
Delivery records
-
Customer ratings
-
Revenue per order
-
Operating costs
-
Vehicle performance
-
Monthly trends
After collecting the data, the dashboard converts it into interactive charts and analytical views.
As a result, startup founders, operations managers, and logistics analysts can quickly identify patterns, performance gaps, and growth opportunities.
Instead of checking multiple reports, users can analyze everything from one centralized Excel dashboard.
Why Do E-logistics Startups Need a Dashboard?
E-logistics startups face complex operational challenges. They must handle high delivery volumes, coordinate drivers and vehicles, manage costs, and maintain customer satisfaction.
Without proper analytics, businesses may struggle to make accurate decisions.
However, when startups implement a structured dashboard, they gain several advantages.
1. Improve Operational Visibility
First, dashboards provide a clear view of logistics operations. Managers can quickly see delivery trends, revenue performance, and cost distribution.
2. Monitor Delivery Performance
Next, startups can analyze delivery types, vehicle efficiency, and operational team performance.
3. Track Financial Performance
In addition, the dashboard helps businesses monitor revenue per order and cost per order.
4. Measure Customer Satisfaction
Customer ratings play a critical role in logistics businesses. Therefore, dashboards track satisfaction levels across cities, vehicle types, and startup brands.
5. Make Faster Decisions
Finally, decision-makers can identify issues quickly and implement improvements immediately.
Click to Purchases E-logistics Startups Dashboard in Excel
Key Features of the E-logistics Startups Dashboard in Excel
The E-logistics Startups Dashboard in Excel provides several analytical pages that allow users to analyze operations from different perspectives.
The Excel dashboard contains five interactive pages.
In addition, a page navigator located on the left side allows users to move easily between different analysis sections.
Let’s explore each dashboard page in detail.
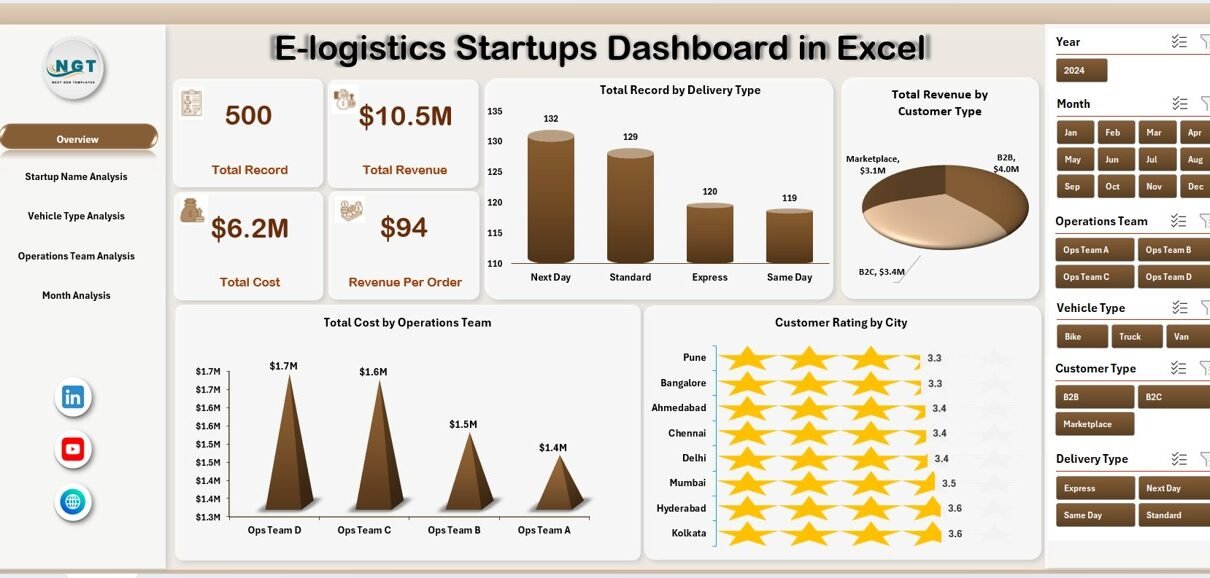
1. Overview Page – What Does the Main Dashboard Show?
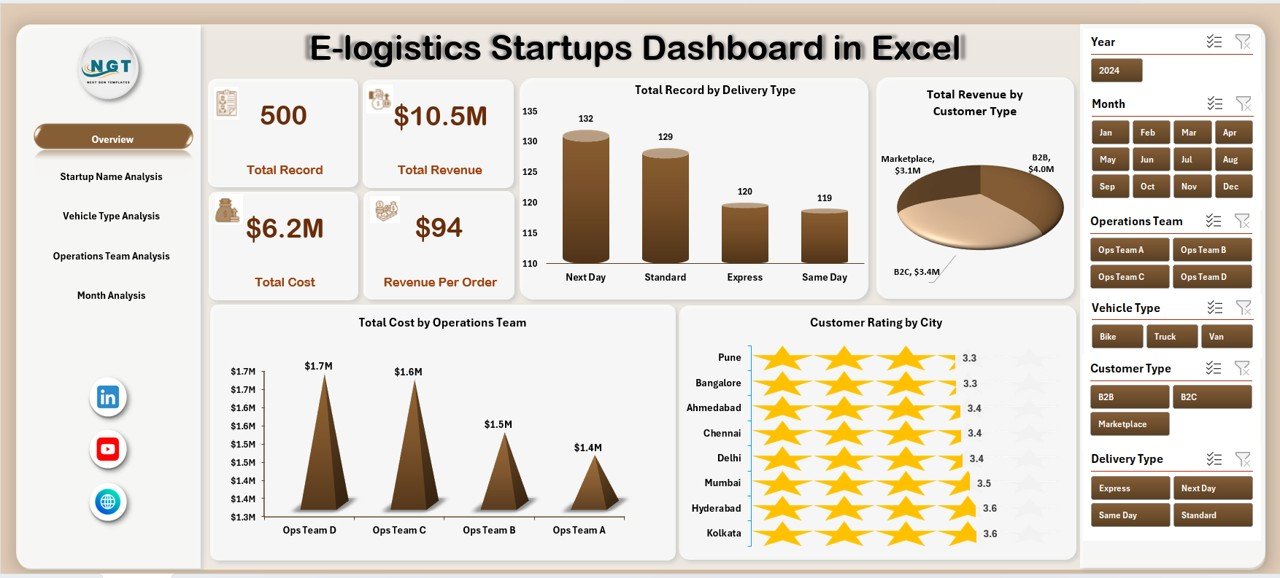
The Overview Page acts as the main interface of the dashboard. This page provides a quick summary of logistics operations and performance.
Users can apply filters using the right-side slicer to analyze specific segments.
KPI Cards
The dashboard displays four key performance cards that summarize major metrics.
These cards help users quickly understand overall performance.
Charts Available in the Overview Page
The Overview page includes four analytical charts:
-
Total Record by Delivery Type
Shows how many deliveries each delivery method handles. -
Total Revenue by Customer Type
Displays revenue generated from different customer groups. -
Total Cost by Operating Team
Helps analyze which operations team spends more on logistics activities. -
Customer Rating by City
Shows customer satisfaction levels across different cities.
Together, these charts provide a quick snapshot of logistics performance.
2. Startup Name Analysis – Which Startup Performs Best?
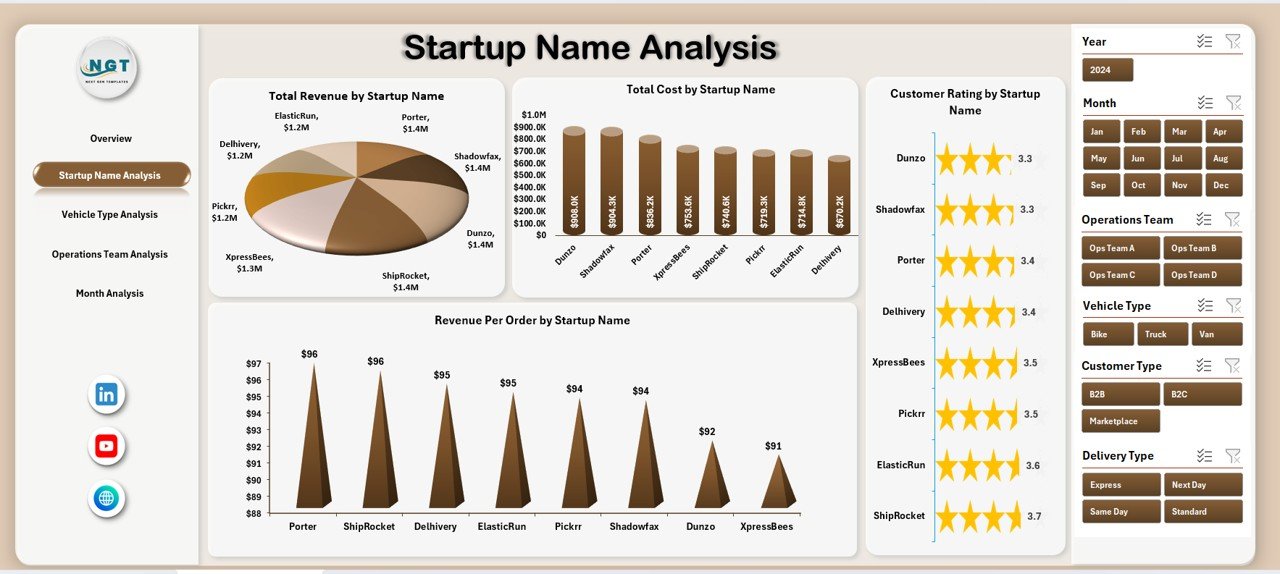
E-logistics startups often operate under multiple brand names or service divisions. Therefore, analyzing performance by startup name becomes essential.
The Startup Name Analysis Page focuses on comparing startup brands or service units.
Charts Included in This Page
-
Total Record by Startup Name
Displays the number of orders processed by each startup. -
Customer Rating by Startup Name
Measures customer satisfaction levels across startups. -
Total Cost by Startup Name
Shows operational costs for each logistics brand. -
Revenue Per Order by Startup Name
Helps identify the most profitable startup operations.
This page allows managers to quickly determine which startup division performs the best.
Click to Purchases E-logistics Startups Dashboard in Excel
3. Vehicle Type Analysis – Which Vehicle Generates Better Performance?
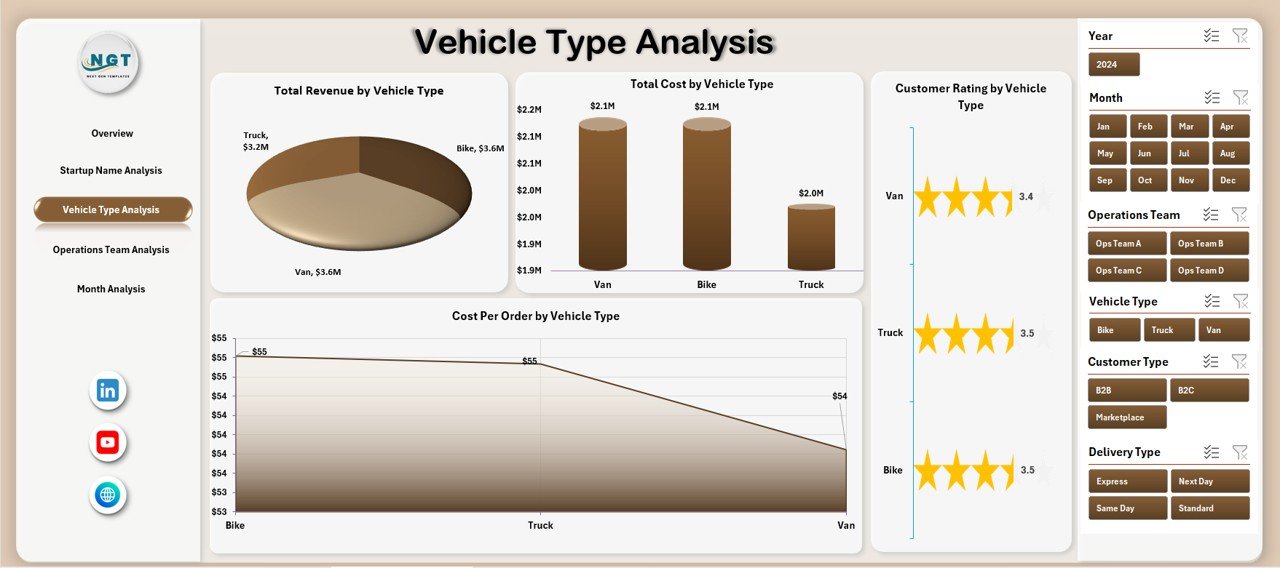
Vehicles represent one of the most important assets in logistics operations. Different vehicles serve different delivery needs.
For example:
-
Bikes handle short-distance deliveries.
-
Vans manage medium-volume orders.
-
Trucks handle bulk transportation.
Therefore, analyzing vehicle performance helps startups optimize fleet management.
Charts in the Vehicle Type Analysis Page
-
Total Record by Vehicle Type
Shows how frequently each vehicle type handles deliveries. -
Customer Rating by Vehicle Type
Displays customer satisfaction levels associated with different vehicles. -
Total Cost by Vehicle Type
Helps businesses understand vehicle operating costs. -
Revenue Per Order by Vehicle Type
Identifies which vehicle generates the highest revenue.
As a result, logistics startups can optimize fleet usage and reduce operating expenses.
4. Operations Team Analysis – Which Team Performs Most Efficiently?
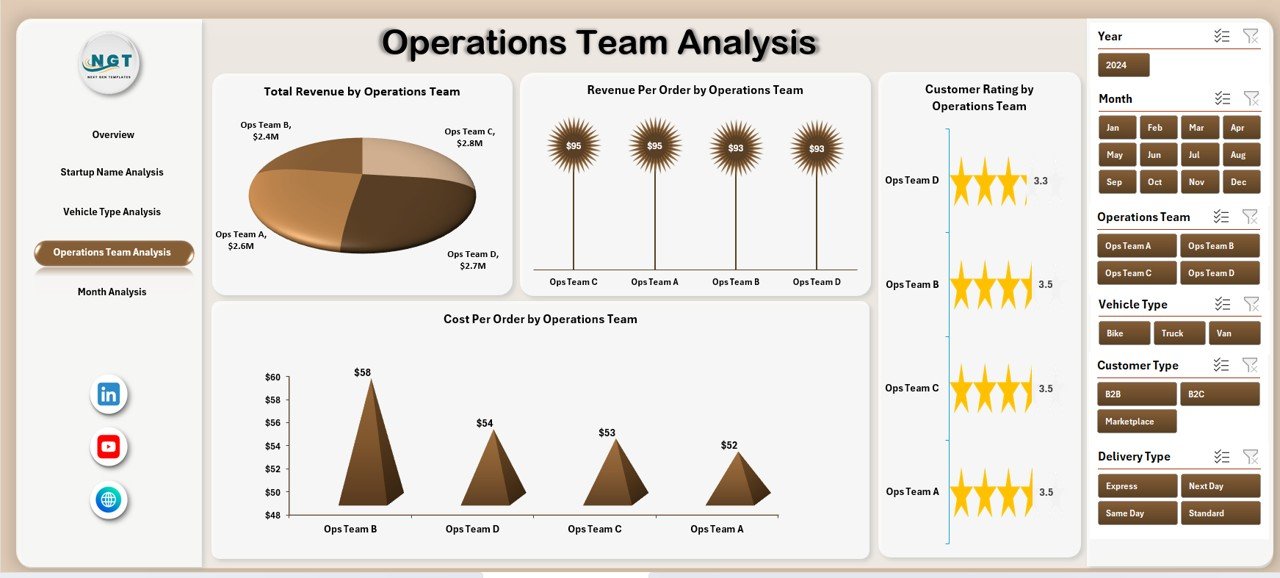
Operations teams manage logistics coordination, delivery scheduling, driver communication, and order processing.
Because of this, team performance directly affects delivery speed and service quality.
The Operations Team Analysis Page helps managers evaluate team efficiency.
Charts Included in This Section
-
Total Record by Operating Team
Shows the delivery volume managed by each team. -
Customer Rating by Operating Team
Helps measure service quality across teams. -
Revenue Per Order by Operating Team
Displays profitability generated by different teams. -
Cost Per Order by Operating Team
Identifies operational efficiency and cost control.
Therefore, managers can easily determine which team performs the best.
5. Month Analysis – How Does Logistics Performance Change Over Time?
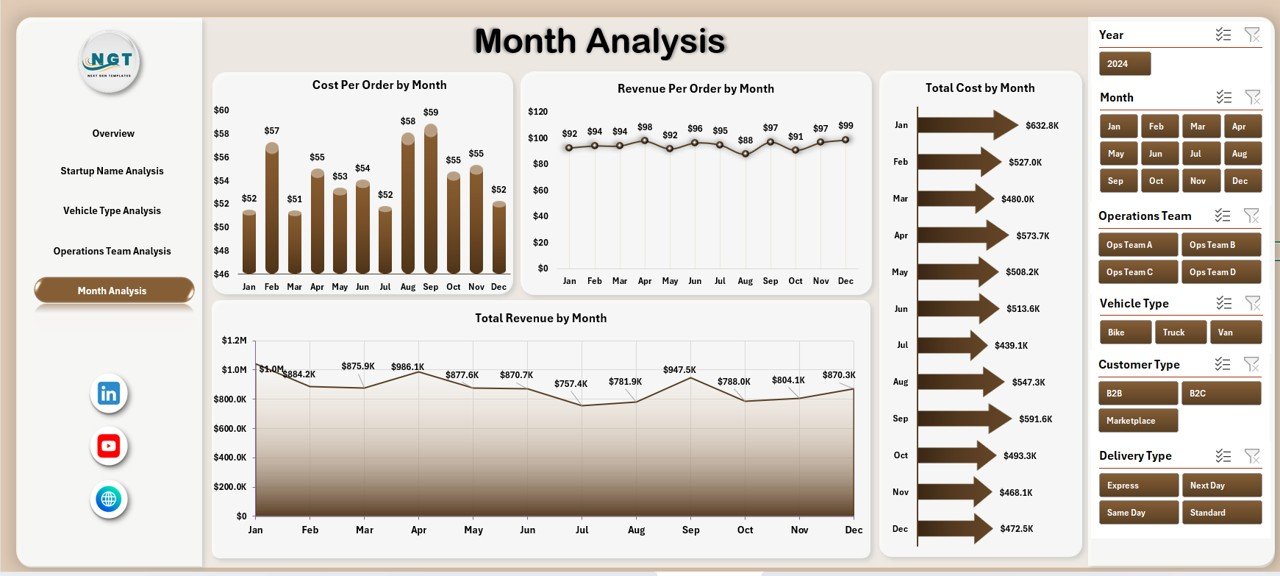
Business performance changes every month due to seasonal demand, operational challenges, and customer behavior.
Therefore, analyzing monthly trends becomes extremely important.
The Month Analysis Page provides time-based insights.
Charts Available in the Month Analysis Page
-
Cost Per Order by Month
Shows cost fluctuations across different months. -
Revenue Per Order by Month
Displays profitability trends over time. -
Total Cost by Month
Helps track operational expenses. -
Total Revenue by Month
Identifies high-performing months.
Because of these insights, businesses can identify seasonal patterns and plan logistics resources more effectively.
Support Sheet and Data Sheet
Click to Purchases E-logistics Startups Dashboard in Excel
The dashboard also includes two additional sheets that support the analytics structure.
Support Sheet
The Support Sheet stores important supporting data such as:
-
Lists for dropdown selections
-
KPI definitions
-
Data validation values
-
Calculation references
These elements help maintain dashboard functionality and ensure accurate filtering.
Data Sheet
The Data Sheet stores the main dataset used to build pivot tables and charts.
Typical columns may include:
-
Order ID
-
Delivery Type
-
Startup Name
-
Vehicle Type
-
Operating Team
-
City
-
Revenue
-
Cost
-
Customer Rating
-
Month
Because the dashboard uses pivot tables, users can easily refresh the data and update charts instantly.
What KPIs Should E-logistics Startups Track?
E-logistics dashboards rely on performance metrics that help measure operational success.
Important logistics KPIs include:
Operational KPIs
-
Total Orders Processed
-
Delivery Success Rate
-
On-Time Delivery Rate
-
Average Delivery Time
Financial KPIs
-
Revenue Per Order
-
Cost Per Order
-
Total Logistics Cost
-
Total Revenue
Customer KPIs
-
Customer Rating
-
Customer Complaints
-
Repeat Customer Rate
Fleet KPIs
-
Vehicle Utilization Rate
-
Fuel Cost Per Delivery
-
Maintenance Cost
Tracking these metrics helps startups improve service quality and profitability.
Advantages of E-logistics Startups Dashboard in Excel
Using an Excel dashboard provides several practical benefits.
1. Easy to Use
Excel offers a familiar interface. Therefore, teams can quickly learn how to use the dashboard.
2. Affordable Solution
Many startups cannot afford expensive analytics software. Excel provides a cost-effective alternative.
3. Interactive Data Analysis
Slicers and pivot charts allow users to explore logistics data dynamically.
4. Faster Decision-Making
Managers can identify operational problems quickly and implement improvements.
5. Centralized Data Monitoring
The dashboard stores all important logistics information in one place.
Best Practices for the E-logistics Startups Dashboard in Excel
To maximize the value of a logistics dashboard, startups should follow several best practices.
1. Maintain Accurate Data
Always update delivery records and operational data regularly.
2. Use Standard Data Formats
Ensure consistent formats for dates, costs, and ratings.
3. Monitor KPIs Weekly
Regular monitoring helps identify problems early.
4. Keep Dashboard Simple
Avoid adding unnecessary charts or metrics.
5. Train the Operations Team
Teach employees how to interpret dashboard insights.
6. Automate Data Updates
Where possible, integrate data imports or automation.
Conclusion
The E-logistics Startups Dashboard in Excel provides a powerful solution for tracking logistics performance, monitoring financial metrics, and improving operational efficiency.
Instead of analyzing scattered reports, managers can review all logistics insights from one interactive dashboard.
Because the dashboard includes Overview, Startup Name Analysis, Vehicle Type Analysis, Operations Team Analysis, and Month Analysis, it offers a complete view of logistics performance.
As a result, startups can improve delivery efficiency, control costs, and enhance customer satisfaction.
Therefore, implementing an Excel logistics dashboard can significantly improve decision-making and business growth for e-logistics startups.
Frequently Asked Questions (FAQs)
Click to Purchases E-logistics Startups Dashboard in Excel
What is an E-logistics dashboard?
An E-logistics dashboard is a data visualization tool that tracks logistics operations, deliveries, costs, revenue, and customer satisfaction.
Why should startups use an Excel logistics dashboard?
Startups should use Excel dashboards because they provide affordable, easy-to-use analytics without requiring expensive software.
What data does the logistics dashboard require?
The dashboard requires data such as order records, vehicle types, operating teams, costs, revenue, customer ratings, and monthly transactions.
Can beginners use this dashboard?
Yes. Excel dashboards use simple pivot tables and slicers, so beginners can easily understand and use them.
How often should the logistics dashboard be updated?
Businesses should update the dashboard regularly. Many companies update logistics data daily or weekly.
Can the dashboard handle large datasets?
Yes. Excel can manage thousands of records. However, very large datasets may require Power BI or advanced tools.
Visit our YouTube channel to learn step-by-step video tutorials