Television broadcasting continues to play a powerful role in entertainment, news distribution, advertising, and audience engagement across the world. Every day, TV networks broadcast hundreds of programs, commercials, and live events to millions of viewers across different regions and platforms. Because of this large amount of activity, TV channels must carefully monitor viewer engagement, advertising performance, TRP ratings, and revenue generation.However, many broadcasting organizations still rely on scattered spreadsheets, manual reports, and disconnected analytics systems. As a result, managers struggle to understand which genre attracts the most viewers, which platform generates the highest ad revenue, or which region delivers the best TRP ratings. Without a centralized reporting system, decision-makers cannot quickly analyze performance trends or make strategic improvements.Therefore, media companies need a powerful analytics solution that consolidates all TV channel performance metrics in one place.This is where the TV Channels Dashboard in Power BI becomes extremely valuable.A Power BI dashboard allows broadcasting companies to monitor advertising revenue, analyze viewer engagement, evaluate TRP ratings, and track impressions through interactive visual reports. Instead of analyzing multiple reports, managers can instantly understand channel performance using dynamic charts, slicers, and real-time metrics.
In this detailed guide, you will learn:
- What a TV Channels Dashboard in Power BI is
- Why TV networks need analytics dashboards
- Key features of the dashboard template
- Important TV broadcasting KPIs
- Advantages of using Power BI for TV analytics
- Best practices for managing TV channel performance
- Frequently asked questions about TV channel dashboards
Click to buy TV Channels Dashboard in Power BI
What Is a TV Channels Dashboard in Power BI?
A TV Channels Dashboard in Power BI is an interactive business intelligence tool that helps television networks analyze their broadcasting performance through visual analytics.
The dashboard collects and organizes important data such as:
- Advertising revenue
- Viewer engagement
- TRP ratings
- Ad duration
- Audience impressions
- Regional performance
- Platform distribution
Instead of reviewing several reports, media executives can analyze all important metrics from one centralized dashboard.
Power BI transforms raw broadcasting data into clear charts, cards, and filters. Therefore, TV network managers can easily identify trends, compare channels, evaluate advertising performance, and improve programming strategies.
Moreover, interactive slicers allow users to filter the dashboard by:
- Region
- Platform
- Genre
- Month
- Channel
Because of this flexibility, decision-makers can explore data from different perspectives and uncover valuable insights quickly.
Why Do TV Networks Need a TV Channels Dashboard?
Television broadcasting generates huge amounts of data every day. Networks track viewership numbers, advertising revenue, program performance, and audience engagement metrics.
However, without proper analytics tools, it becomes difficult to interpret this information effectively.
A TV Channels Dashboard in Power BI helps solve these problems.
Here are several reasons why TV networks need such a dashboard.
- Centralized Performance Monitoring
A dashboard consolidates all broadcasting metrics in one place. As a result, managers can monitor channel performance without switching between multiple files.
- Real-Time Data Visualization
Power BI converts complex datasets into easy-to-understand charts and visuals. Therefore, teams can instantly understand performance trends.
- Advertising Revenue Optimization
Advertising remains the main revenue source for TV networks. With a dashboard, managers can identify which channels, platforms, and genres generate the highest ad revenue.
- Viewer Engagement Analysis
Viewer numbers determine the success of television programs. By tracking viewer engagement, networks can improve their programming strategies.
- Better Decision Making
Clear insights help executives make informed decisions about programming schedules, advertising pricing, and audience targeting.
Key Features of the TV Channels Dashboard in Power BI
The TV Channels Dashboard in Power BI includes five interactive analytical pages. Each page focuses on a specific aspect of TV broadcasting performance.
Let us explore these pages in detail.
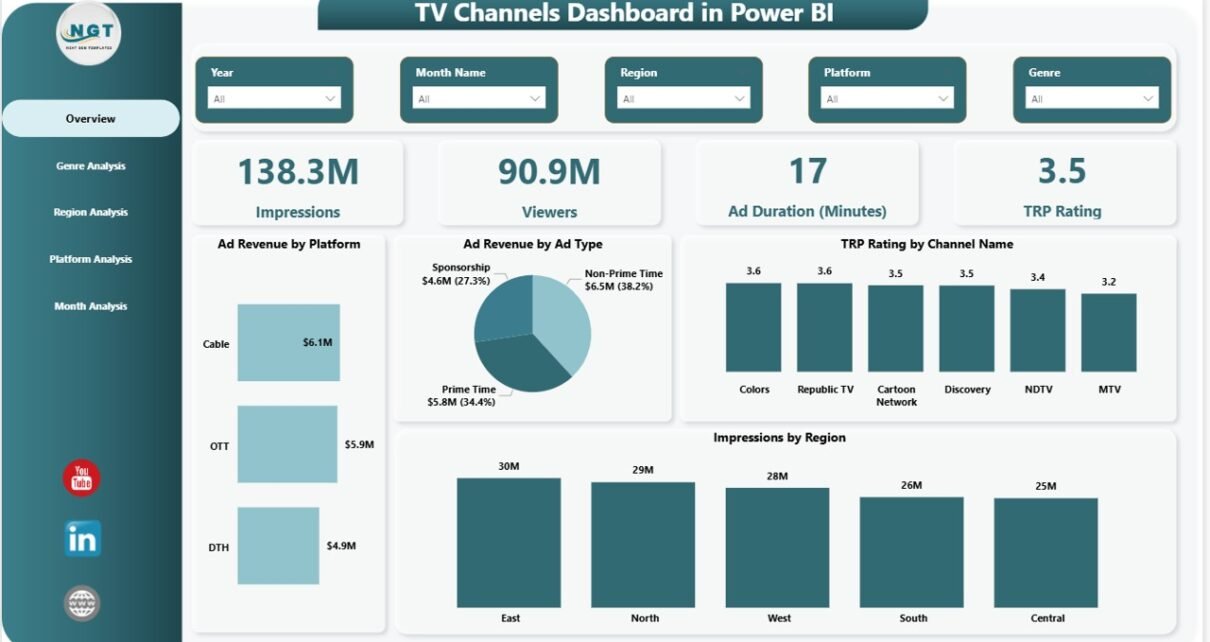
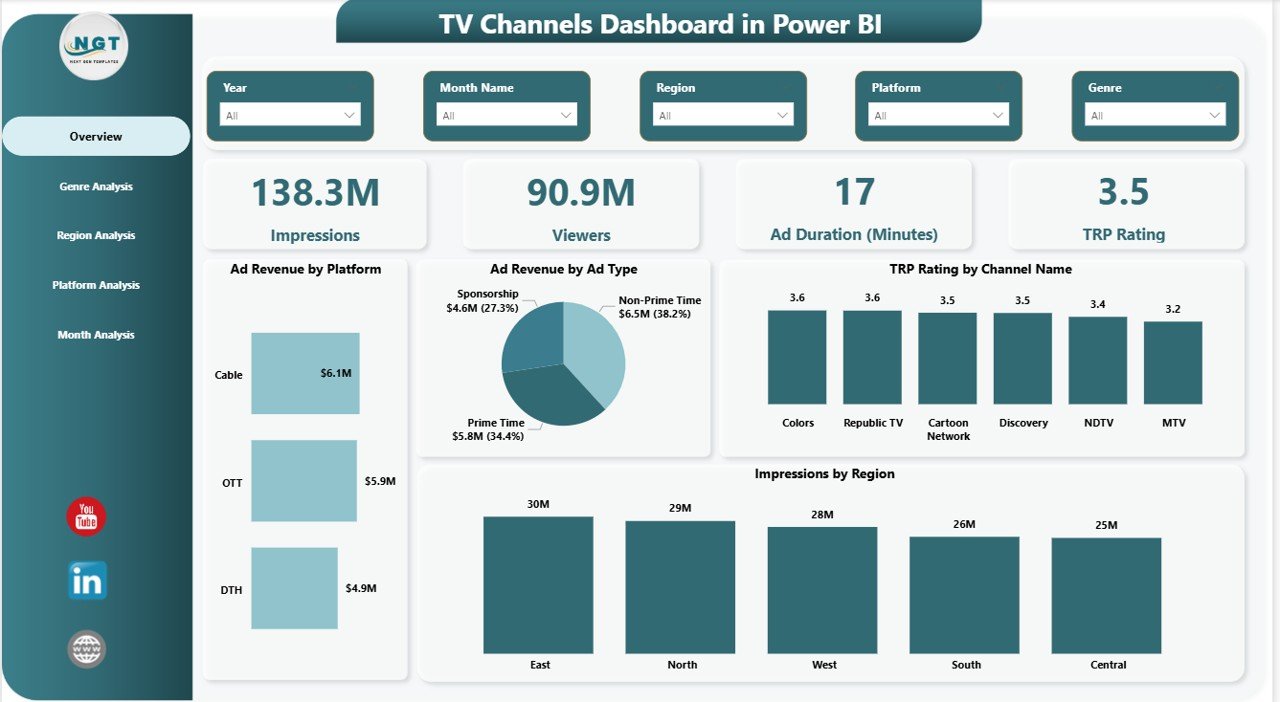
Overview Page – What Insights Does It Provide?
The Overview Page serves as the main summary dashboard. It provides a quick snapshot of the entire TV broadcasting operation.
Users can instantly understand overall performance through key metrics and charts.
KPI Cards
The dashboard includes four important KPI cards:
- Impressions
- Viewers
- Ad Duration (Minutes)
- TRP Rating
These KPIs help managers evaluate overall broadcasting performance at a glance.
Key Charts
The overview page also includes four analytical charts:
- Ad Revenue by Platform – Shows which platforms generate the highest advertising income.
- Ad Revenue by Ad Type – Displays performance of different advertising formats.
- TRP Rating by Channel Name – Helps identify the most popular TV channels.
- Impressions by Region – Shows which geographic areas generate the most audience impressions.
Because this page summarizes the entire dataset, executives can quickly evaluate business performance before exploring deeper analytics.
Click to buy TV Channels Dashboard in Power BI
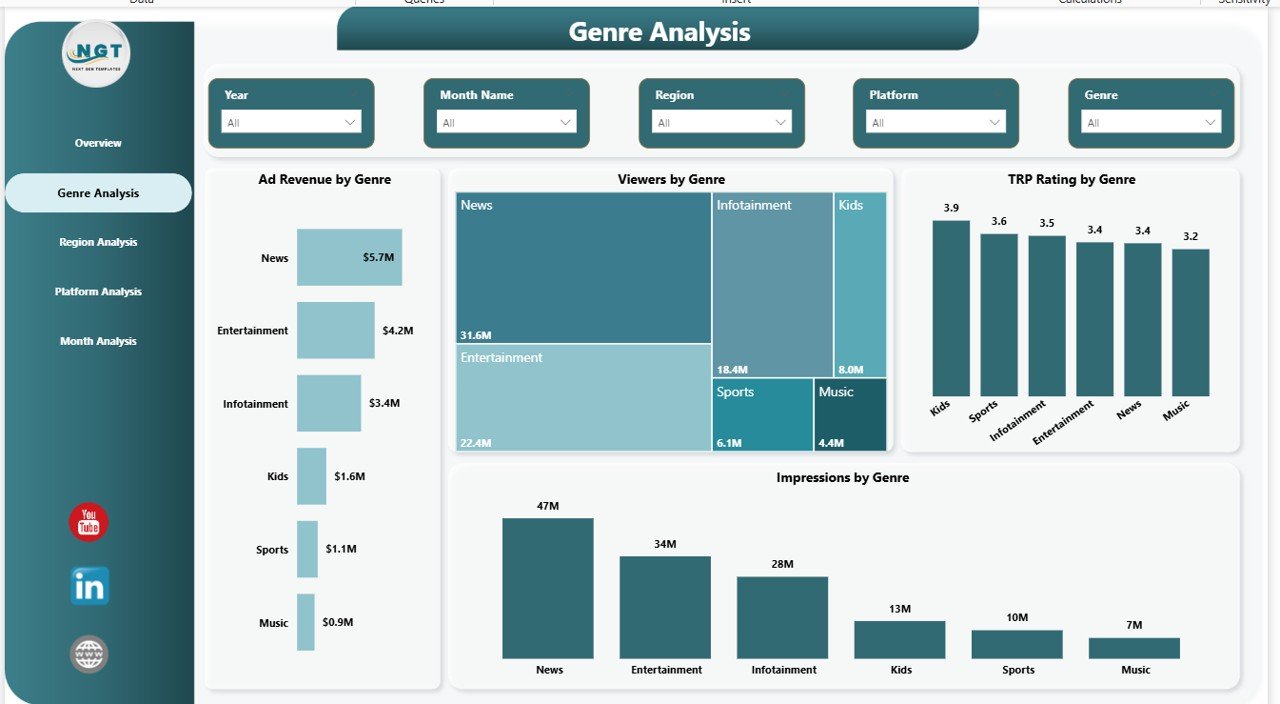
Genre Analysis – Which Genres Generate the Most Engagement?
Television networks broadcast various genres such as:
- News
- Sports
- Entertainment
- Movies
- Reality Shows
- Educational Content
However, not every genre attracts the same level of audience engagement.
The Genre Analysis Page helps identify the most profitable and popular content categories.
Key Charts
This page includes four charts:
- Ad Revenue by Genre
- Viewers by Genre
- TRP Rating by Genre
- Impressions by Genre
Using these visuals, managers can quickly determine:
- Which genres generate the highest revenue
- Which genres attract the most viewers
- Which genres deliver the best TRP ratings
As a result, programming teams can allocate more resources to high-performing genres.
Click to buy TV Channels Dashboard in Power BI
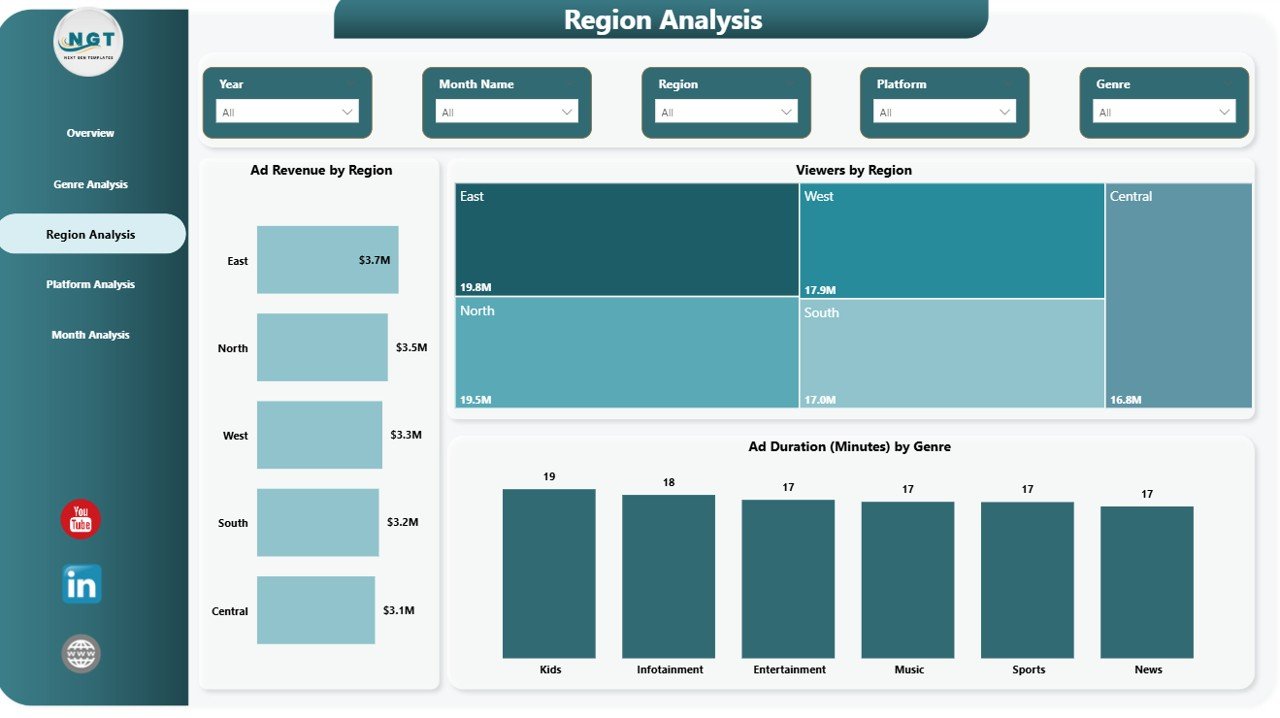
Region Analysis – Where Is the Audience Located?
Audience distribution often varies significantly across regions. Some areas generate high viewership while others produce limited engagement.
The Region Analysis Page helps networks understand geographic performance trends.
Key Charts
This page includes three analytical charts:
- Ad Revenue by Region
- Viewers by Region
- Ad Duration (Minutes) by Genre
These insights help networks answer important questions such as:
- Which regions generate the most advertising revenue?
- Which regions have the highest viewer engagement?
- Which content genres dominate certain regions?
Because of this information, networks can optimize their regional advertising strategies and content distribution.
Click to buy TV Channels Dashboard in Power BI
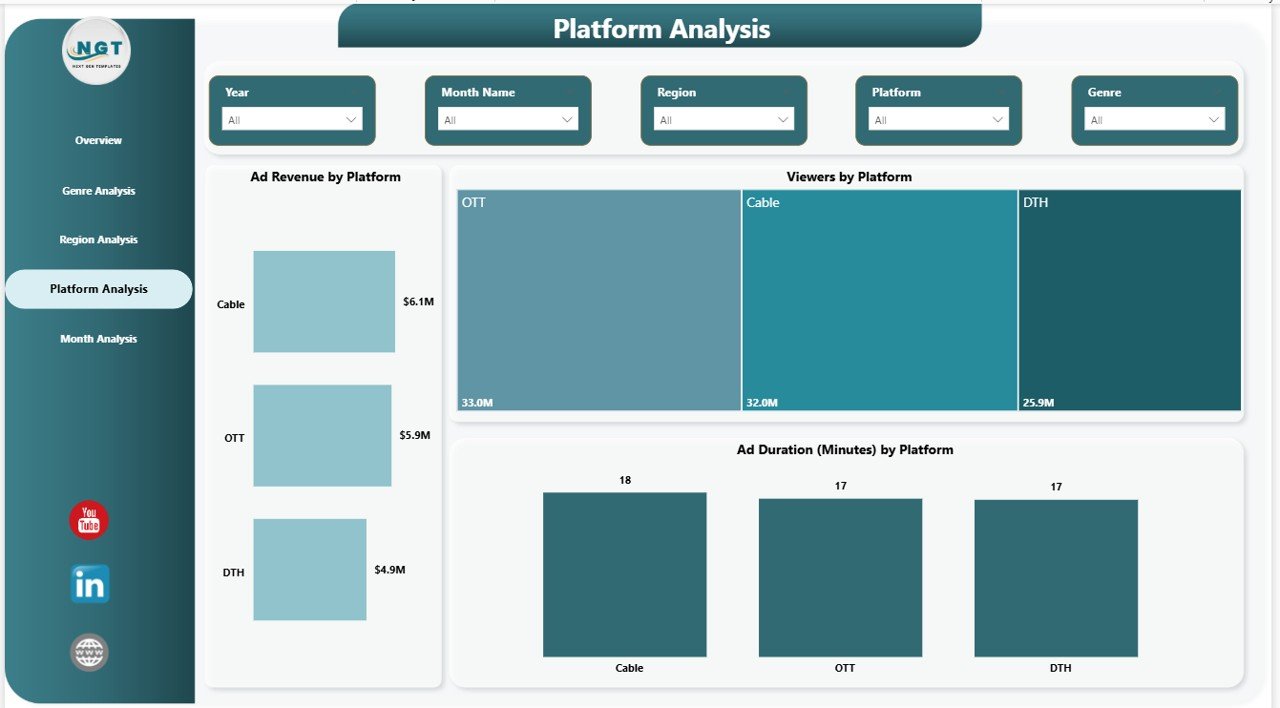
Platform Analysis – Which Platforms Deliver the Best Results?
Modern television content reaches audiences through multiple platforms including:
- Cable TV
- Satellite TV
- Digital streaming platforms
- Mobile applications
- Smart TVs
Therefore, networks must analyze which platform generates the most engagement and revenue.
The Platform Analysis Page helps organizations evaluate platform performance.
Key Charts
This page includes three important visuals:
- Ad Revenue by Platform
- Viewers by Platform
- Ad Duration (Minutes) by Platform
These insights allow companies to:
- Identify the most profitable broadcasting platform
- Analyze audience preferences
- Optimize platform-specific advertising strategies
As a result, networks can allocate resources more effectively.
Click to buy TV Channels Dashboard in Power BI
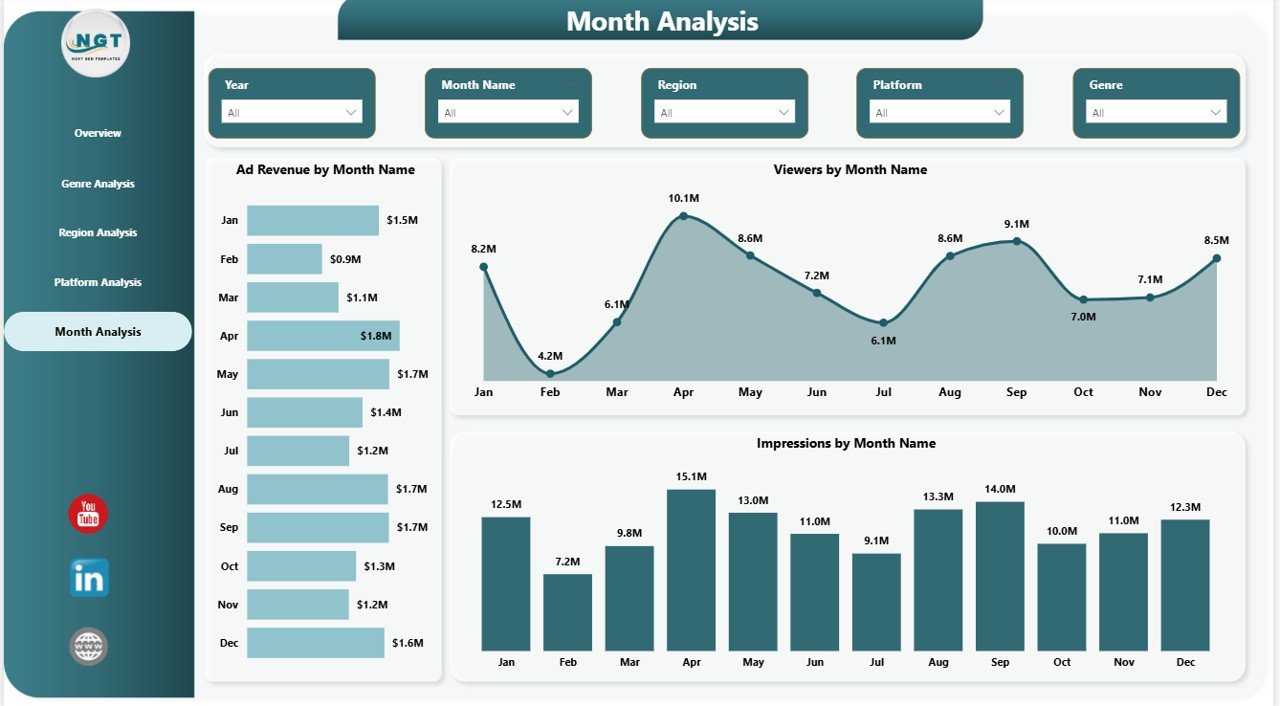
Month Analysis – How Does Performance Change Over Time?
Television performance changes throughout the year because of seasonal trends, events, and program launches.
The Month Analysis Page helps managers track performance trends over time.
Key Charts
This page includes three charts:
- Ad Revenue by Month Name
- Viewers by Month Name
- Impressions by Month Name
These visuals allow managers to:
- Identify peak viewing seasons
- Analyze revenue trends
- Understand audience behavior across months
Because of this data, networks can schedule programs and advertising campaigns more effectively.
Click to buy TV Channels Dashboard in Power BI
Important KPIs for a TV Channels Dashboard
A well-designed dashboard tracks key performance indicators that reflect the success of television broadcasting operations.
Some important KPIs include:
Advertising Performance KPIs
- Total Ad Revenue
- Revenue by Platform
- Revenue by Genre
- Revenue by Region
- Revenue by Channel
Audience Engagement KPIs
- Total Viewers
- Audience Impressions
- Viewer Growth Rate
- Viewer Distribution by Region
- Viewer Distribution by Platform
Broadcasting Efficiency KPIs
- Total Ad Duration (Minutes)
- Average Ad Duration
- Ad Frequency
Channel Performance KPIs
- TRP Rating
- TRP by Channel
- TRP by Genre
- TRP Trend
By tracking these KPIs, networks can improve broadcasting performance and increase advertising revenue.
Advantages of TV Channels Dashboard in Power BI
A TV Channels Dashboard in Power BI offers several benefits for television networks, advertisers, and media analysts.
- Real-Time Data Visualization
Power BI converts complex datasets into simple visual charts. Therefore, users can instantly understand broadcasting performance.
- Better Advertising Insights
The dashboard shows which platforms, genres, and regions generate the highest advertising revenue.
- Improved Viewer Analysis
Managers can analyze viewer behavior across channels, platforms, and content categories.
- Faster Decision Making
Interactive dashboards help executives make quick decisions based on real-time data.
- Increased Revenue Opportunities
By identifying high-performing channels and genres, networks can increase advertising opportunities.
- Centralized Reporting
All performance metrics appear in one dashboard, which reduces the need for multiple reports.
Opportunities for Improvement in TV Channel Analytics
Even though dashboards improve analytics significantly, organizations can enhance their reporting systems further.
Some improvement opportunities include:
- Integrating real-time broadcasting data
- Connecting streaming analytics platforms
- Adding AI-based audience predictions
- Including advertiser performance metrics
- Tracking content engagement trends
By implementing these improvements, networks can create even more powerful analytics systems.
Best Practices for the TV Channels Dashboard in Power BI
Organizations should follow several best practices to maximize the value of their Power BI dashboards.
- Define Clear KPIs
Before building a dashboard, teams should define the most important broadcasting metrics.
- Keep Visualizations Simple
Clear and simple charts improve readability and user experience.
- Use Interactive Filters
Slicers allow users to analyze data by region, platform, channel, and time.
- Update Data Regularly
Accurate and updated data ensures reliable insights.
- Optimize Dashboard Performance
Efficient data models improve dashboard loading speed.
- Train Users
Training helps managers understand how to interpret dashboard insights effectively.
How Can Media Companies Use This Dashboard?
Media organizations can use the TV Channels Dashboard in Power BI in several practical ways.
Programming Strategy
Networks can identify the most popular genres and schedule programs accordingly.
Advertising Strategy
Advertisers can evaluate which channels and regions provide the best return on investment.
Audience Targeting
Networks can understand viewer preferences across regions and platforms.
Revenue Optimization
Companies can maximize advertising revenue by focusing on high-performing channels.
Performance Monitoring
Executives can monitor broadcasting performance regularly.
Conclusion
Television broadcasting continues to evolve rapidly as audiences consume content across multiple platforms and regions. Because of this dynamic environment, TV networks must monitor their performance carefully.
A TV Channels Dashboard in Power BI provides a powerful solution for analyzing broadcasting metrics, advertising performance, viewer engagement, and TRP ratings.
Instead of reviewing multiple spreadsheets, managers can access all critical insights through one interactive dashboard. As a result, networks can identify profitable channels, optimize advertising strategies, and improve programming decisions.
Organizations that adopt data-driven analytics tools like Power BI gain a strong competitive advantage in the media industry.
Frequently Asked Questions (FAQs)
What is a TV Channels Dashboard?
A TV Channels Dashboard is an analytics tool that visualizes broadcasting performance metrics such as viewers, impressions, advertising revenue, and TRP ratings.
Why is Power BI useful for TV analytics?
Power BI provides interactive charts, real-time data visualization, and powerful filtering options. Therefore, it helps media companies analyze broadcasting data easily.
What KPIs are important for TV channel analytics?
Important KPIs include:
- TRP rating
- Viewer count
- Audience impressions
- Advertising revenue
- Ad duration
Who can use a TV Channels Dashboard?
Several professionals can use this dashboard, including:
- TV network executives
- Media analysts
- Advertising agencies
- Broadcasting managers
Can Power BI integrate with broadcasting data sources?
Yes. Power BI can connect with various data sources such as databases, spreadsheets, streaming analytics platforms, and advertising systems.
How often should TV analytics dashboards be updated?
Ideally, networks should update dashboards daily or in real time to ensure accurate performance monitoring.
Visit our YouTube channel to learn step-by-step video tutorials
Watch the step-by-step video tutorial:
Click to buy TV Channels Dashboard in Power BI