The gaming industry has evolved dramatically in recent years. Technologies such as Augmented Reality (AR) and Virtual Reality (VR) have transformed how people experience games. Because of this rapid innovation, gaming studios must constantly monitor performance metrics such as revenue, user engagement, development costs, and platform ratings.
However, many AR/VR gaming companies still rely on scattered spreadsheets and disconnected reports. As a result, studio managers struggle to track financial performance, user activity, and platform trends in one place.
Therefore, gaming studios need a centralized analytics system that converts raw gaming data into meaningful insights. This is where the AR/VR Gaming Studios Dashboard in Power BI becomes extremely valuable.
The AR/VR Gaming Studios Dashboard in Power BI helps studios monitor revenue performance, analyze player engagement, evaluate platform performance, and track profitability across different regions and gaming genres. Because Power BI provides powerful visual analytics, decision-makers can instantly understand key trends and make informed strategic decisions.
In this comprehensive guide, you will learn everything about the AR/VR Gaming Studios Dashboard in Power BI, including its features, advantages, best practices, and implementation strategies.
Click to Purchases AR/VR Gaming Studios Dashboard in Power BI
What Is an AR/VR Gaming Studios Dashboard in Power BI?
An AR/VR Gaming Studios Dashboard in Power BI is an interactive analytics tool designed to track key performance indicators related to AR and VR gaming operations.
This dashboard collects gaming studio data from different sources and displays it in interactive visual reports, charts, and KPI indicators.
As a result, gaming studios can easily monitor:
-
Revenue performance
-
User engagement metrics
-
Platform ratings
-
Development costs
-
Profit margins
-
Regional performance
Because Power BI provides dynamic filtering and interactive visualizations, studio managers can analyze gaming performance quickly and identify growth opportunities.
Why Do AR/VR Gaming Studios Need a KPI Dashboard?
The AR and VR gaming market continues to expand rapidly. However, as gaming studios launch multiple games across different platforms, managing performance becomes more complex.
Without a structured dashboard, studios face several challenges:
-
Difficulty tracking revenue across games
-
Limited visibility into player engagement metrics
-
Poor monitoring of development costs
-
Lack of insights into regional performance
-
Slow decision-making due to scattered reports
Therefore, a Power BI dashboard solves these problems by providing a single source of truth for gaming analytics.
With a centralized dashboard, gaming studios can:
-
Monitor financial performance
-
Analyze user behavior
-
Compare platform performance
-
Evaluate game monetization models
-
Improve profitability strategies
Consequently, studios can make faster and smarter business decisions.
Click to Purchases AR/VR Gaming Studios Dashboard in Power BI
Key Features of the AR/VR Gaming Studios Dashboard in Power BI
The AR/VR Gaming Studios Dashboard in Power BI contains five powerful pages that provide complete analytics about gaming performance.
Each page focuses on a different aspect of the gaming business.
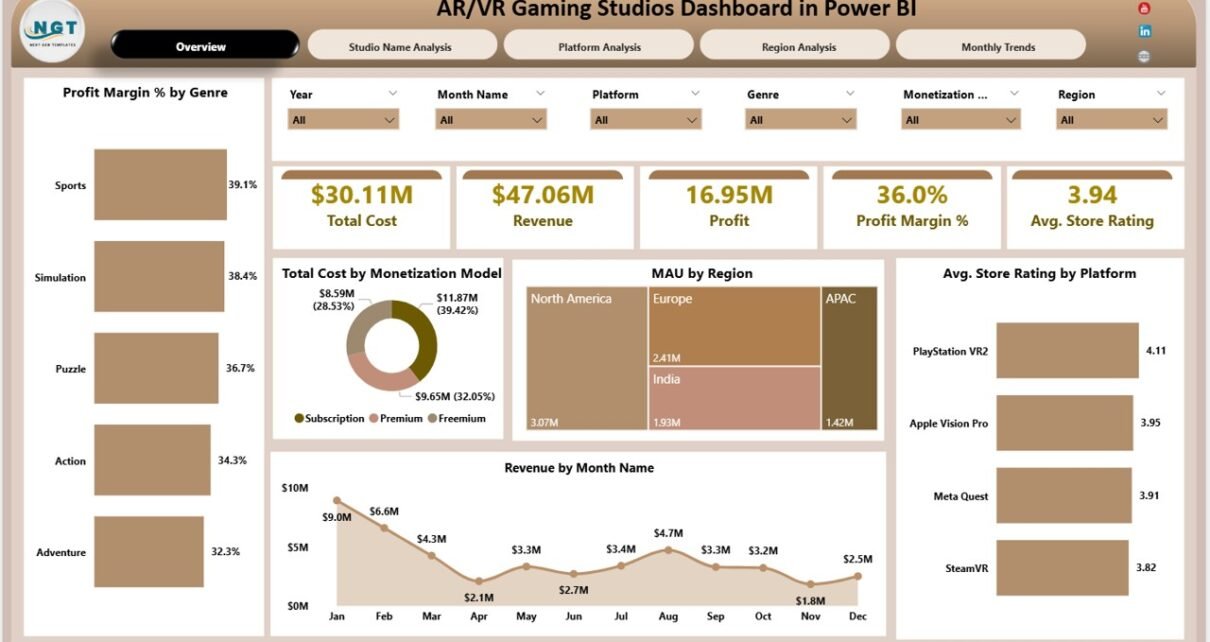
Overview Page – The Main Performance Dashboard
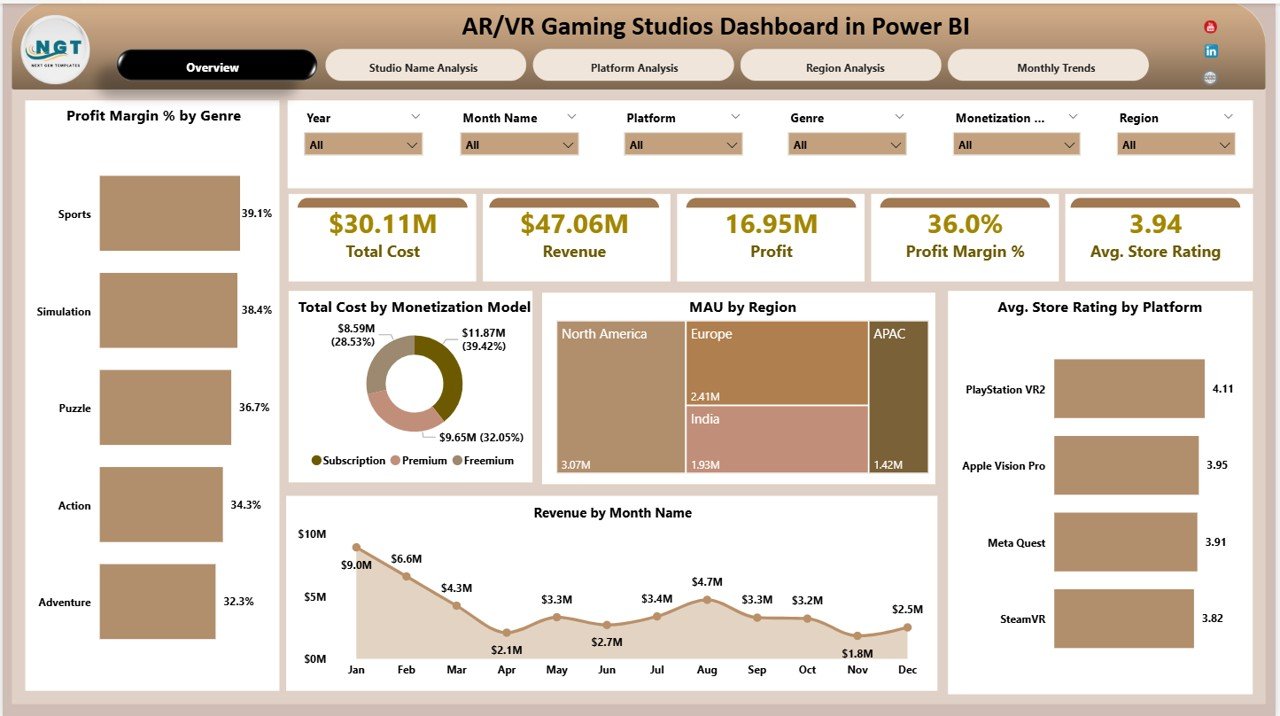
The Overview Page acts as the main summary page of the dashboard. It provides a quick snapshot of the gaming studio’s overall performance.
This page includes interactive slicers that allow users to filter data based on different conditions.
Key KPI Cards
The dashboard includes five important KPI cards:
-
Total Cost – Shows the total development and operational cost.
-
Revenue – Displays the total income generated from games.
-
Profit – Calculates the overall profit.
-
Profit Margin % – Shows profitability efficiency.
-
Average Store Rating – Displays the average game rating across platforms.
These KPI indicators allow decision-makers to instantly evaluate gaming performance.
Charts Included in the Overview Page
The Overview page also includes five powerful visual charts:
• Profit Margin % by Genre
This chart shows which gaming genres generate the highest profitability.
• Total Cost by Monetization Model
This visual helps analyze development cost distribution across monetization models such as in-app purchases, subscriptions, or premium games.
• MAU by Region
This chart tracks Monthly Active Users across different geographic regions.
• Average Store Rating by Platform
This visualization compares game ratings across platforms such as Oculus, PlayStation VR, Steam VR, and mobile platforms.
• Revenue by Month Name
This chart helps identify monthly revenue trends.
Because of these insights, studios can easily monitor financial and engagement performance.
Click to Purchases AR/VR Gaming Studios Dashboard in Power BI
Studio Name Analysis Page
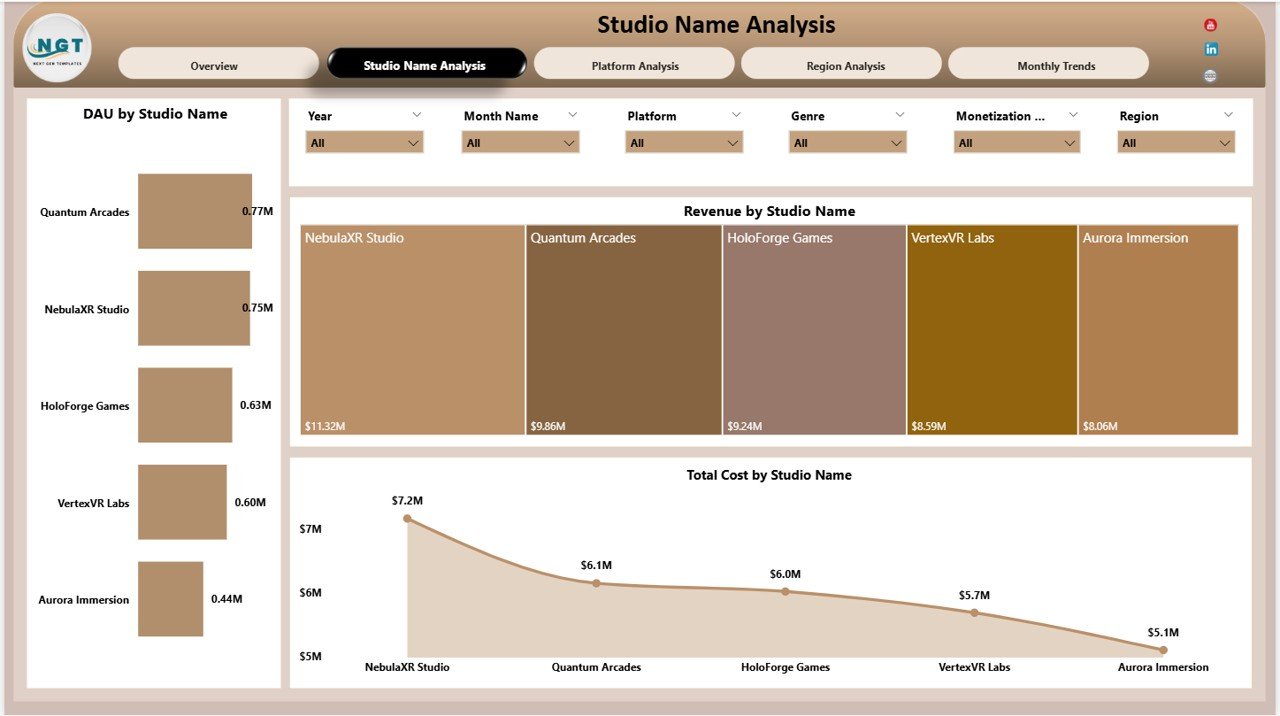
The Studio Name Analysis page focuses on performance comparison across different gaming studios or development teams.
This analysis helps organizations identify which studio performs best.
Charts Included
• DAU by Studio Name
This chart tracks Daily Active Users (DAU) across different studios.
• Revenue by Studio Name
This visual compares revenue performance among gaming studios.
• Total Cost by Studio Name
This chart shows how much each studio spends on development and operations.
Because of this analysis, organizations can identify:
-
High-performing studios
-
Studios with higher development costs
-
Teams generating maximum engagement
As a result, management can allocate resources more efficiently.
Platform Analysis Page
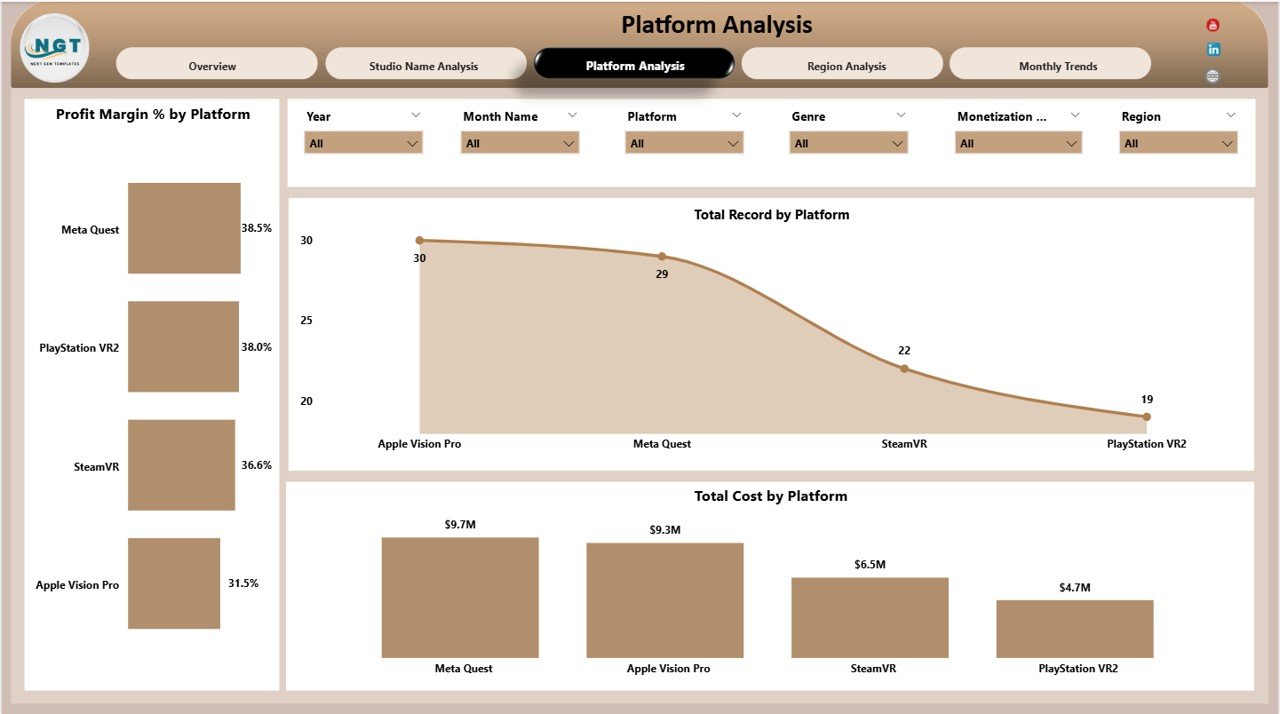
The Platform Analysis page evaluates how games perform across different gaming platforms.
Since AR/VR games run on multiple platforms, this page provides valuable insights into platform performance.
Charts Included
• Profit Margin % by Platform
This chart shows profitability levels across gaming platforms.
• Total Record by Platform
This visualization tracks the number of games or data records available for each platform.
• Total Cost by Platform
This chart analyzes development and operational costs associated with each platform.
Because of this analysis, gaming studios can determine:
-
Which platform generates the highest profit
-
Which platform requires more development investment
-
Where studios should focus future game launches
Region Analysis Page
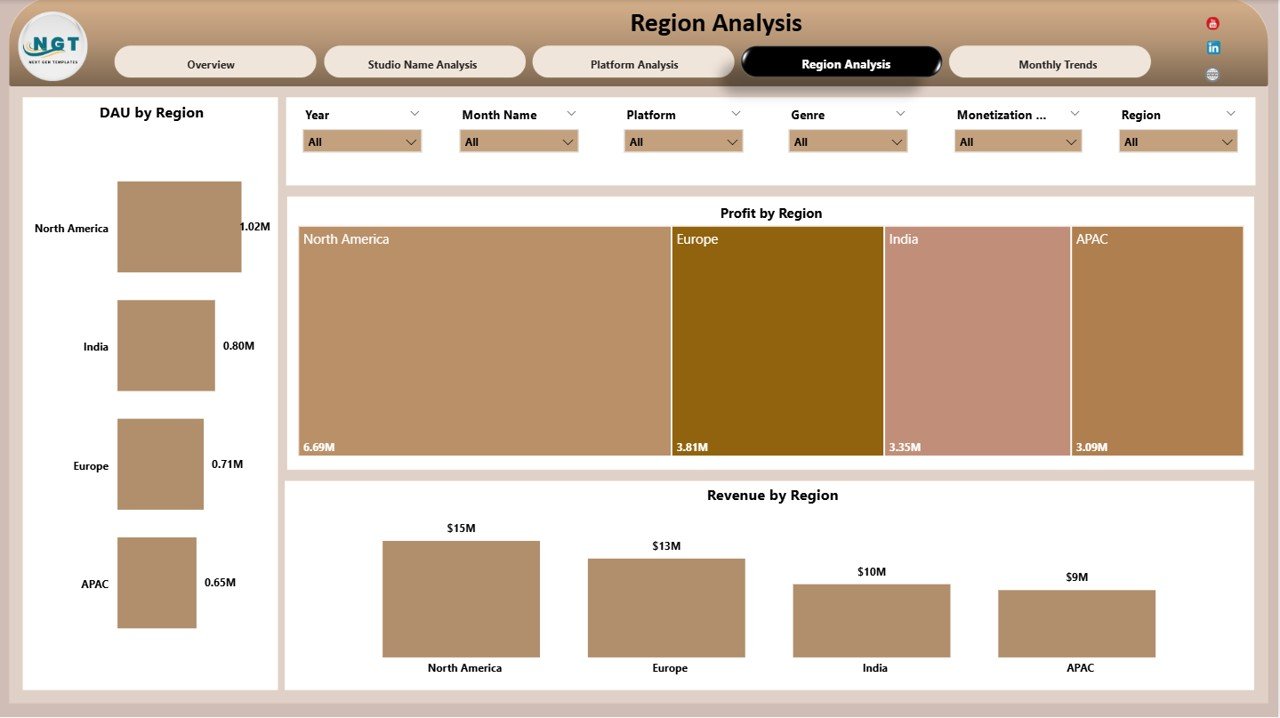
The Region Analysis page helps gaming companies understand how their games perform in different geographic markets.
Gaming demand varies across regions. Therefore, studios must track regional performance carefully.
Charts Included
• DAU by Region
This chart tracks daily player engagement across regions.
• Profit by Region
This visual displays profitability levels by geographic region.
• Revenue by Region
This chart shows revenue distribution across different markets.
Because of these insights, gaming companies can:
-
Identify high-growth markets
-
Optimize regional marketing campaigns
-
Allocate resources to profitable regions
Monthly Trends Page
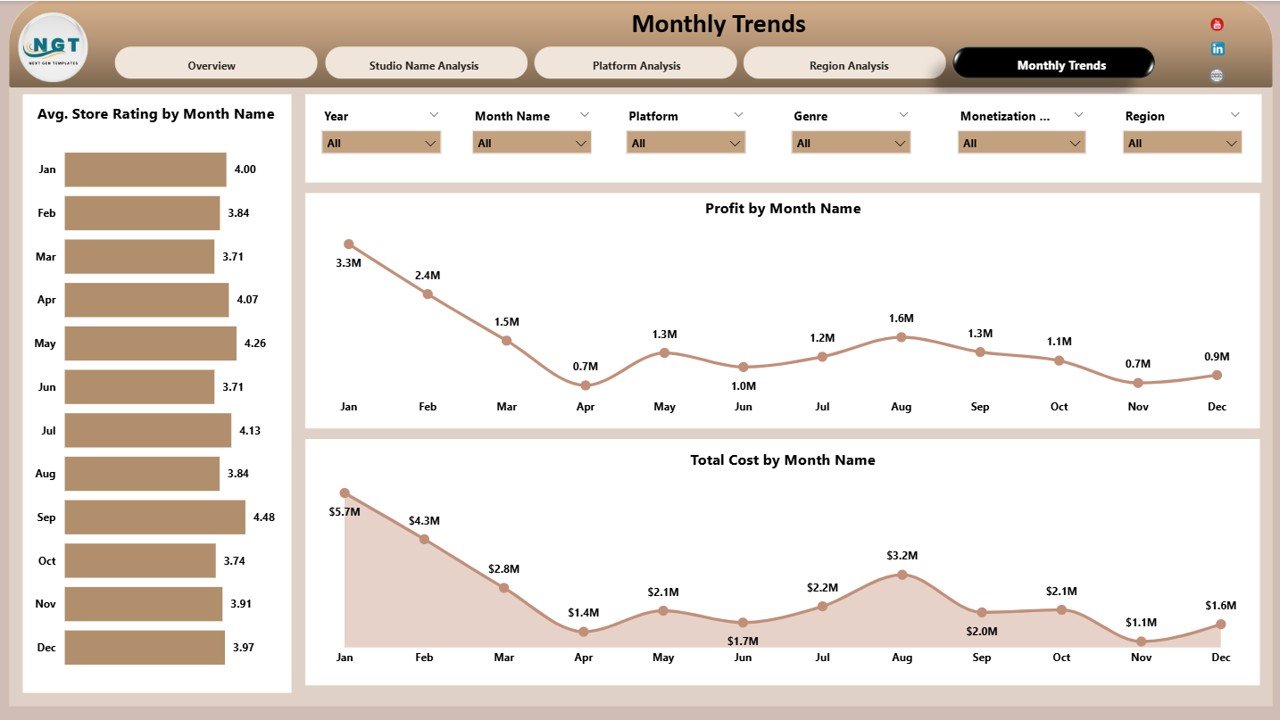
The Monthly Trends page focuses on time-based performance analysis.
It helps gaming studios track trends in ratings, costs, and profitability across different months.
Charts Included
• Average Store Rating by Month Name
This chart shows how game ratings change over time.
• Profit by Month Name
This visual tracks profit trends month by month.
• Total Cost by Month Name
This chart analyzes development and operational cost trends.
Because of this analysis, studios can evaluate:
-
Seasonal gaming performance
-
Cost fluctuations
-
Profit growth trends
As a result, companies can plan future releases more effectively.
Click to Purchases AR/VR Gaming Studios Dashboard in Power BI
Advantages of AR/VR Gaming Studios Dashboard in Power BI
Implementing this dashboard provides several benefits to gaming studios.
1. Centralized Performance Monitoring
The dashboard consolidates all gaming metrics in one place. Therefore, decision-makers can quickly monitor performance.
2. Faster Decision Making
Because Power BI provides real-time insights, managers can identify problems quickly and take action immediately.
3. Improved Revenue Tracking
The dashboard clearly displays revenue trends across games, platforms, and regions.
4. Better User Engagement Analysis
Gaming studios can track DAU and MAU metrics, which helps evaluate player engagement levels.
5. Profitability Insights
Profit margin charts help studios identify which games or platforms generate the most profit.
6. Platform Performance Comparison
Companies can easily compare AR/VR platform performance and adjust strategies accordingly.
7. Regional Market Insights
Regional analysis helps studios expand into high-growth gaming markets.
Opportunities for Improvement in AR/VR Gaming Analytics
Although this dashboard offers powerful insights, gaming studios can further improve analytics systems.
Integrate Real-Time Data
Studios should connect Power BI to live gaming databases to monitor real-time metrics.
Add Player Behavior Analytics
Tracking player sessions, retention rates, and gameplay patterns can provide deeper insights.
Include Marketing Analytics
Studios should analyze marketing campaign performance to understand how promotions impact downloads and revenue.
Implement Predictive Analytics
Using machine learning models can help forecast future player growth and revenue.
Click to Purchases AR/VR Gaming Studios Dashboard in Power BI
Best Practices for AR/VR Gaming Studios Dashboard in Power BI
Organizations should follow best practices to maximize the value of their dashboards.
Define Clear KPIs
Gaming studios should define KPIs such as:
-
DAU
-
MAU
-
Revenue
-
Profit Margin
-
Player Retention
-
Store Ratings
Clear KPIs improve performance monitoring.
Maintain Data Accuracy
Accurate data ensures reliable insights. Therefore, companies must regularly clean and validate their data.
Use Interactive Filters
Power BI slicers help users explore data quickly. Studios should implement dynamic filters for deeper analysis.
Monitor Engagement Metrics
Tracking player activity metrics helps studios understand user behavior.
Optimize Visual Design
Clear charts and simple visuals improve dashboard usability.
Regularly Update Data
Studios should update gaming data frequently to maintain accurate analytics.
Click to Purchases AR/VR Gaming Studios Dashboard in Power BI
How to Implement an AR/VR Gaming Dashboard in Power BI?
Organizations can follow a structured approach to implement this dashboard.
Step 1: Collect Gaming Data
Gather data from multiple sources:
-
Game analytics tools
-
Revenue systems
-
Player engagement platforms
-
App store ratings
Step 2: Prepare the Data
Clean and organize data in structured tables.
Step 3: Import Data into Power BI
Load datasets into Power BI Desktop.
Step 4: Create Data Relationships
Connect tables using keys such as:
-
Studio Name
-
Platform
-
Region
-
Game Genre
Step 5: Build Visualizations
Create charts and KPI cards for different metrics.
Step 6: Publish the Dashboard
Finally, publish the dashboard to the Power BI service for team access.
Conclusion
The AR/VR Gaming Studios Dashboard in Power BI provides a powerful analytics solution for gaming companies. Because AR and VR technologies continue to grow rapidly, studios must monitor financial performance, player engagement, and platform success carefully.
This dashboard consolidates key gaming metrics into interactive visual reports. As a result, gaming studios can easily track revenue, analyze player activity, evaluate platform performance, and identify profitable markets.
Furthermore, organizations can use these insights to improve game development strategies, optimize monetization models, and expand into new regions.
Therefore, implementing an AR/VR Gaming Studios Dashboard in Power BI helps studios make smarter decisions and achieve sustainable growth in the competitive gaming industry.
Click to Purchases AR/VR Gaming Studios Dashboard in Power BI
Frequently Asked Questions (FAQs)
What is an AR/VR Gaming Studios Dashboard?
An AR/VR Gaming Studios Dashboard is an analytics tool that monitors gaming performance metrics such as revenue, player engagement, costs, and profit.
Why should gaming studios use Power BI dashboards?
Power BI dashboards provide interactive analytics that help gaming studios analyze performance quickly and make better business decisions.
What KPIs are important for AR/VR gaming studios?
Key KPIs include:
-
Revenue
-
Profit Margin
-
DAU (Daily Active Users)
-
MAU (Monthly Active Users)
-
Store Ratings
-
Development Costs
How does a gaming dashboard improve decision making?
The dashboard provides real-time visual insights into gaming performance. As a result, managers can identify trends, detect issues, and take action faster.
Can Power BI integrate with gaming analytics tools?
Yes. Power BI can integrate with many gaming analytics platforms, databases, and cloud services.
Is Power BI suitable for gaming companies?
Yes. Power BI offers powerful visual analytics and scalability, which makes it ideal for gaming companies of all sizes.
Click to Purchases AR/VR Gaming Studios Dashboard in Power BI
Visit our YouTube channel to learn step-by-step video tutorials