Manufacturing industries continue to evolve rapidly. Among all modern manufacturing technologies, Additive Manufacturing, also known as 3D Printing, stands out as one of the most transformative innovations. Companies now produce complex components faster, reduce material waste, and create highly customized products.
However, managing additive manufacturing operations requires constant monitoring of production efficiency, machine performance, costs, and product quality. Without structured analytics, managers struggle to track production metrics and make informed decisions.
Therefore, organizations need a centralized performance monitoring tool that can track all important manufacturing metrics in one place. This is where the Additive Manufacturing Dashboard in Excel becomes extremely valuable.
Click to Purchases Additive Manufacturing Dashboard in Excel
The Additive Manufacturing Dashboard in Excel is a ready-to-use analytical tool designed to monitor production efficiency, maintenance expenses, product quality, and operational performance. Because Excel provides powerful data visualization and pivot-based analysis, manufacturers can easily understand performance trends and optimize their operations.
In this article, you will learn everything about the Additive Manufacturing Dashboard in Excel, including its features, benefits, analytical capabilities, best practices, and implementation strategies.
What Is an Additive Manufacturing Dashboard in Excel?
An Additive Manufacturing Dashboard in Excel is a structured reporting tool that helps manufacturing teams track and analyze key operational metrics related to 3D printing production processes.
The dashboard consolidates production data from multiple sources and converts it into interactive charts, KPI indicators, and analytical insights.
As a result, manufacturing managers can quickly understand:
-
Production performance
-
Machine efficiency
-
Product quality levels
-
Maintenance costs
-
Build time efficiency
-
Department productivity
Because the dashboard organizes complex manufacturing data into clear visual reports, decision-makers can identify issues quickly and improve operational performance.
Why Do Manufacturers Need an Additive Manufacturing Dashboard?
Modern additive manufacturing facilities operate with multiple machines, materials, departments, and production shifts. Therefore, monitoring performance manually becomes extremely difficult.
A dashboard solves this problem by transforming raw data into visual insights.
Organizations use an additive manufacturing dashboard to:
-
Monitor production efficiency
-
Track manufacturing costs
-
Evaluate machine performance
-
Measure product quality
-
Identify operational bottlenecks
-
Improve production planning
Consequently, managers gain full visibility into their manufacturing operations.
Key Features of the Additive Manufacturing Dashboard in Excel
The Additive Manufacturing Dashboard in Excel provides a structured and interactive environment for analyzing manufacturing performance.
Page Navigator
The dashboard includes a page navigator located on the left side of the interface.
This feature allows users to easily switch between different analytical pages of the dashboard. As a result, users can analyze manufacturing data from multiple perspectives without searching through worksheets.
The Excel desktop application file includes five analytical pages.
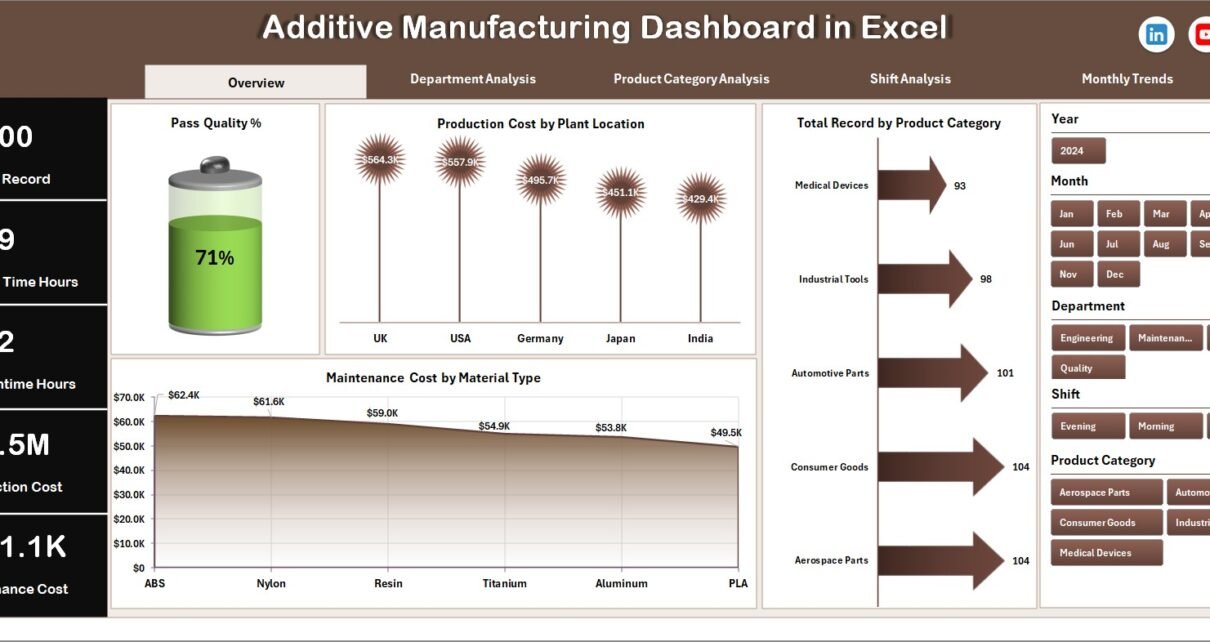
Overview Page: What Does the Main Dashboard Show?
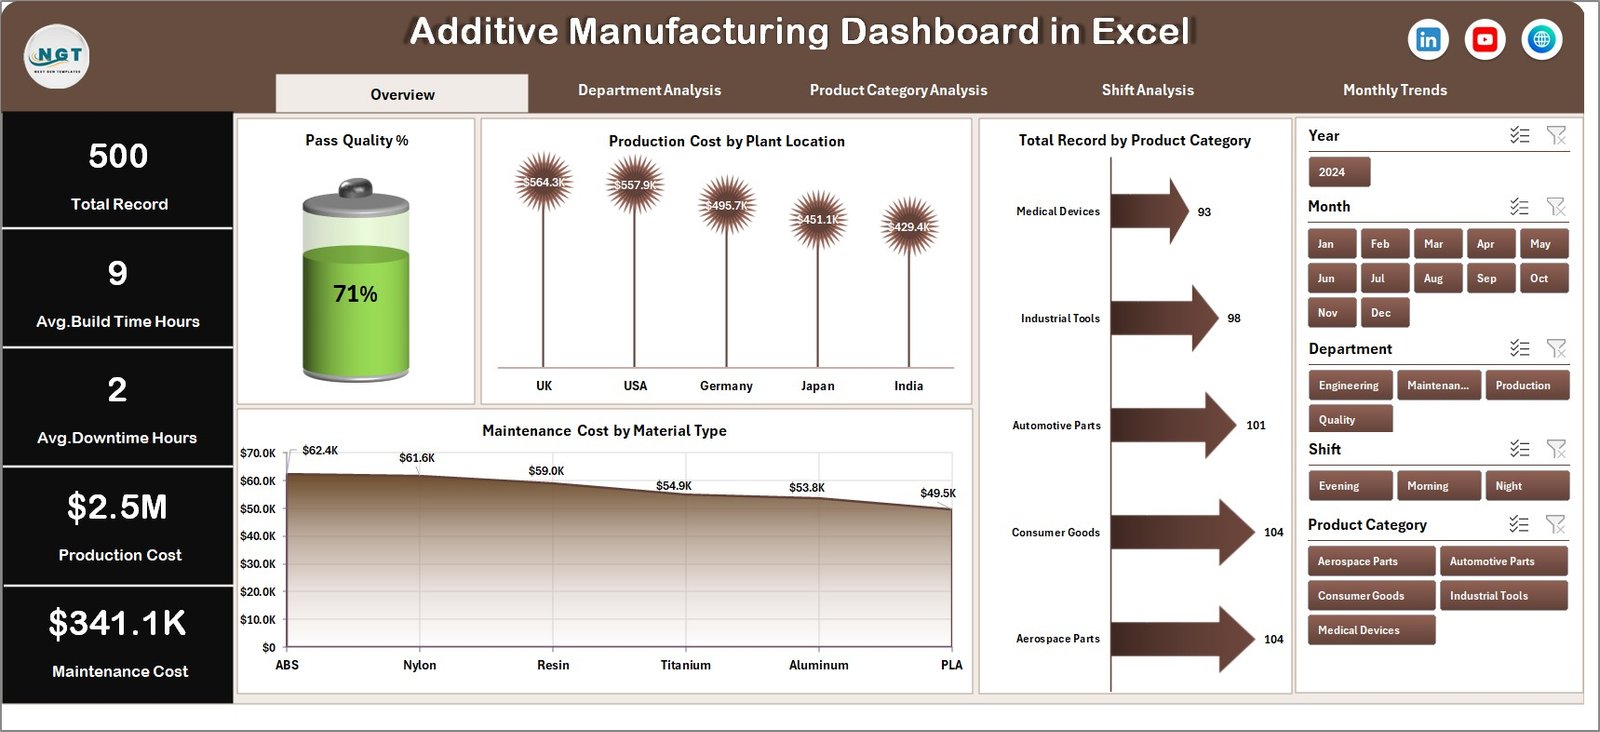
The Overview Page acts as the central monitoring panel for the entire manufacturing operation.
Users can immediately understand the overall performance of the manufacturing process.
Key Elements of the Overview Page
The page includes:
-
Right-side slicers for interactive filtering
-
Four KPI cards displaying key metrics
-
Four analytical charts
Charts Included in the Overview Page
The Overview page displays the following charts:
-
Pass Quality %
-
Production Cost by Plant Location
-
Total Records by Product Category
-
Maintenance Cost by Material Type
These visualizations provide a quick summary of manufacturing performance.
For example:
-
Managers can instantly identify plants with higher production costs.
-
Quality teams can monitor pass quality percentage.
-
Maintenance teams can analyze material-related maintenance expenses.
As a result, decision-makers gain a quick snapshot of operational health.
Department Analysis: How Can You Monitor Department Performance?
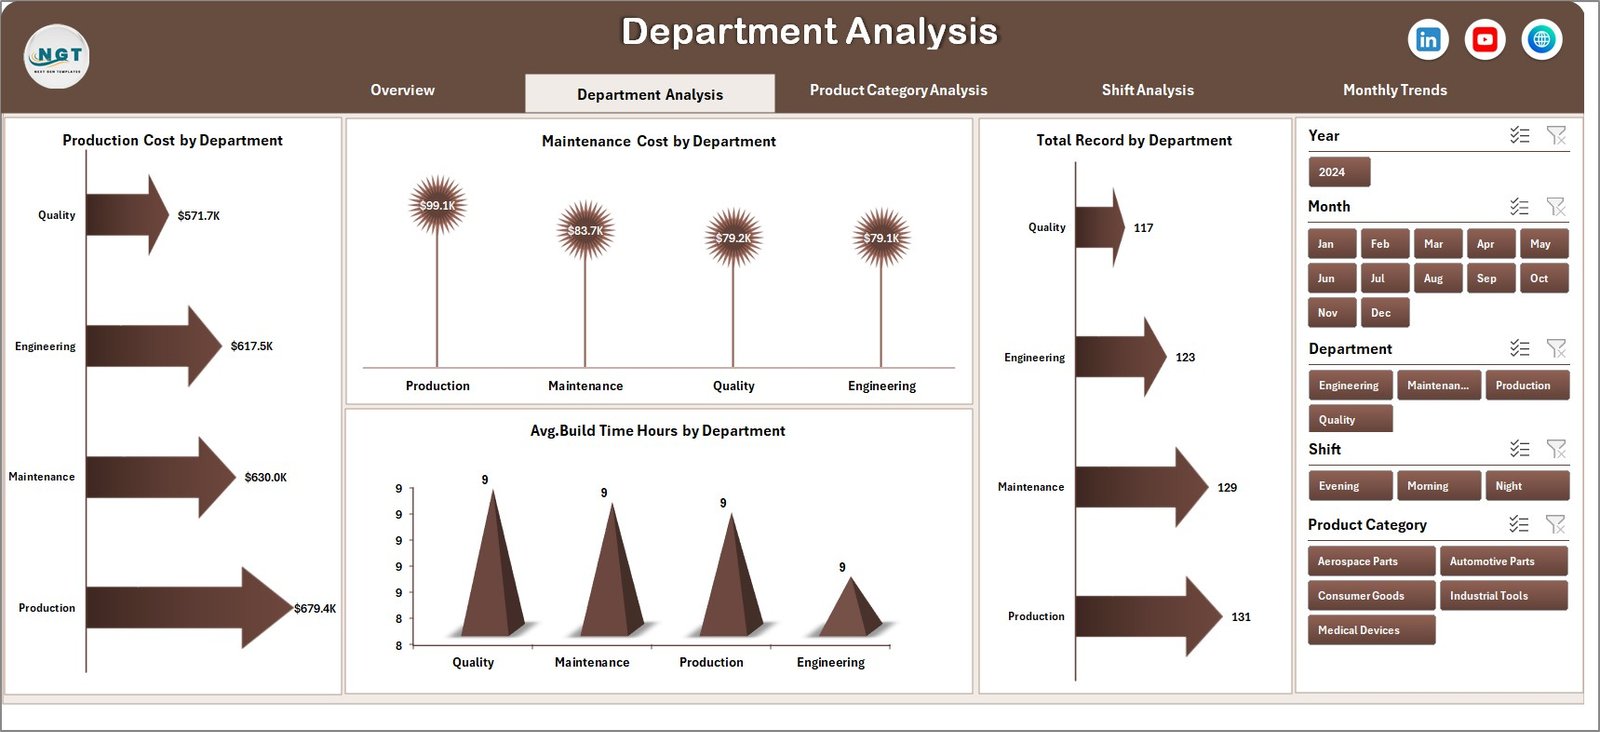
The Department Analysis Page focuses on department-level production performance.
Since different departments handle various stages of additive manufacturing, this page helps managers identify which departments perform efficiently and which require improvement.
Charts Included in Department Analysis
Click to Purchases Additive Manufacturing Dashboard in Excel
The page includes four analytical charts:
-
Production Cost by Department
-
Maintenance Cost by Department
-
Total Records by Department
-
Average Build Time (Hours) by Department
What Insights Can This Page Provide?
Managers can easily:
-
Compare production costs across departments
-
Identify departments with higher maintenance expenses
-
Evaluate workload distribution
-
Analyze build time efficiency
Therefore, organizations can improve department-level productivity.
Product Category Analysis: How Can You Evaluate Product Performance?
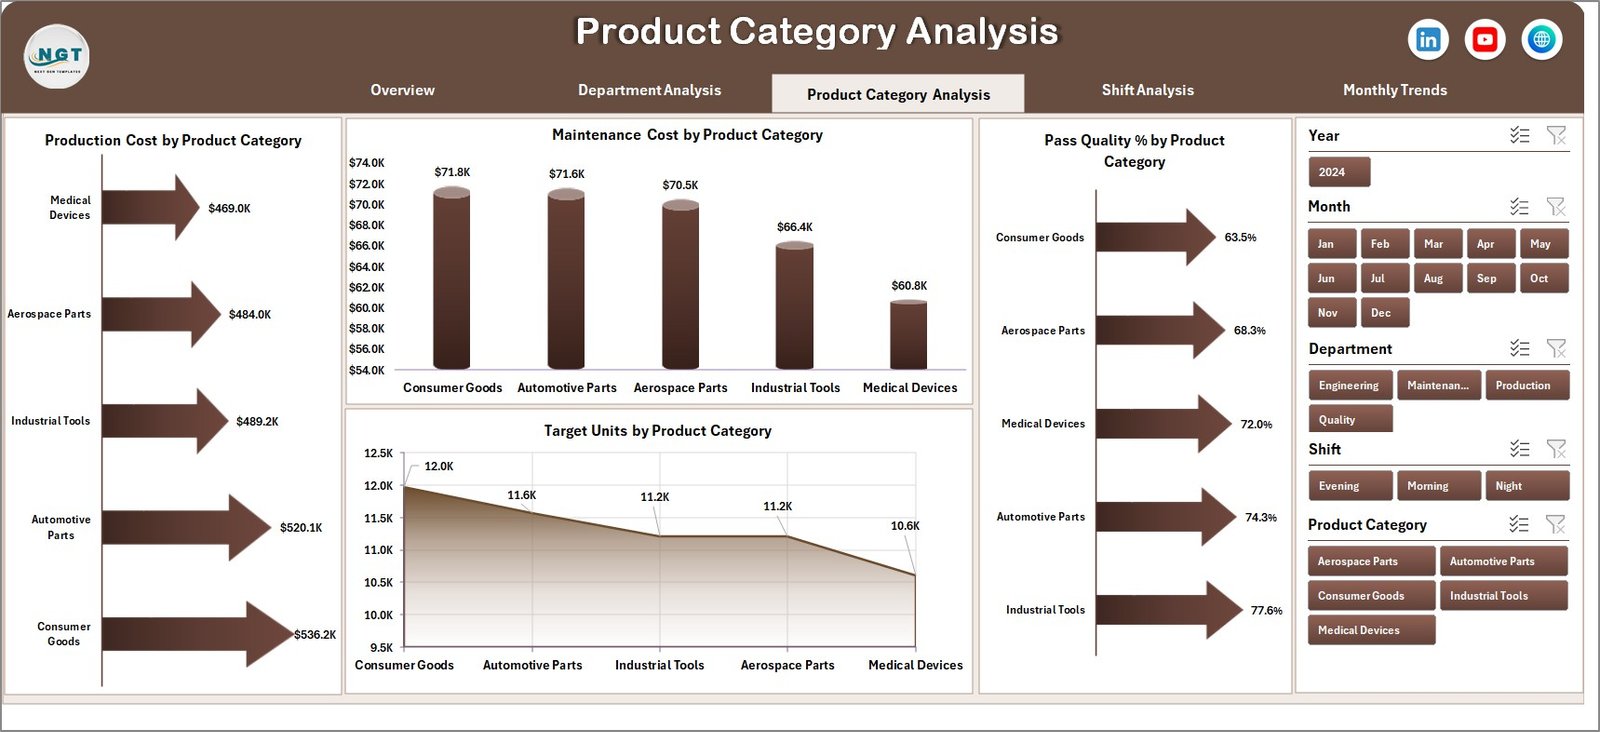
Different product categories often require different materials, build times, and production costs. Therefore, analyzing performance by product category becomes extremely important.
The Product Category Analysis Page helps manufacturers understand how different product lines perform.
Charts Included in Product Category Analysis
This page contains the following charts:
-
Production Cost by Product Category
-
Maintenance Cost by Product Category
-
Pass Quality % by Product Category
-
Target Units by Product Category
Insights from This Page
Managers can quickly:
-
Identify costly product categories
-
Evaluate quality performance
-
Monitor production targets
-
Improve product design strategies
Consequently, companies can optimize product manufacturing processes.
Shift Analysis: How Does Shift Performance Impact Manufacturing?
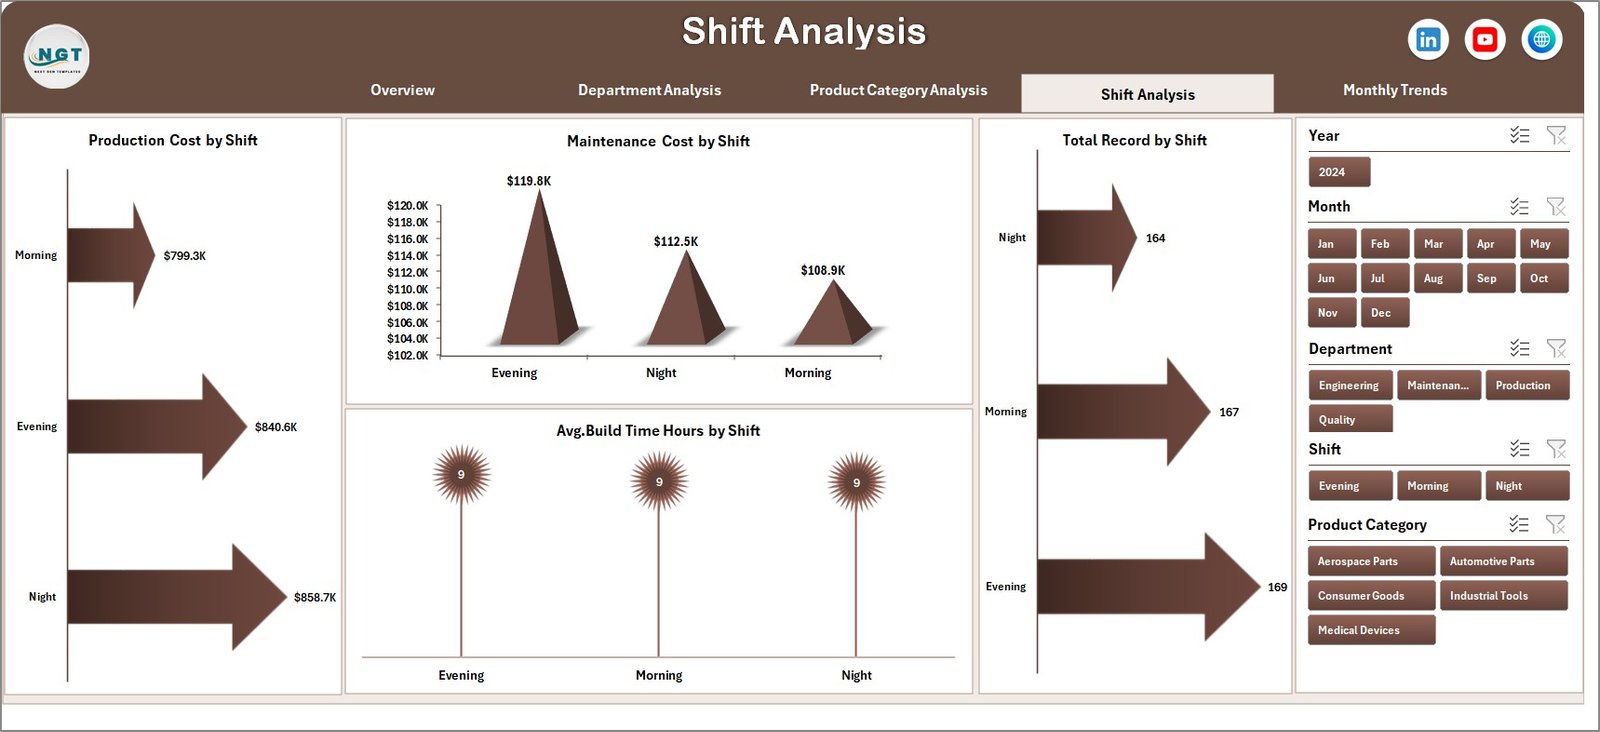
Manufacturing operations typically run in multiple shifts. However, productivity often varies between shifts.
The Shift Analysis Page allows managers to evaluate performance across different shifts.
Click to Purchases Additive Manufacturing Dashboard in Excel
Charts Included in Shift Analysis
The page contains four charts:
-
Production Cost by Shift
-
Maintenance Cost by Shift
-
Total Records by Shift
-
Average Build Time Hours by Shift
Insights from Shift Analysis
This analysis helps organizations:
-
Compare productivity between shifts
-
Identify operational inefficiencies
-
Optimize workforce planning
-
Improve machine utilization
As a result, companies can ensure consistent production performance throughout the day.
Month Analysis: How Can Monthly Trends Improve Production Planning?
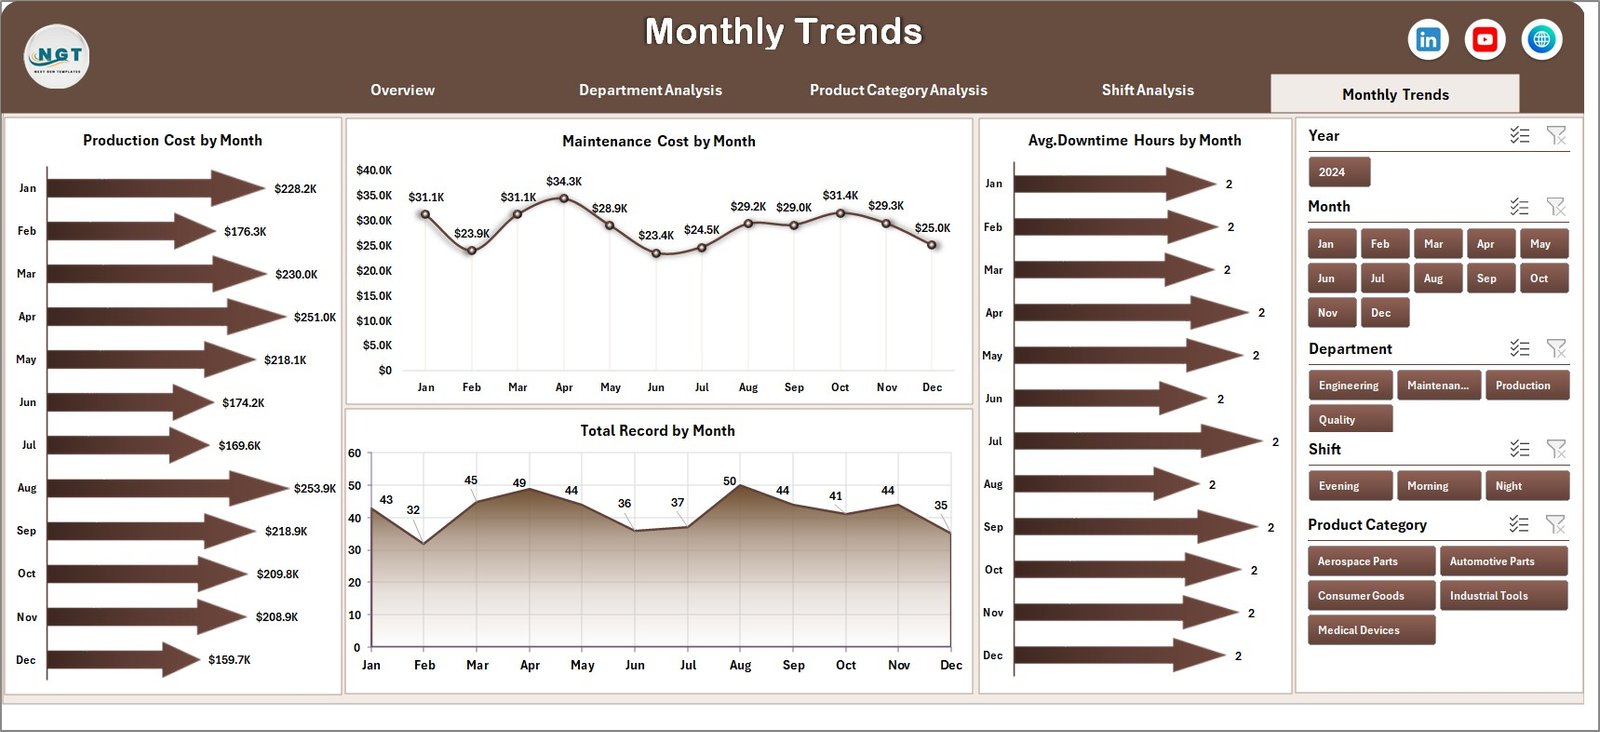
Manufacturing performance often changes throughout the year. Therefore, monitoring monthly trends helps organizations understand long-term patterns.
The Month Analysis Page focuses on time-based performance tracking.
Charts Included in Month Analysis
This page includes the following charts:
-
Production Cost by Month
-
Maintenance Cost by Month
-
Total Records by Month
-
Average Build Time Hours by Month
Insights from Monthly Analysis
Managers can analyze:
-
Seasonal production changes
-
Maintenance cost patterns
-
Production growth trends
-
Build time improvements
Therefore, organizations can improve long-term production planning.
Support Sheet and Data Sheet
The dashboard also includes supporting worksheets that power the entire analytical system.
Data Sheet
The Data Sheet contains the raw data used for analysis. This dataset typically includes columns such as:
-
Record ID
-
Department
-
Product Category
-
Shift
-
Plant Location
-
Production Cost
-
Maintenance Cost
-
Build Time
-
Quality Status
-
Material Type
-
Production Date
Since the data sheet stores structured records, pivot tables can easily generate dynamic charts.
Support Sheet
The Support Sheet contains helper tables and calculations required for dashboard functionality.
For example, it may include:
-
Lookup tables
-
KPI formulas
-
Pivot table support calculations
-
Data validation lists
As a result, the dashboard works smoothly and updates automatically when new data is added.
Advantages of the Additive Manufacturing Dashboard in Excel
The dashboard offers several benefits for manufacturing organizations.
📊 Improved Production Visibility
-
Managers gain a complete overview of manufacturing performance.
-
Production teams can quickly identify operational issues.
⚙️ Better Machine Performance Monitoring
-
Maintenance teams can track machine-related expenses.
-
Engineers can analyze build time efficiency.
💰 Cost Optimization
-
Managers can monitor production costs by plant, department, and product.
-
Organizations can identify cost-saving opportunities.
📈 Data-Driven Decision Making
-
Visual charts simplify complex manufacturing data.
-
Leaders can make faster and smarter decisions.
🧩 Centralized Performance Monitoring
-
All important metrics appear in one place.
-
Teams no longer need multiple reports.
-
Click to Purchases Additive Manufacturing Dashboard in Excel
Opportunities for Improvement in Additive Manufacturing Analytics
Although dashboards provide powerful insights, organizations can further improve their analytics.
🚀 Integrate Machine Data Automatically
-
Connect the dashboard with machine sensors.
-
Automate production data collection.
📊 Add Predictive Analytics
-
Use historical trends to predict machine failures.
-
Forecast production capacity.
📉 Monitor Downtime Metrics
-
Track machine downtime
-
Identify root causes of operational delays
📦 Include Inventory Metrics
-
Monitor material consumption
-
Track material cost efficiency
These improvements can make the dashboard even more powerful.
Best Practices for the Additive Manufacturing Dashboard in Excel
Organizations should follow several best practices when implementing the dashboard.
Keep Data Structured
-
Use consistent column names
-
Avoid merged cells in data tables
-
Maintain proper data types
Update Data Regularly
-
Add new production records frequently
-
Ensure data accuracy before analysis
Use Pivot Tables for Analysis
-
Pivot tables simplify dynamic reporting
-
Pivot charts update automatically
Monitor Key KPIs
Track important manufacturing metrics such as:
-
Pass Quality %
-
Production Cost
-
Build Time Hours
-
Maintenance Cost
-
Production Volume
Maintain Dashboard Simplicity
-
Avoid cluttered charts
-
Focus on meaningful insights
How Can Companies Implement This Dashboard Successfully?
Organizations can implement the dashboard in a few simple steps.
Step 1: Collect Manufacturing Data
Gather data from:
-
Production machines
-
ERP systems
-
Quality control reports
-
Maintenance logs
Step 2: Structure the Data
Organize the data into structured columns.
Step 3: Create Pivot Tables
Use pivot tables to summarize production data.
Step 4: Build Charts
Create charts to visualize the insights.
Step 5: Add Slicers
Add slicers for filtering by:
-
Department
-
Product category
-
Shift
-
Month
Step 6: Design Dashboard Layout
Arrange charts and KPI cards for easy interpretation.
Conclusion
Additive manufacturing continues to transform modern production processes. However, managing these operations requires structured analytics and clear performance monitoring.
The Additive Manufacturing Dashboard in Excel provides a powerful solution for tracking production costs, build times, maintenance expenses, and product quality. Because the dashboard converts raw manufacturing data into meaningful visual insights, managers can quickly identify performance gaps and improve operational efficiency.
Moreover, organizations can use this dashboard to optimize production strategies, reduce costs, and enhance product quality. As a result, manufacturers can stay competitive in the rapidly evolving world of 3D printing and advanced manufacturing.
Frequently Asked Questions (FAQs)
What is additive manufacturing?
Additive manufacturing refers to a production process where machines build objects layer by layer using digital designs. Many people also call this technology 3D printing.
Why should manufacturers use dashboards?
Dashboards allow manufacturers to monitor production metrics, track costs, analyze performance, and make data-driven decisions quickly.
Can Excel handle manufacturing dashboards effectively?
Yes. Excel supports pivot tables, charts, slicers, and formulas, which makes it an excellent tool for building manufacturing dashboards.
What KPIs should be tracked in additive manufacturing?
Common KPIs include:
-
Pass Quality %
-
Production Cost
-
Machine Utilization
-
Build Time
-
Maintenance Cost
-
Production Volume
Can this dashboard work with Power BI?
Yes. Organizations can export the Excel dataset to Power BI for more advanced analytics and real-time dashboards.
Visit our YouTube channel to learn step-by-step video tutorials